A note on lower timeframe confirming price action…
Waiting for lower timeframe confirmation is our main tool to confirm strength within higher timeframe zones, and has really been the key to our trading success. It takes a little time to understand the subtle nuances, however, as each trade is never the same, but once you master the rhythm so to speak, you will be saved from countless unnecessary losing trades. The following is a list of what we look for:
- A break/retest of supply or demand dependent on which way you’re trading.
- A trendline break/retest.
- Buying/selling tails – essentially we look for a cluster of very obvious spikes off of lower timeframe support and resistance levels within the higher timeframe zone.
- Candlestick patterns. We tend to only stick with pin bars and engulfing bars as these have proven to be the most effective.
For us, lower timeframe confirmation starts on the M15 and finishes up on the H1, since most of our higher timeframe areas begin with the H4. Stops usually placed 5-10 pips beyond your confirming structures.
EUR/USD:
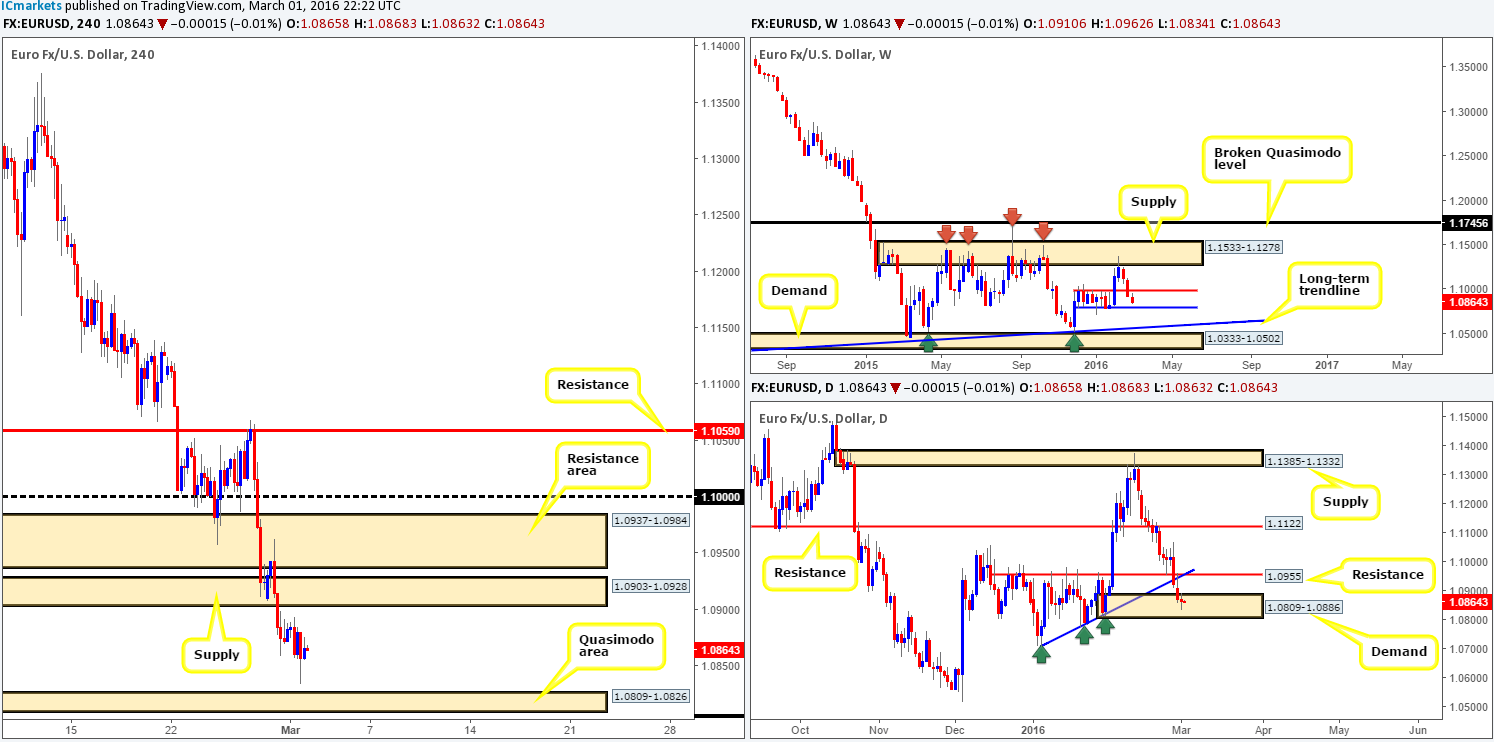
Despite the EUR/USD dropping to lows of 1.0835 following positive U.S. manufacturing data, the single currency had a relatively quiet day with price consolidating in a relatively tight range between 1.0856/1.0884. Due to this, much of the following analysis will be structured in the same manner as the previous report.
From the H4 chart, we can clearly see that the buyers and sellers continue loitering mid-range between a Quasimodo support area at 1.0809-1.0826 and a recently broken demand (now supply) at 1.0903-1.0928. Additionally, daily action remains trading within the confines of a demand zone drawn from 1.0809-1.0886, whilst up on the weekly chart, we see possibility for further downside to weekly support at 1.0796.
Therefore, our plan of attack is as follows:
- To trade short, price would need to retest the underside of the current H4 supply followed by a lower timeframe sell signal. However, caution is still advised here since the above said daily demand could potentially halt selling before price reaches the aforementioned H4 Quasimodo area – the take-profit target.
- In regards to buying this pair, the only place, in our opinion, that would yield a large enough bounce to the upside would be the aforementioned H4 Quasimodo support area. Not only is it lodged deep within the extremes of daily demand, but it also sits just above both weekly support (see above for levels) and also psychological support 1.0800. Consequent to this, there is a possibility of a fakeout below the H4 area before buyers step in, as such; we would recommend waiting for the lower timeframes to confirm buying strength exists before risking capital here.
Levels to watch/live orders:
- Buys: 1.0809-1.0826 [Tentative – confirmation required] (Stop loss: dependent on where one confirms this area).
- Sells: 1.0903-1.0928 [Tentative – confirmation required] (Stop loss: dependent on where one confirms this area).
GBP/USD: (Slightly revised)
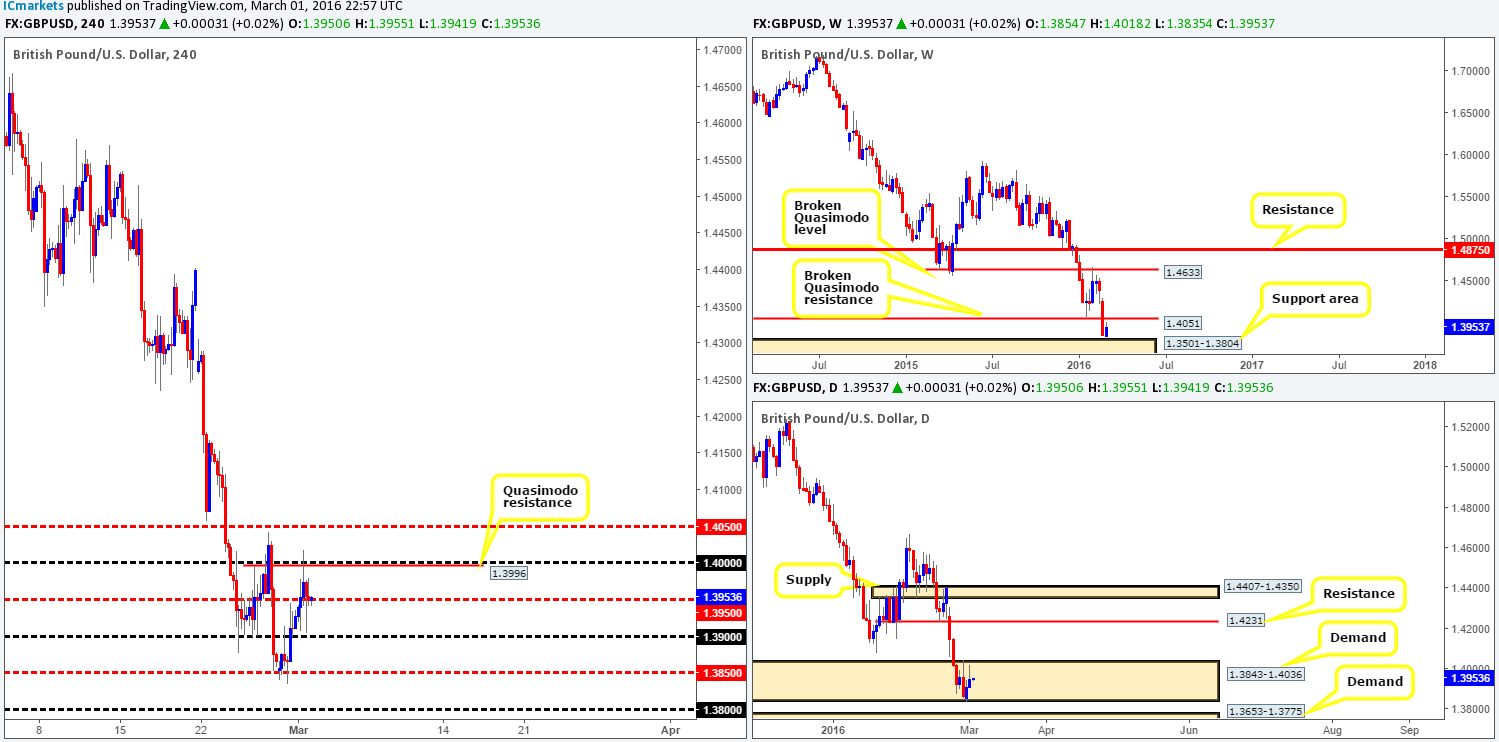
The GBP/USD pair, as you can see, extended its recovery from daily demand at 1.3843-1.4036 for the second consecutive day. Nevertheless, we feel bids are drying up around this area and will likely struggle to trade higher this week. Not only is price currently reacting to a H4 Quasimodo resistance level at 1.3996 that fuses with the large-figure number 1.4000, but just above here is a weekly broken Quasimodo resistance at 1.4051. Until the time price closes above the 1.4051 mark on a weekly basis, our expectation remains to the downside.
Be that as it may, should the mid-level number 1.3950 continue to hold as support, we may see price touch gloves with the mid-level barrier 1.4050 today which could make for a nice platform to short from. The ultimate target from this level would be 1.3800. Not only does this number converge with the top-side of the weekly support zone at 1.3804, but it also sits just above a daily demand seen at 1.3653-1.3775. Therefore, one could look to close out shorts here and, due to the confluence seen, look to take a long position. This would effectively be considered a counter-trend trade, but due to the structure supporting a long, it will likely see a bounce at the very least.
Levels to watch/live orders:
- Buys: 1.3800 [Tentative – confirmation required] (Stop loss: dependent on where one confirms this level).
- Sells: 1.4050 region [Tentative – confirmation required] (Stop loss: dependent on where one confirms this area).
AUD/USD:
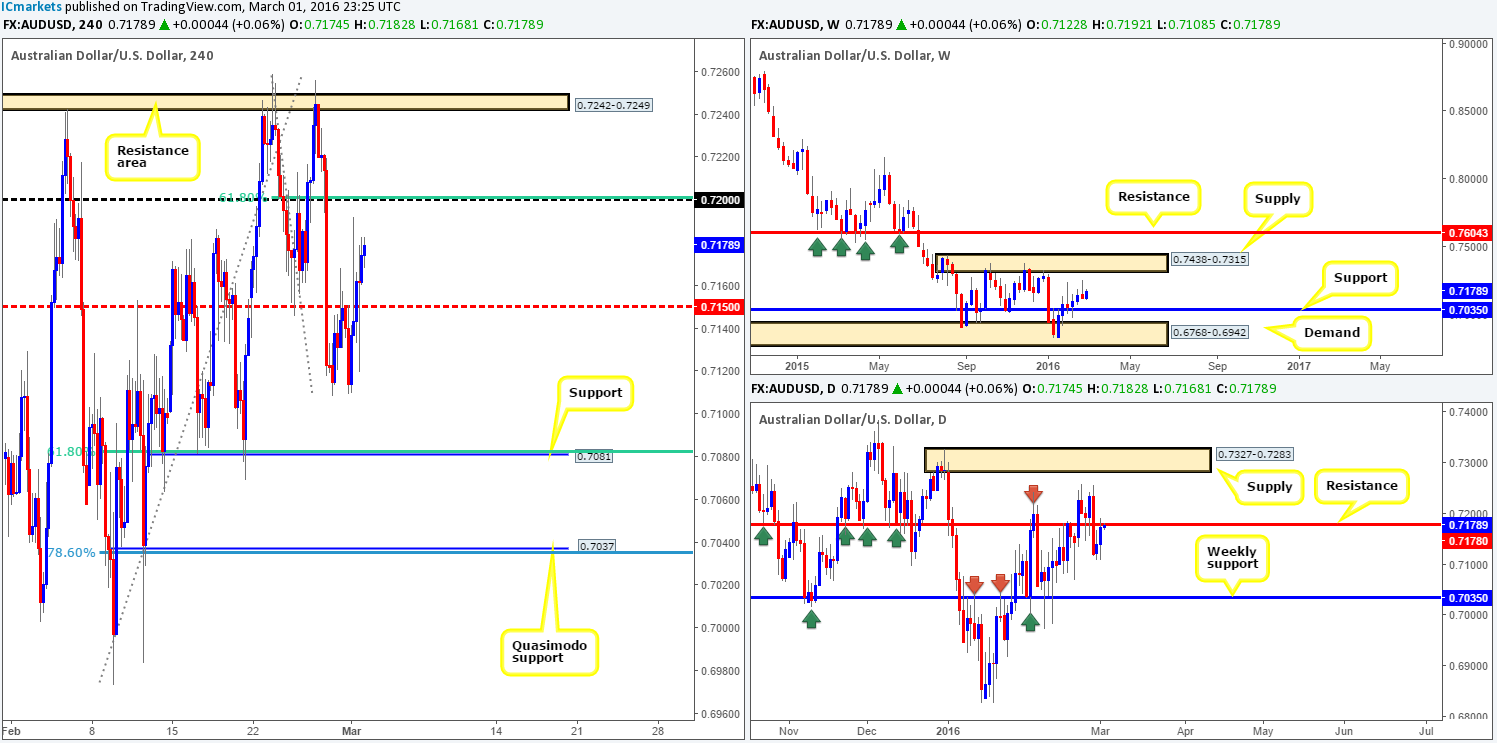
Beginning with the weekly chart this morning, last week’s bearish selling wick has yet to create much interest from the sell-side of this market. It’s still early days yet so we cannot dismiss the possibility that price may still drive lower to weekly support at 0.7035. In the event that the bulls continue on their northerly path, nevertheless, the next objective to reach (on this timeframe) comes in at 0.7438-0.7315 – a supply zone.
Casting our lines down into the daily chart, however, the market is currently seen retesting a resistance level at 0.7178 which could support a bearish move today/this week. A close above this number on the other hand could suggest strength as price could then effectively be headed towards supply penciled in at 0.7327-0.7283 (lodged just within the aforementioned weekly supply).
Given that the pair is trading at a daily resistance level right now (see above), and the fact that the 0.7200 figure (which is glued to a 61.8% Fibonacci level at 0.7201) is lurking just ahead on the H4 chart, this is a possible landmark for shorts today. Nevertheless, with little obvious weekly resistance in play at the moment and room being seen to move higher on this timeframe (discussed above in bold), we would only consider a sell from 0.7200 as long as it’s supported by a lower timeframe sell signal.
Levels to watch/live orders:
- Buys: Flat (Stop loss: N/A).
- Sells: 0.7200 [Tentative – confirmation required] (Stop loss: dependent on where one confirms this level).
USD/JPY:
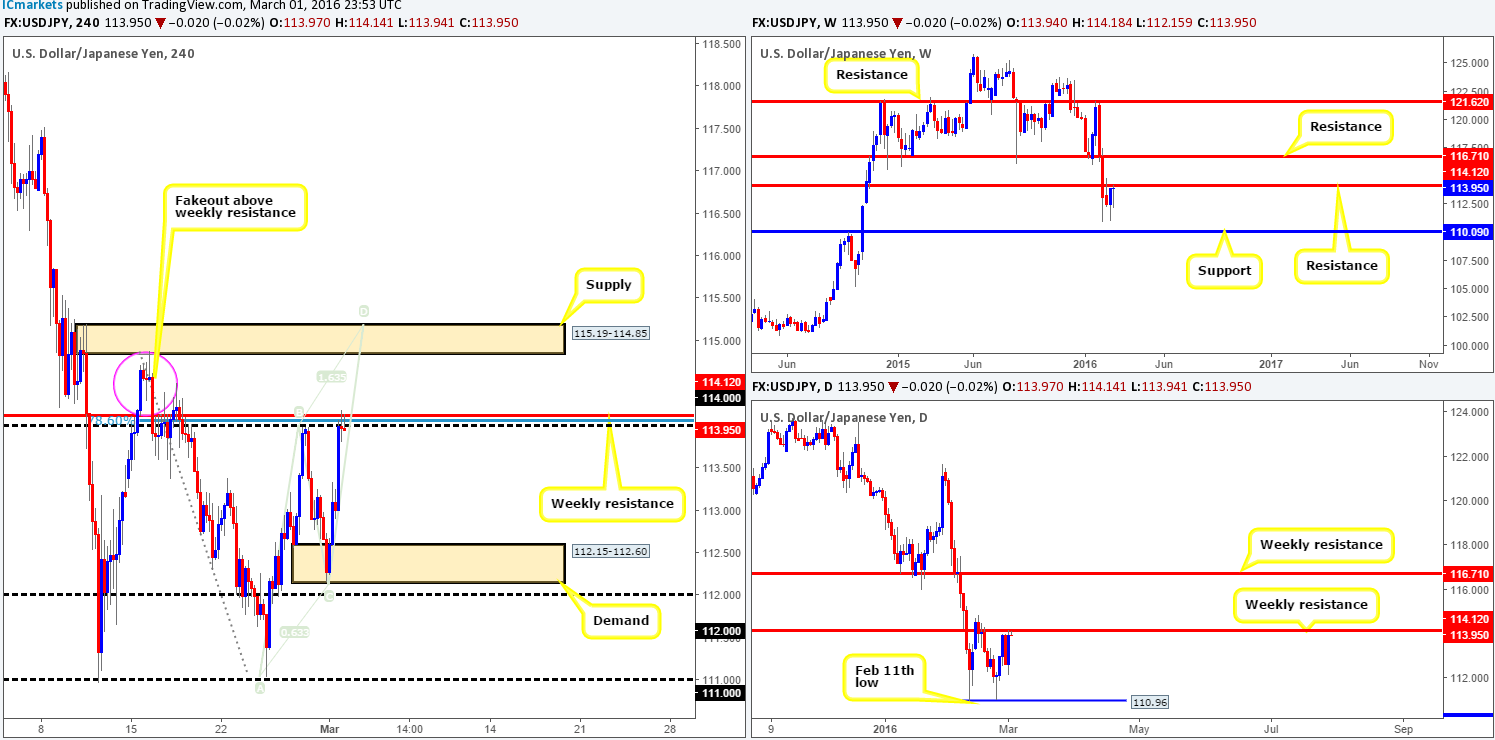
The USD/JPY pair saw a sharp increase in value yesterday on the back of positive U.S. data. This, as is shown on the H4 chart, dragged price back up to retest the 114.00 figure, which is where the market settled into the close 113.97. Due to this level also boasting a clear weekly resistance barrier at 114.12 and a deep 78.6% Fibonacci level at 114.05, this is, at least technically, a sturdy platform in which to be looking for shorts today. Despite this, the drive into this zone was extremely violent and could lead to a continuation move north up to H4 supply at 115.19-114.85 (converges beautifully with a H4 Harmonic AB=CD bearish pattern at 115.19).
With the above in mind, here is what we have jotted down so far:
- Watch the lower timeframe action around the 114.00 region today for a possible short trade, targeting H4 demand drawn from 112.15-112.60.
- If 114.00 fails to hold, we’ll then be eyeing the H4 supply at 115.19-114.85 for a confirmed shorting opportunity. This area held price beautifully back on the 16th Feb, following a fakeout above the aforementioned weekly resistance, so there is a good chance that this process may repeat itself.
Levels to watch/live orders:
- Buys: Flat (Stop loss: N/A).
- Sells: 114.00 region [Tentative – confirmation required] (Stop loss: dependent on where one confirms this area). 115.19-114.85 [Tentative – confirmation required] (Stop loss: dependent on where one confirms this area).
USD/CAD:
Following a better-than-expected Canadian GDP report yesterday, the USD/CAD broke below and slightly retested the 1.3500 figure before thrusting into H4 demand at 1.3358-1.3396 by the close 1.3405. For those who read our previous report (http://www.icmarkets.com/blog/tuesday-1st-march-daily-technical-outlook-and-review/) you may recall us speaking about this very demand being a fantastic area to go long from, due to it forming within daily demand at 1.3293-1.3396, and also surrounding weekly support at 1.3381.
In view of the above, our objective today is simple – keep an eye on the lower timeframe action (a break of supply and retrace/a break of a trendline and retrace etc…) around this zone for a possible entry long, targeting the 1.3500 figure as a first take-profit target. The reason for requiring confirmation here is due to the possibility that price may drive lower into the daily demand area thus potentially faking beyond the H4 demand.
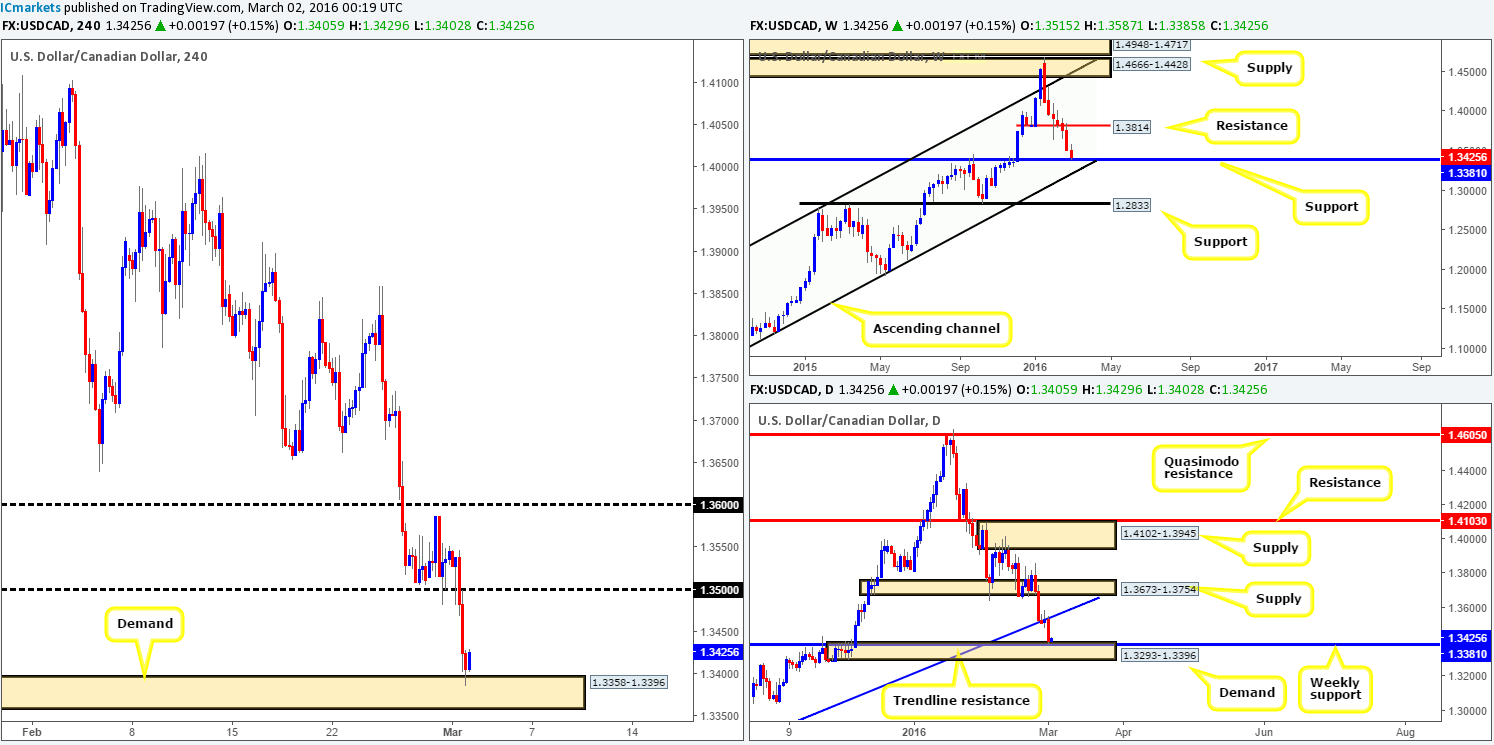
Levels to watch/live orders:
- Buys: 1.3358-1.3396 [Tentative – confirmation required] (Stop loss: dependent on where one confirms this area).
- Sells: Flat (Stop loss: N/A).
USD/CHF:
Similar to its inversely correlated cousin the EUR/USD, the USD/CHF saw very little action yesterday as price spent most of the day clinging to the underside of parity before selling-off during the American afternoon session. Initially our team was biased to the buy-side of this market, but due to daily action printing back-to-back selling wicks within supply at 0.9958-1.0036, this has changed our outlook somewhat.
As is evident from the H4 chart, price is presently capped between parity and a H4 support level drawn from 0.9949. Now, trading within this zone is a possibility today but not something that really interests us. What we are interested in, however, is the areas beyond this fifty-pip zone. A violation of 0.9949 could lead to a drop towards the 0.9900 figure, followed closely by daily support at 0.9855. This move, as we’re sure you can probably see, would be supported by the above said daily supply zone. To trade here, we’d need to see 0.9949 retested as resistance together with a lower timeframe sell signal. Conversely, if parity is taken out today, this would likely expose H4 supply at 1.0073-1.0051, followed by the 1.0100 figure and daily resistance at 1.0123. As such, a trade long may present itself today should price retest 1.0000 following a close higher along with a lower timeframe buy signal. By entering long here, you sould effectively be buying into daily supply, but considering that there’s room to move higher on the weekly chart up to a resistance area painted at 1.0239-1.0131, we believe it’s a safe trade.
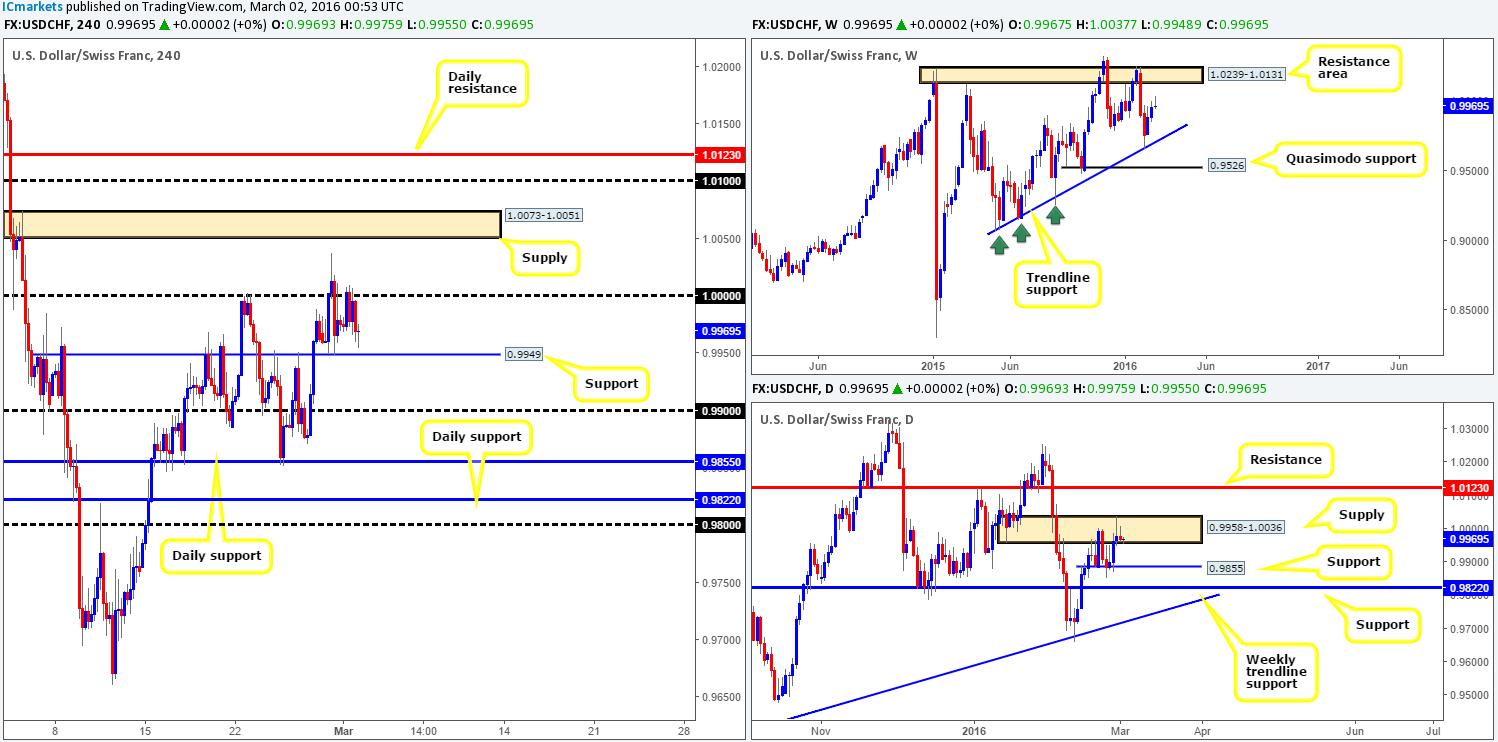
Levels to watch/live orders:
- Buys: Watch for offers to be consumed around 1.0000 and look to trade any retest seen thereafter (lower timeframe confirmation required).
- Sells: Watch for bids to be consumed around 0.9949 and look to trade any retest seen thereafter (lower timeframe confirmation required).
DOW 30:
U.S. stocks posted a healthy 350-point gain (open/close) during the course of yesterday’s sessions off the back of a H4 demand zone chalked up at 16427-16518. Previously (http://www.icmarkets.com/blog/tuesday-1st-march-daily-technical-outlook-and-review/), we mentioned that this demand area was likely going to hold due to room seen on the weekly chart for price to appreciate up to a minor resistance at 16935, and daily action trading deep within a support area at 16625-16435. Well done to any of our readers who managed to board this rocket before it took off – the risk/reward here was absolutely fantastic!
Pushing forward, we can see that the DOW is now trading within shouting distance of a H4 supply zone coming in at 17009-16905. This area encapsulates the aforementioned minor weekly resistance level so it is certainly a barrier to respect. Assuming there was not a larger weekly resistance level lurking just above at 17135, our team would look to enter short from the H4 area at market. That being said, it is always best to act in your own best interest in this game and that would mean only entering short here if lower timeframe action presented itself. If not, all eyes will then be on the H4 supply just above at 17244-17159 which sits just above the weekly resistance hurdle 17135.
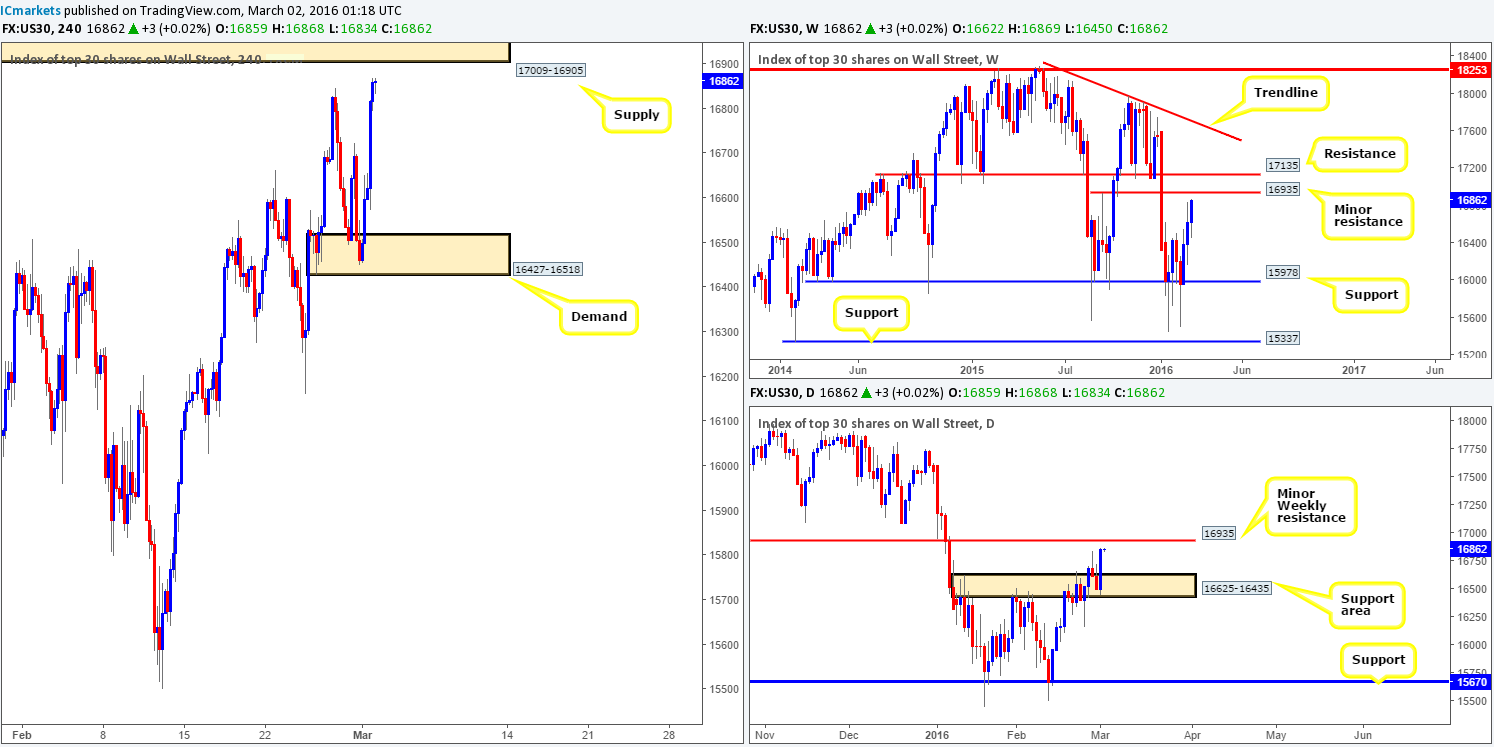
Levels to watch/live orders:
- Buys: Flat (Stop loss: N/A).
- Sells: 17009-16905 [Tentative – confirmation required] (Stop loss: dependent on where one confirms this area). Make sure to have the H4 supply at 17244-17159 noted in your watch lists.
XAU/USD: (Gold)
This morning’s analysis will kick-off with a look at the weekly chart which shows that price still remains relatively well-bid from demand chalked up at 1205.6-1181.2. Moving down to the daily chart, however, we can see that Gold continues to loiter mid-range between demand at 1181.4-1200.7 and supply overhead at 1273.9-1260.2. A break above this supply will land one within touching distance of the weekly supply area seen at 1307.4-1280.0, whilst a break below places weekly support 1157.4 back in view.
Stepping across to the H4 chart, the yellow metal took a hit to the mid-section yesterday following better-than-expected U.S. data. This, as you can see, forced prices to lows of 1227.1 by the day’s end down from a peak of 1248.4.
Based on recent movement, here is what we have jotted down so far:
For buys, we still have our eye on following H4 areas:
- The demand at 1200.6-1207.8, which sits on top of the daily demand mentioned above at 1181.4-1200.7 (which itself sits within weekly demand at 1205.6-1181.2).
- On the assumption that the above area caves in, the next buy zone can be seen at 1181.4-1187.4 – another demand which happens to be positioned within the extremes of the above said higher-timeframe areas.
For sells, we’re watching the H4 resistance at 1256.2 that lurks just below daily supply at 1273.9-1260.2. To enter short between these two barriers (pink circle), we would advise waiting for a lower timeframe sell signal to form prior to pulling the trigger. The reason being is simply because weekly action (as can be seen from the chart) shows room for the metal to continue rallying up to supply mentioned above at 1307.4-1280.0.
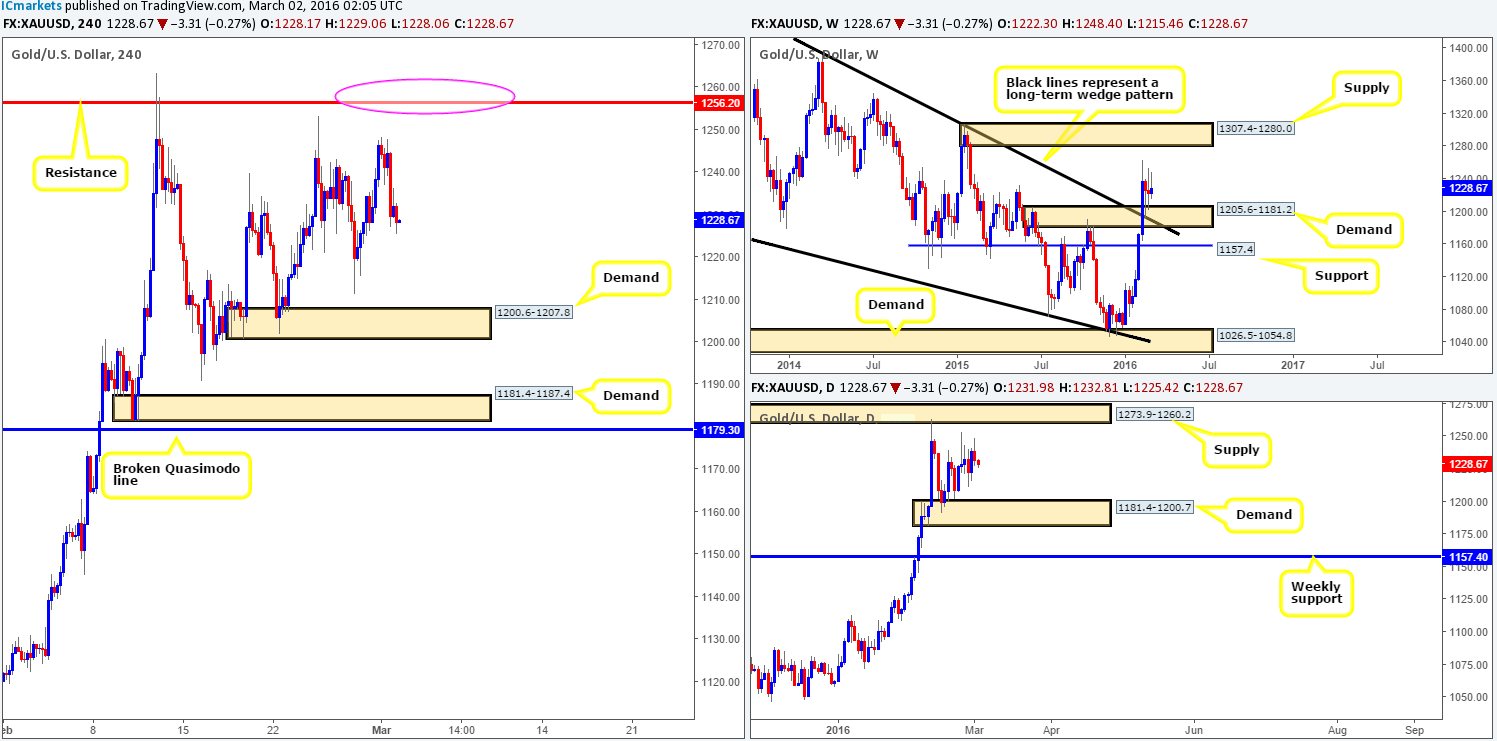
Levels to watch/live orders:
- Buys: 1200.6-1207.8 [Tentative – confirmation required] (Stop loss: dependent on where one confirms this area). 1181.4-1187.4 [Tentative – confirmation required] (Stop loss: dependent on where one confirms this area).
- Sells: 1260.2/1256.2 [Tentative – confirmation required] (Stop loss: dependent on where one confirms this area).