A note on lower timeframe confirming price action…
Waiting for lower timeframe confirmation is our main tool to confirm strength within higher timeframe zones, and has really been the key to our trading success. It takes a little time to understand the subtle nuances, however, as each trade is never the same, but once you master the rhythm so to speak, you will be saved from countless unnecessary losing trades. The following is a list of what we look for:
- A break/retest of supply or demand dependent on which way you’re trading.
- A trendline break/retest.
- Buying/selling tails – essentially we look for a cluster of very obvious spikes off of lower timeframe support and resistance levels within the higher timeframe zone.
- Candlestick patterns. We tend to only stick with pin bars and engulfing bars as these have proven to be the most effective.
For us, lower timeframe confirmation starts on the M15 and finishes up on the H1, since most of our higher timeframe areas begin with the H4. Stops usually placed 5-10 pips beyond your confirming structures.
EUR/USD:
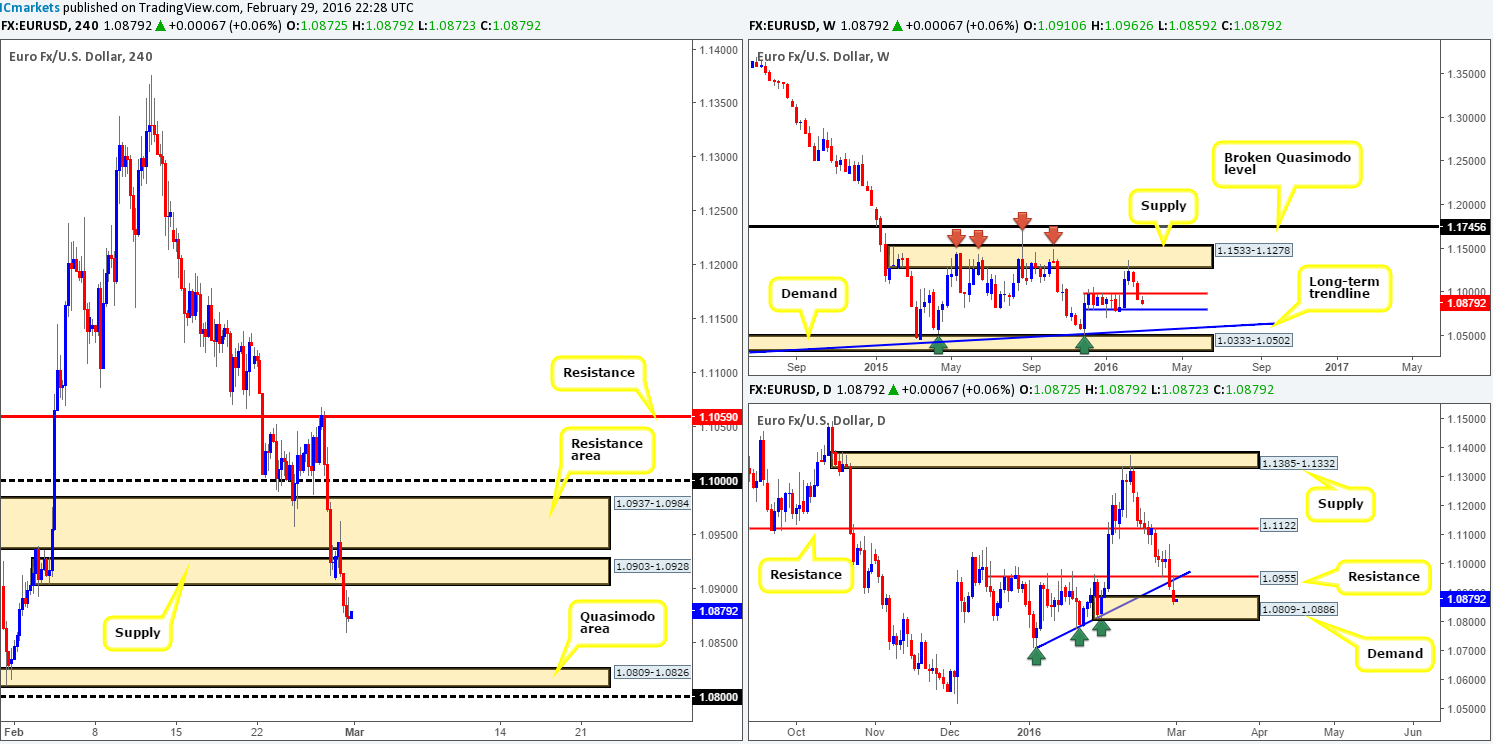
As we anticipated (http://www.icmarkets.com/blog/monday-29th-february-weekly-technical-outlook-and-review/) H4 demand (now supply) at 1.0903-1.0928 managed to hold some ground at the open, but ended with price collapsing to lows of 1.0859 on the day.
Aside from price taking out the current H4 demand and potentially opening the path south for further selling down to a H4 Quasimodo support area at 1.0809-1.0826, daily action was also seen plugging into demand penciled in at 1.0809-1.0886. Given this information, and the fact that we see possibility for further downside this week to weekly support at 1.0796, our plan of attack will be as follows:
- To trade short, in-line with both the weekly and H4 chart expectations, price would need to retest the underside of the current demand as supply followed by a lower timeframe sell signal. However, caution is still advised here since the above said daily demand could potentially halt selling before price reaches the aforementioned H4 Quasimodo area – the take-profit target.
- In regards to buying this pair, the only place, in our opinion, that would yield a large enough bounce to the upside would be the aforementioned H4 Quasimodo support area. Not only is it lodged deep within the extremes of daily demand, but it also sits just above both weekly support (see above for levels) and also psychological support 1.0800. Consequent to this, there is a possibility of a fakeout below the H4 area before buyers step in, as such; we would recommend waiting for the lower timeframes to confirm buying strength exists before risking capital here.
Levels to watch/live orders:
- Buys: 1.0809-1.0826 [Tentative – confirmation required] (Stop loss: dependent on where one confirms this area).
- Sells: 1.0903-1.0928 [Tentative – confirmation required] (Stop loss: dependent on where one confirms this area).
GBP/USD:
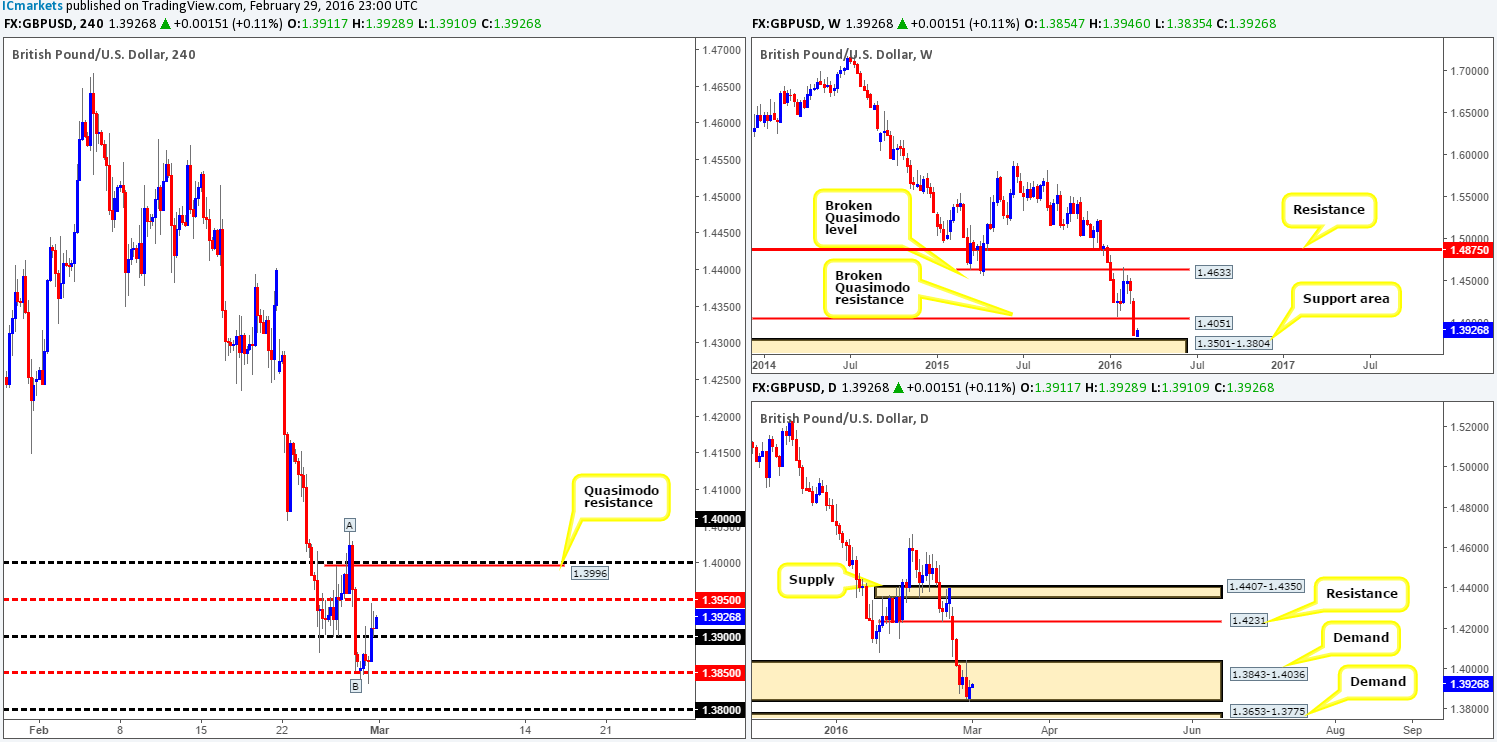
Following Sunday’s open 1.3854, Cable found support from the mid-level number 1.3850 and ended with price closing above the 1.3900 figure on the back of overall dollar weakness.
With price now trading just above a weekly support area at 1.3501-1.3804, and deep within a daily demand zone at 1.3843-1.4036, should we expect further upside on this pair? Well, seeing as how price has not actually come into contact the weekly buy zone yet, and there was a slight breach below daily demand (some stops likely taken here), we feel Monday’s buying could simply be short-covering from Friday’s sell-off.
With that being said, we still have our eye on the 1.3800 region for longs due to it converging with the top-side of the weekly support zone at 1.3804, and is also sitting just above a daily demand seen at 1.3653-1.3775. In addition to this, should our analysis be correct price could potentially form a nice-looking H4 AB=CD approach (points A/B marked on the chart) thus adding extra weight to a reversal from the 1.3800 region.
Even though our expectation is for a sell-off, shorting this pair is a little risky in our book due to where price is positioned on the higher-timeframe picture (see above). Trading into higher-timeframe zones will not likely do your account any favors in the long run, so patience is key here guys!
Levels to watch/live orders:
- Buys: 1.3800 [Tentative – confirmation required] (Stop loss: dependent on where one confirms this level).
- Sells: Flat (Stop loss: N/A).
AUD/USD:
Starting from the top this morning, weekly action ended with price painting a clear bearish selling wick which could indicate that we may be heading down to revisit support at 0.7035 sometime this week. From the pits of the daily chart, we can see that support at 0.7178 (now acting resistance) was aggressively taken out on Friday, leaving the path reasonably clear for price to challenge the weekly support hurdle we just discussed above.
Stepping across to the H4 chart, the commodity currency saw more subdued price action yesterday in comparison to Friday’s violent sell-off, as it touched gloves with the underside of the mid-level barrier 0.7150.
For those who read Monday’s report on the AUD (http://www.icmarkets.com/blog/monday-29th-february-weekly-technical-outlook-and-review/), we spoke about the possibility of entering short from 0.7150 and looking for longs around the H4 Quasimodo support 0.7037, which, in our opinion, are still valid levels going forward. We also mentioned that the reason for not looking to buy from 0.7081, even though it fuses with the 61.8% Fibonacci level at 0.7082, was simply due to the more attractive level below – 0.7037 which blends nicely with weekly support at 0.7035.
Right now, our team has seen very little lower-timeframe action suggesting that the bears are trying to come into the market from 0.7150, so we’re still on the sidelines for the time being.

Levels to watch/live orders:
- Buys: 0.7037 [Tentative – confirmation required] (Stop loss: dependent on where one confirms this level).
- Sells: 0.7150 [Tentative – confirmation required] (Stop loss: dependent on where one confirms this level).
USD/JPY:
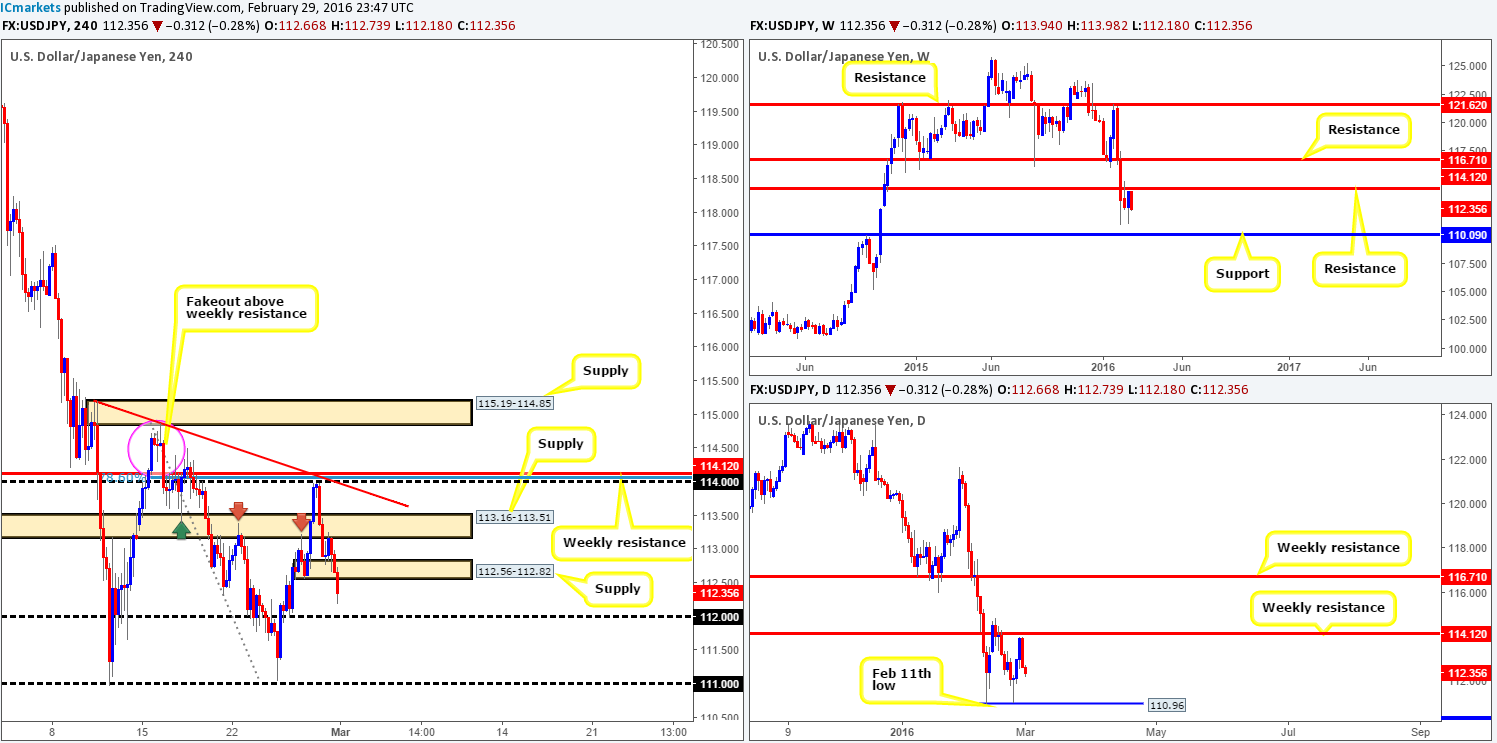
In our previous report (http://www.icmarkets.com/blog/monday-29th-february-weekly-technical-outlook-and-review/) we mentioned to keep an eye on lower timeframe price action around the 114.00 region for a sell-off. Reason being is this level boasted a 78.6% Fibonacci level at 114.05, a trendline taken from the high 115.19 and also weekly resistance drawn from 114.12. As can be seen from the chart, price failed to hit 114.00 before aggressively selling off which is a shame since we were set to enter here! We hope some of our readers still managed to pocket some green pips on this move however.
According to the weekly timeframe, as far as we see it, there is potential for further downside towards support painted at 110.09. Climbing down to the daily chart, nevertheless, the Feb 11th low support at 110.96 could potentially halt selling as it did last week, so you might want to note this number on your watch lists for this week guys.
By and large, we see no reason, at least technically, to be looking to buy this pair at this time. Yes, the 112.00 figure will likely come into play sometime today, but the most we expect from here is the underside of the recently broken H4 demand at 112.56-112.82. To that end, our expectation going forward is a close below 112.00. This, potentially, would not only clear the path south down to 111.00, but also open up the possibility for a short trade on any retest seen at 112.00.
Levels to watch/live orders:
- Buys: Flat (Stop loss: N/A).
- Sells: Watch for bids to be consumed around 112.00 and look to trade any retest seen thereafter (lower timeframe confirmation required).
USD/CAD:
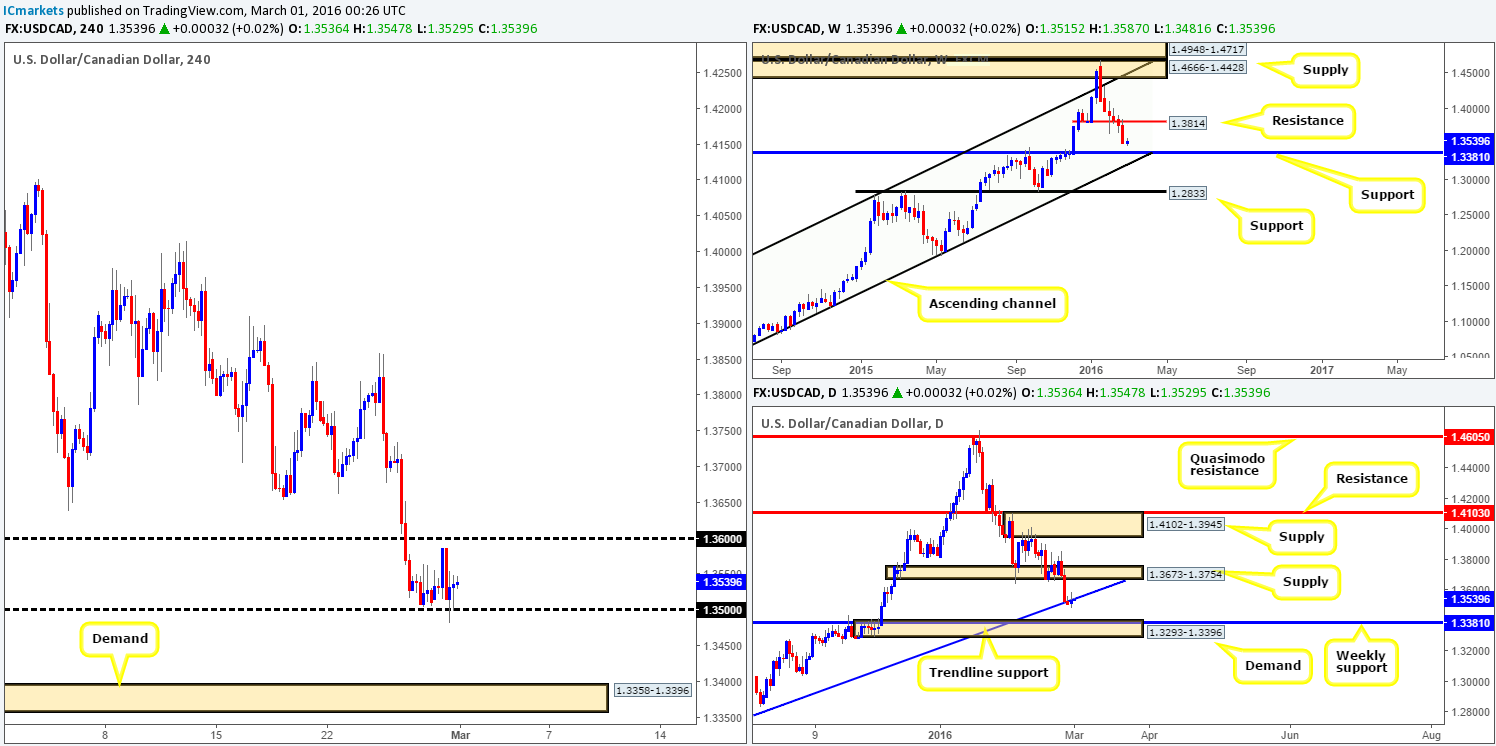
Kicking-off this morning’s analysis with a quick look at the weekly chart shows that due to last week’s rather aggressive sell-off, the Loonie has room to continue lower down to support at 1.3381. Breaking into the daily chart, however, both the buyers and sellers reveal uncertainty around the trendline support extended from the low 1.1919, hence the indecision candle printed yesterday. Nevertheless, should the bears stand their ground here the next downside target can be seen at demand coming in at 1.3293-1.3396 (surrounds weekly support at 1.3381).
On the basis of what we’re seeing on the higher-timeframe picture right now, we have no interest in buying from the 1.3500 figure today. Instead, our plan of attack today and most probably into the week is on trading below 1.3500. Ultimately, what we’d like to see is a close below this number and subsequent retest as resistance along with a lower timeframe sell signal. Based on this, we would feel comfortable shorting this market down to H4 demand at 1.3358-1.3396, which lies within the aforementioned daily demand, and also surrounds the above said weekly support. So, not only would this make for a good take-profit zone, it would also be a fantastic area to look to buy from (waiting for confirmation here is advised due to the possibility that price may drive lower into the daily demand area thus potentially faking beyond the H4 demand).
Levels to watch/live orders:
- Buys: 1.3358-1.3396 [Tentative – confirmation required] (Stop loss: dependent on where one confirms this area).
- Sells: Watch for bids to be consumed around 1.3500 and look to trade any retest seen thereafter (lower timeframe confirmation required).
USD/CHF:
The USD/CHF pair came alive going into yesterday’s London open. Price was aggressively pushed north, consequently whipsawing through parity (1.0000), which, as you can see, managed to retest H4 support at 0.9949 for the second time that day. This move likely took out a truckload of stops above the 1.0000 figure and also filled the majority of offers within daily supply at 0.9958-1.0036.
This – coupled with the weekly timeframe showing room for further upside to a weekly resistance zone at 1.0239-1.0131, leaves our team more biased to buy-side of this market for the time being. Therefore, today’s spotlight will firmly be focused on watching for price to close above 1.0000, which would likely expose H4 supply at 1.0073-1.0051, followed by the 1.0100 figure and daily resistance mentioned above at 1.0123. As such, a trade long may present itself today should price retest 1.0000 following a close higher along with a lower timeframe buy signal.
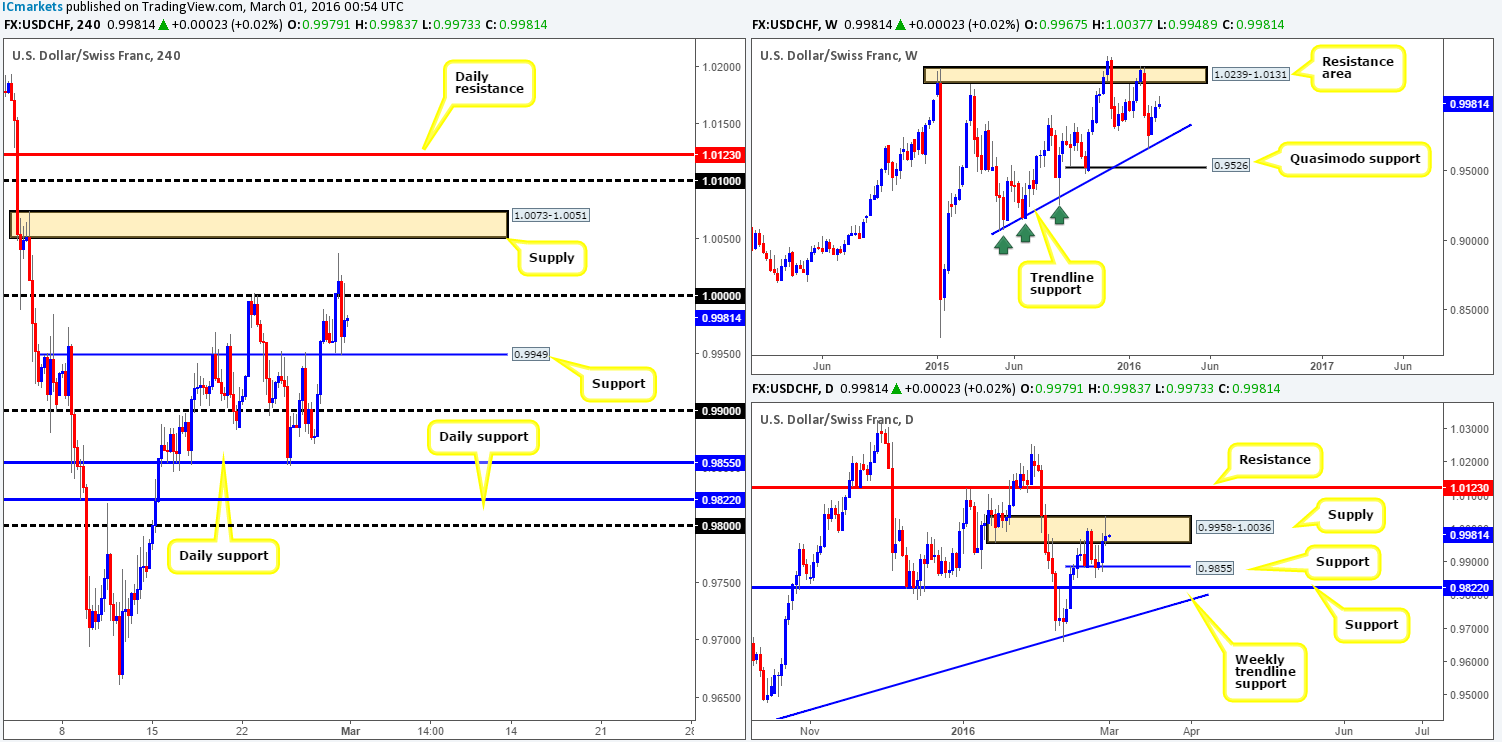
Levels to watch/live orders:
- Buys: Watch for offers to be consumed around 1.0000 and look to trade any retest seen thereafter (lower timeframe confirmation required).
- Sells: Flat (Stop loss: N/A).
DOW 30:
As can be seen from the H4 chart this morning, demand at 16427-16518 was clearly an area the market favored yesterday, as price bounced nicely up to highs of 16724. Although this area is seeing its second test as we write, there is a good chance this zone will hold again in our opinion. Our reasoning lies within the higher-timeframe structure. Check out how on the weekly chart, there is still room for this market to appreciate up to a minor resistance level drawn from 16935, whilst daily action is now seen trading deep within a daily support area at 16625-16435.
Due to the above points, there is potential for another bounce from the current H4 demand. However, this time would advise waiting for lower timeframe confirmation to prove buying interest resides here before taking the plunge since a chunk of bids has already been consumed.
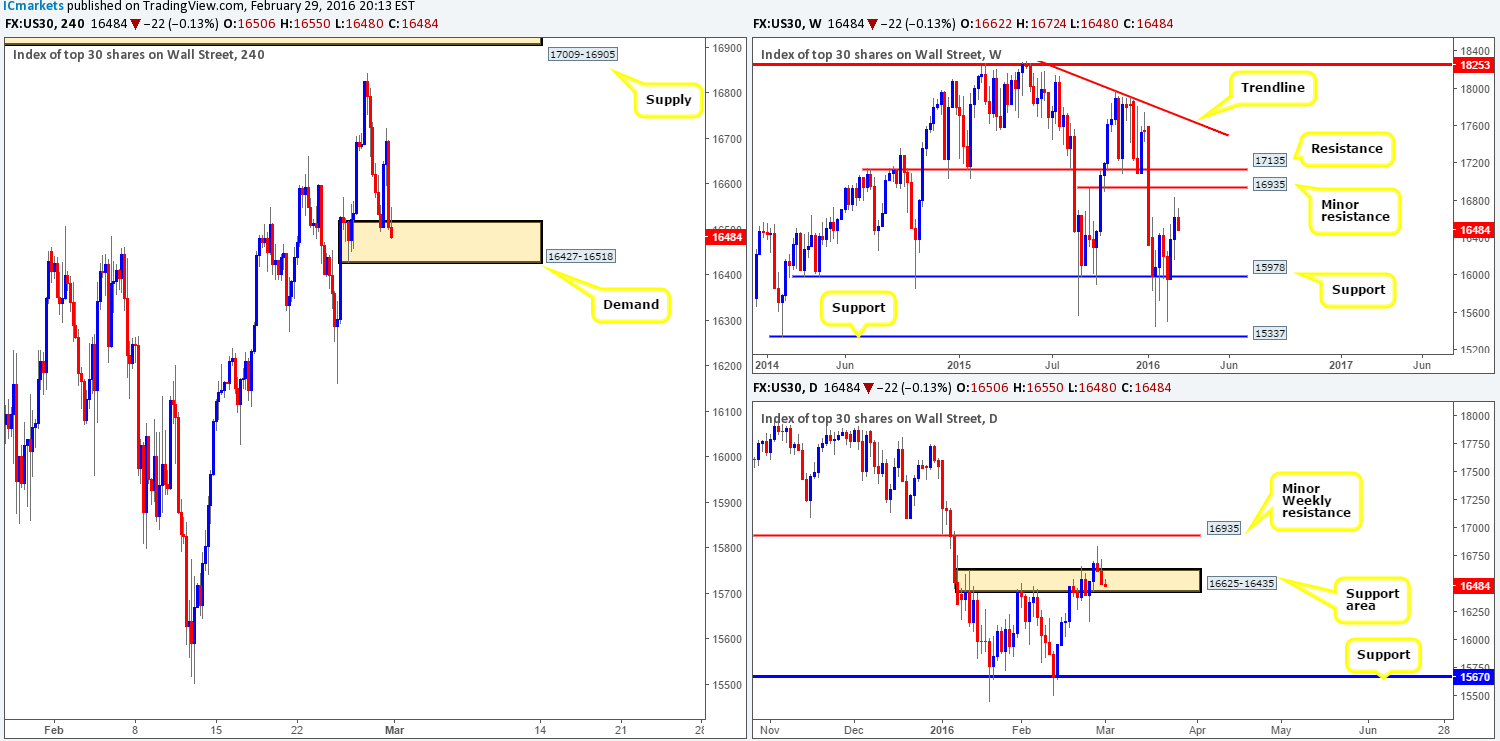
Levels to watch/live orders:
- Buys: 16427-16518 [Tentative – confirmation required] (Stop loss: dependent on where one confirms this area).
- Sells: Flat (Stop loss: N/A).
XAU/USD: (Gold)
Following the open 1222.3 the yellow metal went on the offensive yesterday, pushing prices to highs of 1241.0 by the day’s end. Now, initially our team was looking to enter long from H4 demand at 1200.6-1207.8, but given how close Gold is trading to the H4 resistance at 1256.2 which sits just below daily supply at 1273.9-1260.2, our attention has shifted to the sell-side of this market. To enter short between these two barriers (pink circle), we would advise waiting for a lower timeframe sell signal to form prior to pulling the trigger. The reason being is simply because weekly action shows room for the metal to continue rallying up to supply penciled in at 1307.4-1280.0.
Should one manage to short from our pre-determined sell zone today (the first take-profit target will be dependent on the H4 approach), expect the unexpected. What we mean by this is to be aggressive with your trade management and always act in your own best interest, since getting caught on the wrong side of weekly buyers (see above in bold) would not likely be favorable to your account!
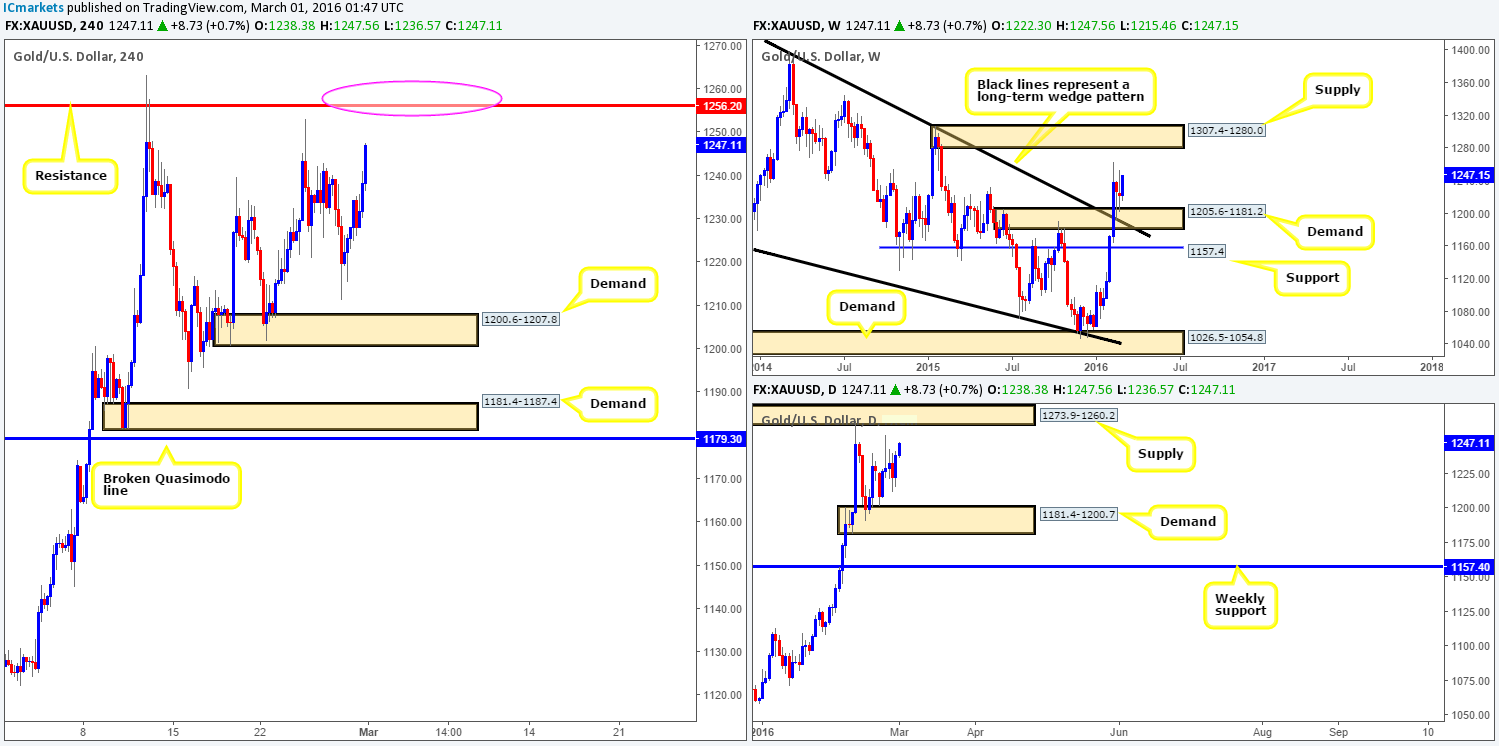
Levels to watch/live orders:
- Buys: Flat (Stop loss: N/A).
- Sells: 1260.2/1256.2 [Tentative – confirmation required] (Stop loss: dependent on where one confirms this area).


