
EUR/USD:
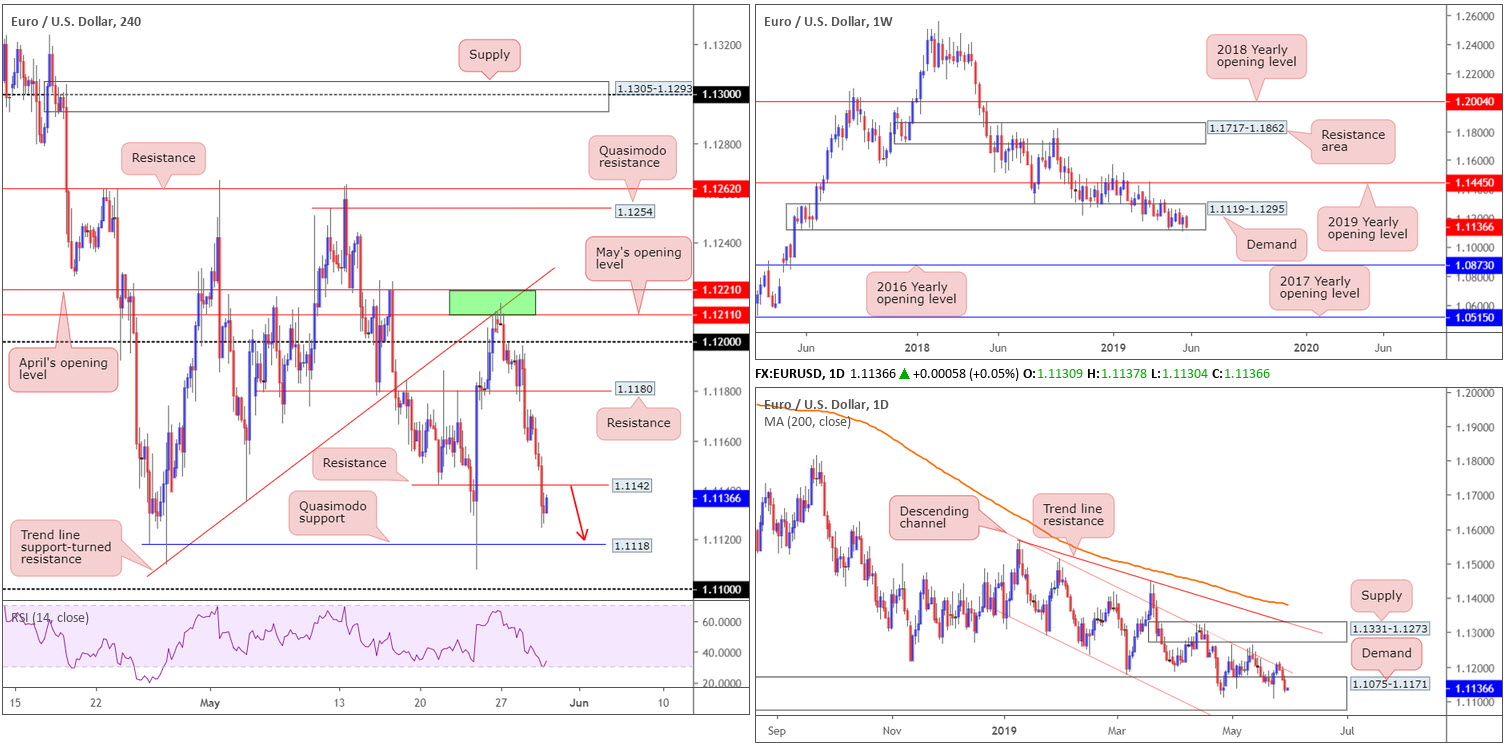
Recording its third consecutive daily loss, the EUR/USD is seen nursing losses just north of a H4 Quasimodo support at 1.1118 as we head into Asia Pac hours. Having seen this Quasimodo already hold price higher once already last week, the 1.11 handle may elbow its way into the spotlight should further selling materialise. Indicator-based traders may also want to note the RSI is currently printing a hidden bullish divergence around oversold territory.
The US dollar index overthrew its 98.00 handle yesterday and appears poised to tackle 2019 highs at 98.37. Dollar strength has placed a question mark on a long-standing weekly demand at 1.1119-1.1295 on the EUR/USD. A violation of this zone will likely register fresh 2019 lows and make a run for the 2016 yearly opening level at 1.0873. In similar fashion on the daily timeframe, we have demand coming in at 1.1075-1.1171 – glued to the underside of the current weekly demand – in motion. Although this area exhibits greater legroom before considered consumed, traders are urged to pencil in the support area at 1.0860-1.0954 (not seen on the screen) in the event we continue exploring lower ground.
Areas of consideration:
While weekly demand appears to be hanging on by a thread, along with the overall trend facing a southerly bearing, the current daily demand offers an additional buffer for the time being, therefore making it a difficult sell, long term.
Short-term movement (H4), on the other hand, offers a possible shorting opportunity from resistance at 1.1142 (a Quasimodo support-turned resistance formation), targeting Quasimodo support mentioned above at 1.1118, followed closely by the 1.11 handle. Conservative traders anxious about selling into higher-timeframe demand may consider opting to wait for a H4 bearish candlestick pattern to form before pulling the trigger. This helps identify seller intent and also provides entry and risk levels to work with.
Today’s data points: German, French and Swiss banks closed in observance of Ascension Day; US Prelim GDP q/q; FOMC Member Clarida Speaks.
GBP/USD:
Outlook unchanged.
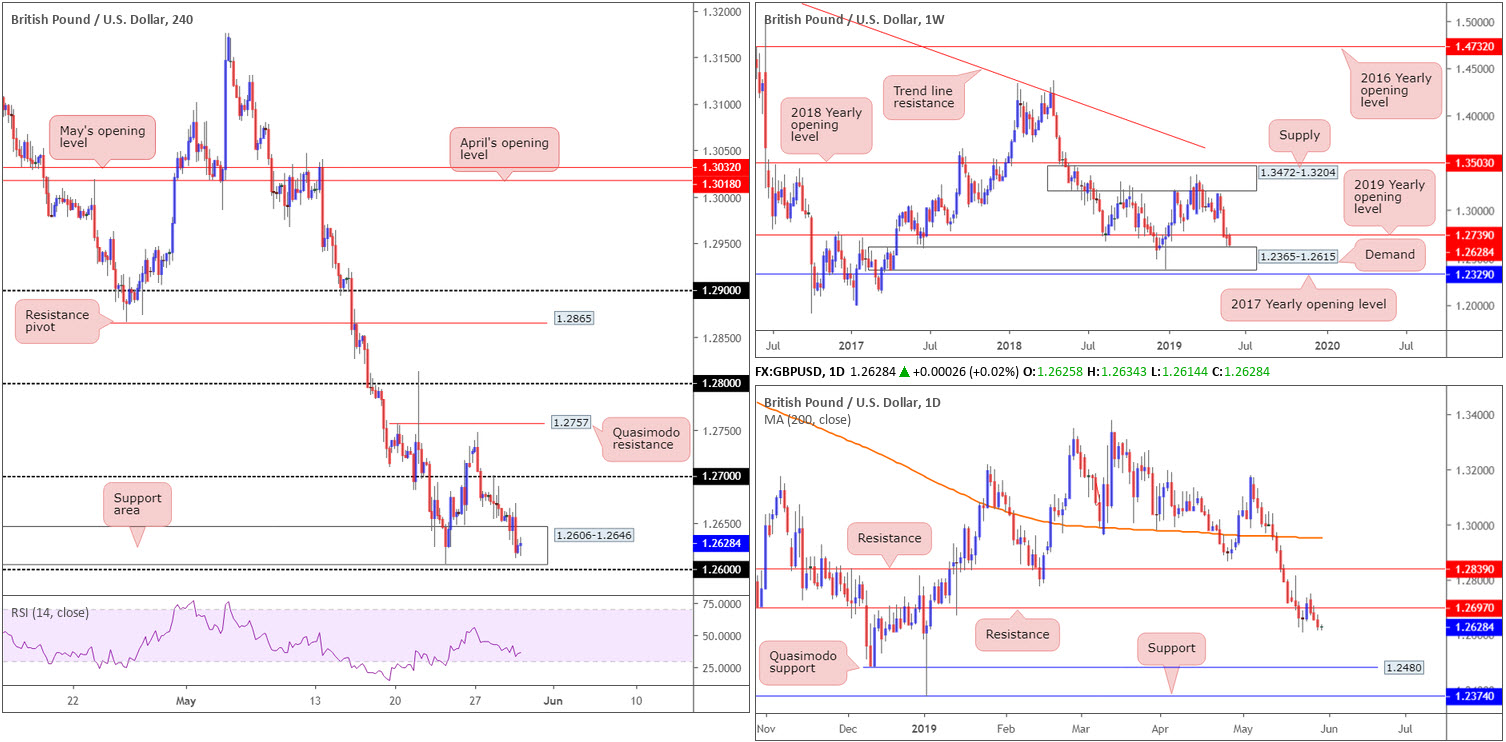
Following the euro lower on the back of dollar strength, the GBP/USD similarly chalked up a third consecutive daily loss Wednesday. As you can see, this forced H4 candles deeper into the jaws of a support area at 1.2606-1.2646, trailed closely by the 1.26 handle. Stop-loss orders beneath the current support area remain active, according to our technical studies, and therefore will likely act as a magnet to pull prices lower today.
On a wider setting, weekly price is shaking hands with the top edge of demand at 1.2365-1.2615. This area held price action higher on a number of occasions in the past; therefore history has a chance of repeating itself. Daily flow, however, continues to extend its position beneath resistance at 1.2697, with room to potentially make a run for Quasimodo support priced in at 1.2480.
Areas of consideration:
Although some traders are likely looking to buy within the H4 support area mentioned above at 1.2606-1.2646, given it has a connection with the top edge of weekly demand at 1.2365-1.2615, a fakeout through this area to the nearby 1.26 handle remains a possibility. This is likely due to diminished buying power from 1.2606-1.2646 from last week’s attempt at an advance (23rd) and the collection of stop-loss orders residing beneath it.
For that reason, conservative traders may wish to adopt a patient approach and wait and see if the candles are drawn to 1.26 before taking action. An ideal scenario would be for H4 price to print a hammer formation (or any notable bullish candlestick pattern) off 1.26, thus confirming buyer intent and simultaneously providing traders a structure to base entry and risk levels from.
Today’s data points: US Prelim GDP q/q; FOMC Member Clarida Speaks.
AUD/USD:
Outlook unchanged.
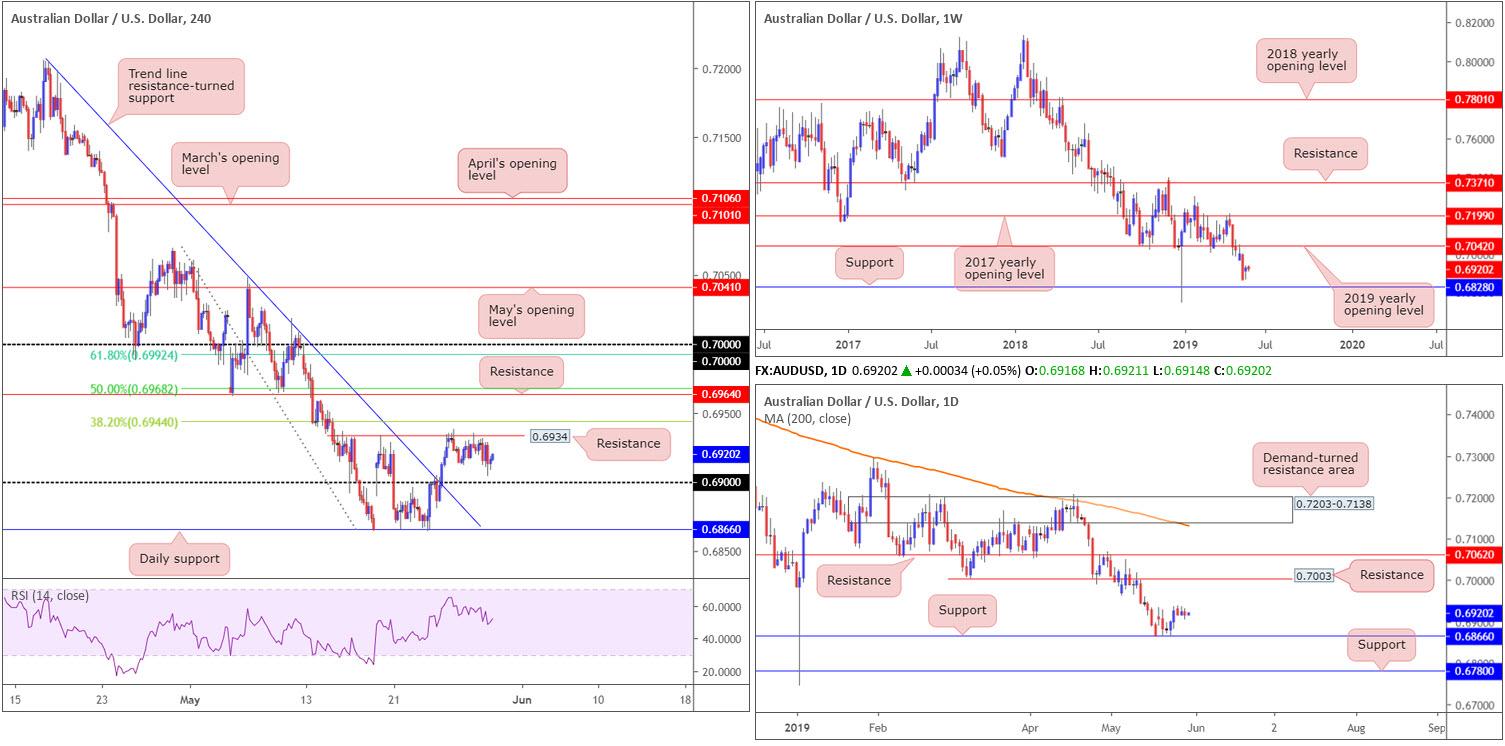
While the US dollar index continues to make headway above 98.00, the Australian dollar remains somewhat muted, down 0.10% Wednesday.
Technically, the H4 candles remain capped at resistance off 0.6934, with a nearby downside target on this scale set around the 0.69 handle. Above 0.6934, nevertheless, the H4 has a number of resistances worthy of note:
- The 38.2% Fibonacci resistance at 0.6944.
- The 50.0% resistance value at 0.6968, which happens to align with resistance at 0.6964.
- The 61.8% Fibonacci resistance value at 0.6992 – lines up nicely with the key figure 0.70. Note also we have daily resistance offering a potential ceiling close by at 0.7003.
Structure on the higher timeframes show weekly price has eyes on 0.6828 as possible support, and resistance by way of the 2019 yearly opening level at 0.7042. Focus on the daily timeframe has now shifted to support establishing from the 0.6866 neighbourhood, with little in the way of resistance seen until connecting with 0.7003 (highlighted above). Beyond the two said levels, we have another layer of support residing around 0.6780 and an additional film of resistance at 0.7062.
Areas of consideration:
On account of the overall technical picture, the key figure 0.70 on the H4 timeframe remains of interest as potential resistance. Due to its neighbouring confluence (see above), active sellers likely inhabit this region. However, waiting for additional confirmation (traders then have the option of using the selected confirmation technique to structure entry/risk levels) is recommended, since there’s a chance weekly action may still attempt an approach towards the 2019 yearly opening level set 40 points above 0.70 at 0.7042.
Shorter-term traders, nonetheless, may find use in the 0.69 handle as support, owing to the clear run north visible on the bigger picture. Traders interested in 0.69 are advised not to overlook the noted H4 resistances. In fact, the levels can be used to trail market action towards 0.70. Also, it is advisable to wait and see how H4 action behaves off 0.69 before entering long as round numbers are prone to fakeouts (a H4 or H1 bullish candlestick formation would likely suffice).
Today’s data points: Australian Building Approvals m/m; Private Capital Expenditure q/q; US Prelim GDP q/q; FOMC Member Clarida Speaks.
USD/JPY:
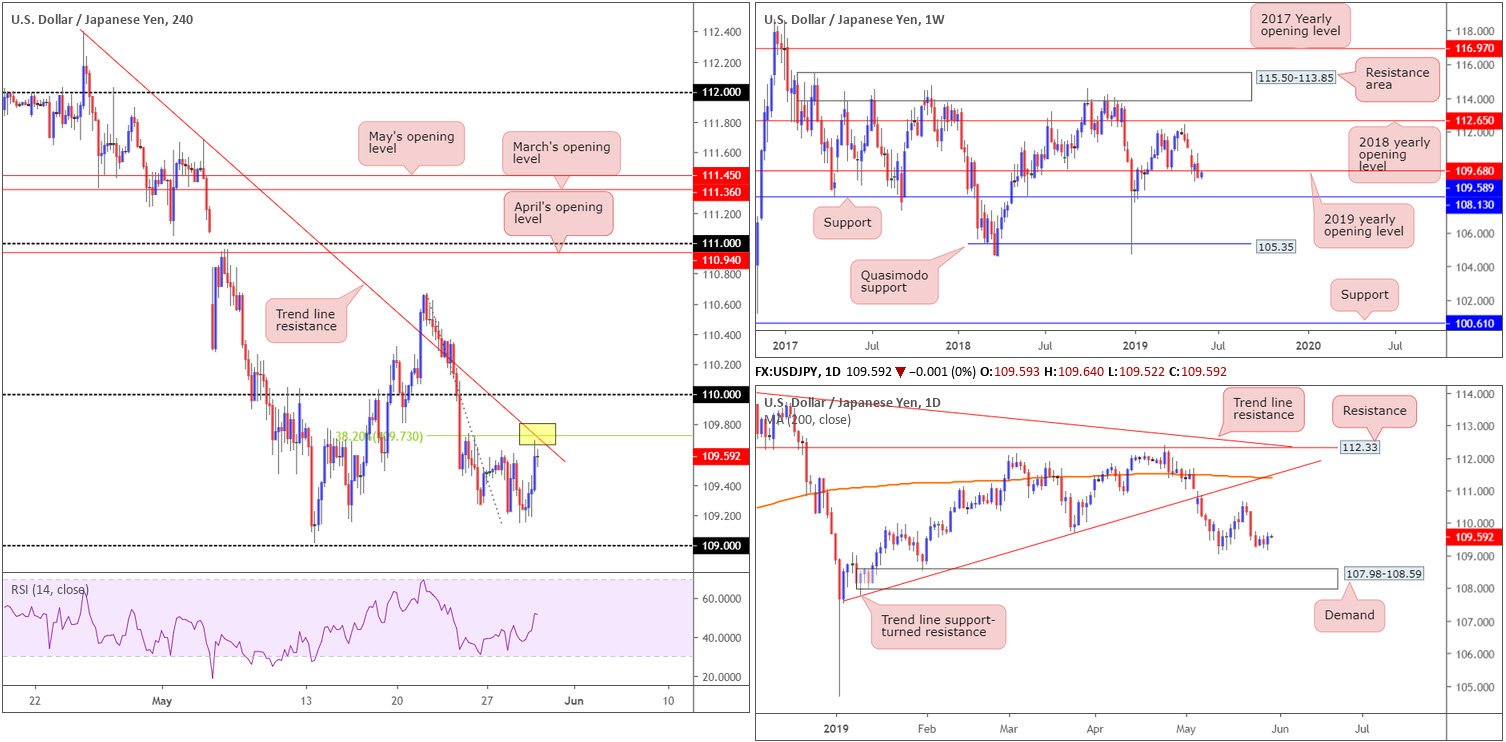
Having seen the US dollar index cross above the 98.00 mark Wednesday, this helped propel the USD/JPY higher, up 0.20% on the day.
From a technical standpoint, the pendulum appears to be swinging in favour of sellers right now. H4 action concluded yesterday closing within touching distance of a trend line resistance extended from the high 112.40 and a merging 38.2% Fibonacci resistance value at 109.73. What’s also interesting is the 2019 yearly opening level – plotted on the weekly timeframe – aligns closely with the H4 structure at 109.68.
In terms of daily flow, price action remains poised to approach the 109.01 May 13 low, shadowed by a particularly interesting area of demand at 107.98-108.59. To the upside, nevertheless, traders may be interested in the trend line support-turned resistance (taken from the low 107.77) and the closely merging 200-day SMA (orange). That is, of course, assuming the unit can overthrow last week’s high 110.67.
Areas of consideration:
109.73: the H4 38.2% Fibonacci resistance level is of interest today as a sell zone (yellow), having seen it unite closely with a H4 trend line resistance and the 2019 yearly opening level on the weekly timeframe. Aggressive traders may opt to simply enter at market at 109.73 with protective stop-loss orders plotted 10-15 points above the said trend line resistance. Conservative traders, nonetheless, might wait and see how H4 action responds and enter on the back of additional confirmation. This could be anything from a notable rejection: a full or near-full-bodied bearish candle, an MA crossover or even drilling down to the lower timeframes and entering based on local structure.
Today’s data points: US Prelim GDP q/q; FOMC Member Clarida Speaks.
USD/CAD:
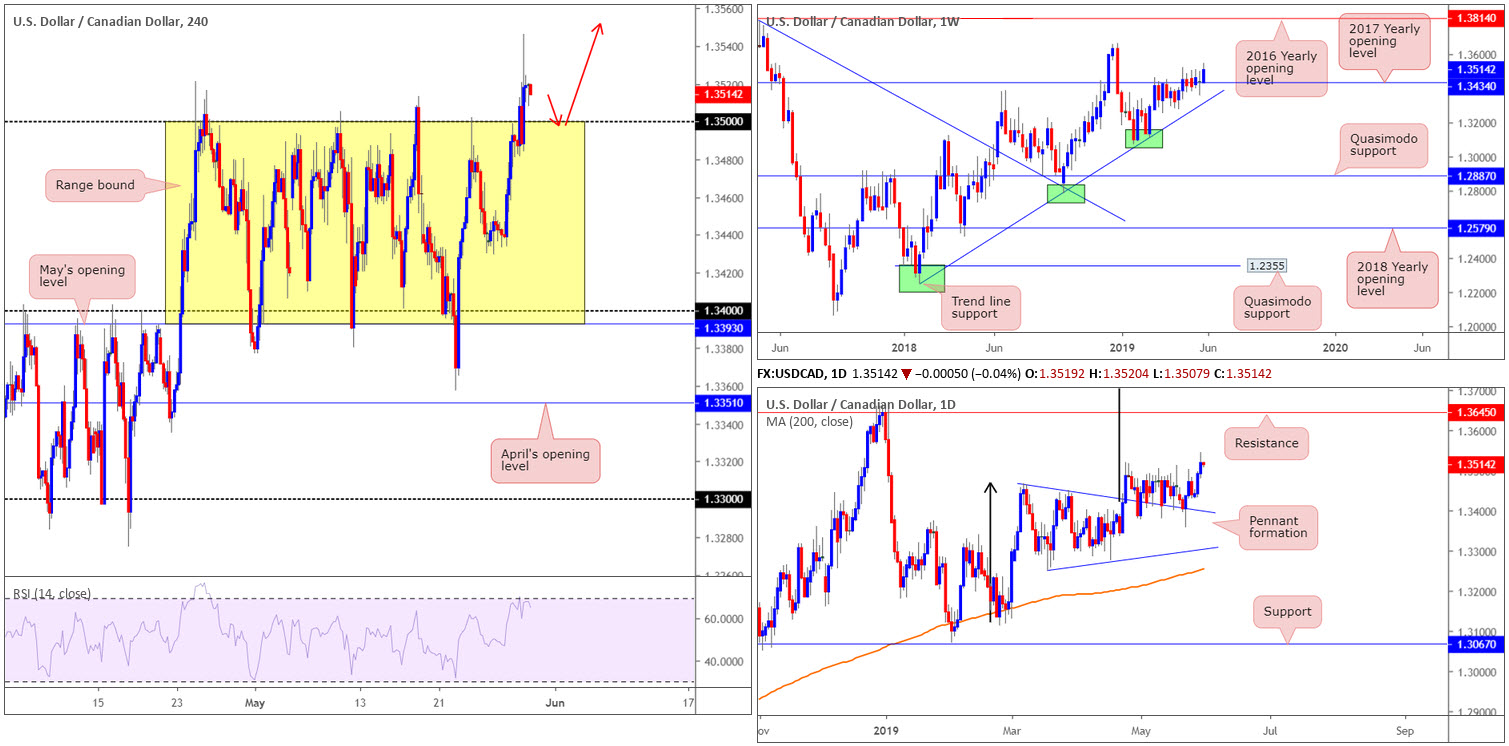
The USD/CAD preserved a strong bid Wednesday, surging through 1.35 to fresh multi-month tops at 1.3546. The Canadian Dollar remained on the defensive after the Bank of Canada (BoC) decided to leave benchmark interest rates unchanged at 1.75%.
Since the latter part of April, the H4 candles have been busy carving out a 100-point+ range between May’s opening level at 1.3393/1.34 and the round number 1.35. With price action firmly breaking the top edge of this region yesterday, further buying is likely in store to at least resistance at 1.3570 (not seen on the screen).
Higher-timeframe flow has weekly price surging from the 2017 yearly opening level at 1.3434, targeting a possible run towards the 2018 yearly high of 1.3664. Daily action, after feeding off support drawn from the top edge of a pennant pattern (1.3467) for the past month, looks to also be heading higher. Although the traditional price target (calculated by taking the distance from the beginning of the preceding move and adding it to the breakout price) remains on the chart at 1.3768 (black arrows), the next upside target from a structural standpoint falls in around resistance at 1.3645.
Areas of consideration:
According to our technical reading, traders have the choice of either buying the breakout candle (at current price) and placing stop-loss orders beneath its tail (1.3484), or waiting and seeing if a retest scenario takes shape and entering on the back of the rejection candle’s structure. The next upside target on the H4 scale can be seen around 1.3570 (not seen on the screen), though according to the higher timeframes we could be heading much higher.
Today’s data points: US Prelim GDP q/q; FOMC Member Clarida Speaks; Canadian Current Account; Gov. Council Member Wilkins Speaks.
USD/CHF:
Outlook unchanged.
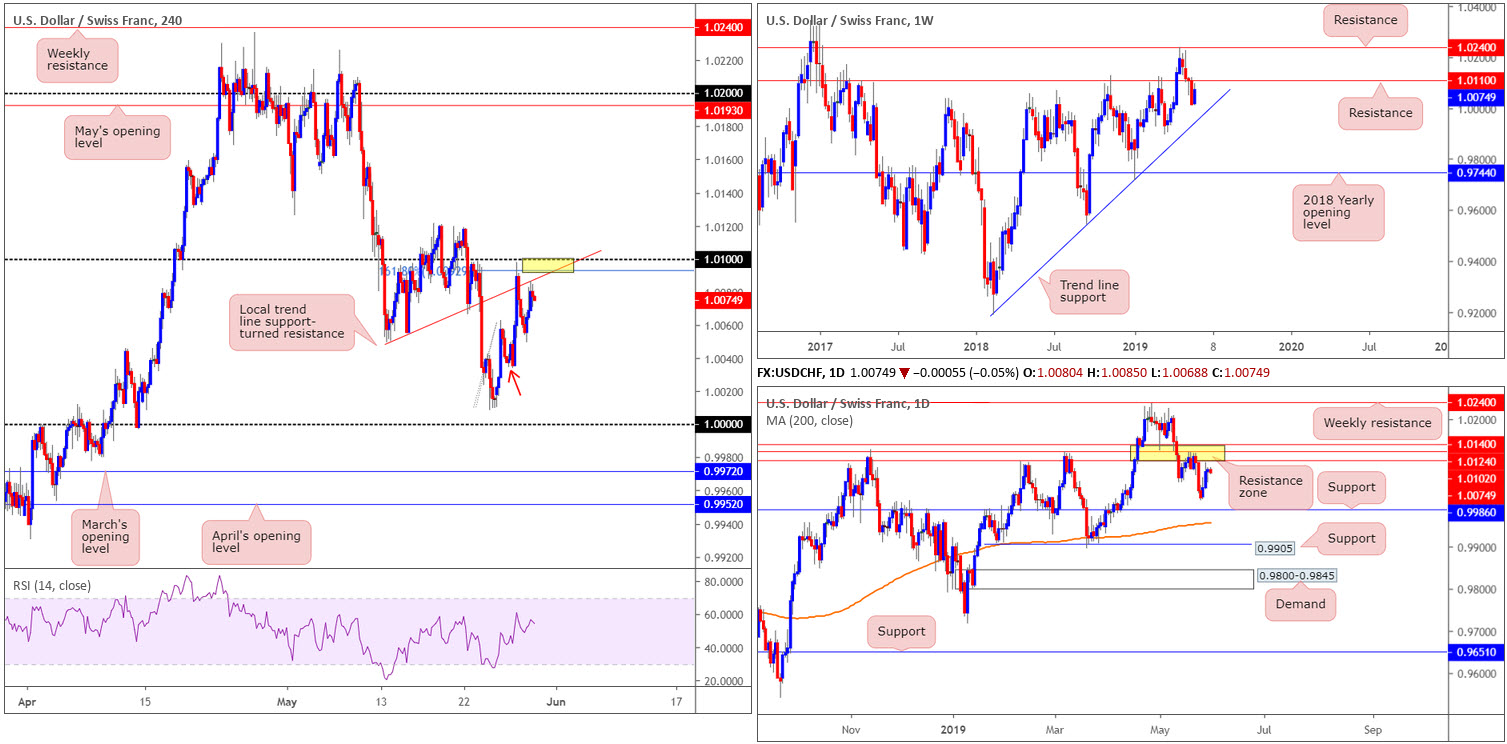
USD/CHF prices settled Wednesday just south of the 1.01 handle on the H4 timeframe, on the back of broad-based USD bidding. What’s notable from a technical standpoint at 1.01 is a merging local trend line support-turned resistance (extended from the low 1.0050), and a 161.8% Fibonacci ext. point at 1.0092. In addition to H4 confluence, higher-timeframe action displays a robust resistance zone between 1.0102/1.0140. Note this area held price action lower last week and came within touching distance of support at 0.9986. Within this zone we also see weekly resistance pencilled in at 1.0110, with the next downside target on this scale seen around trend line support (etched from the low 0.9187).
Further selling from the H4 position has minor demand located around 1.0045ish (red arrow) to target, followed closely by the key figure 1.0000.
Areas of consideration:
On the whole, technical direction favours sellers at the moment.
Should you be looking to sell this market, an ideal scenario would be for H4 price to retest the 1.01/1.0092 region yellow), which as we already know boasts additional resistance from a local trend line resistance. What’s more, let’s not forget this small H4 zone has a close connection with the lower edge of the daily resistance zone at 1.0140/1.0102, which incorporates a weekly resistance at 1.0110.
1.0000 is also likely an area on many traders’ watchlist. The number boasts additional backing from daily support at 0.9986.
Regardless of the buy/sell zone selected, traders are urged to consider waiting for additional candlestick confirmation to take shape before taking action. Not only will this help limit unnecessary losses, it’ll help identify buyer/seller intent and provide traders a structure to work with for entry and risk levels.
Today’s data points: US Prelim GDP q/q; FOMC Member Clarida Speaks.
Dow Jones Industrial Average:
US equities ceded further ground Wednesday, with bond prices continuing to rise as investors show concern about slower economic growth. Technology and communications companies took some of the heaviest losses, as did health care stocks.
The Dow Jones Industrial Average fell 0.87%; the S&P 500 lost 0.69% and the tech-heavy Nasdaq ended down 0.85%.
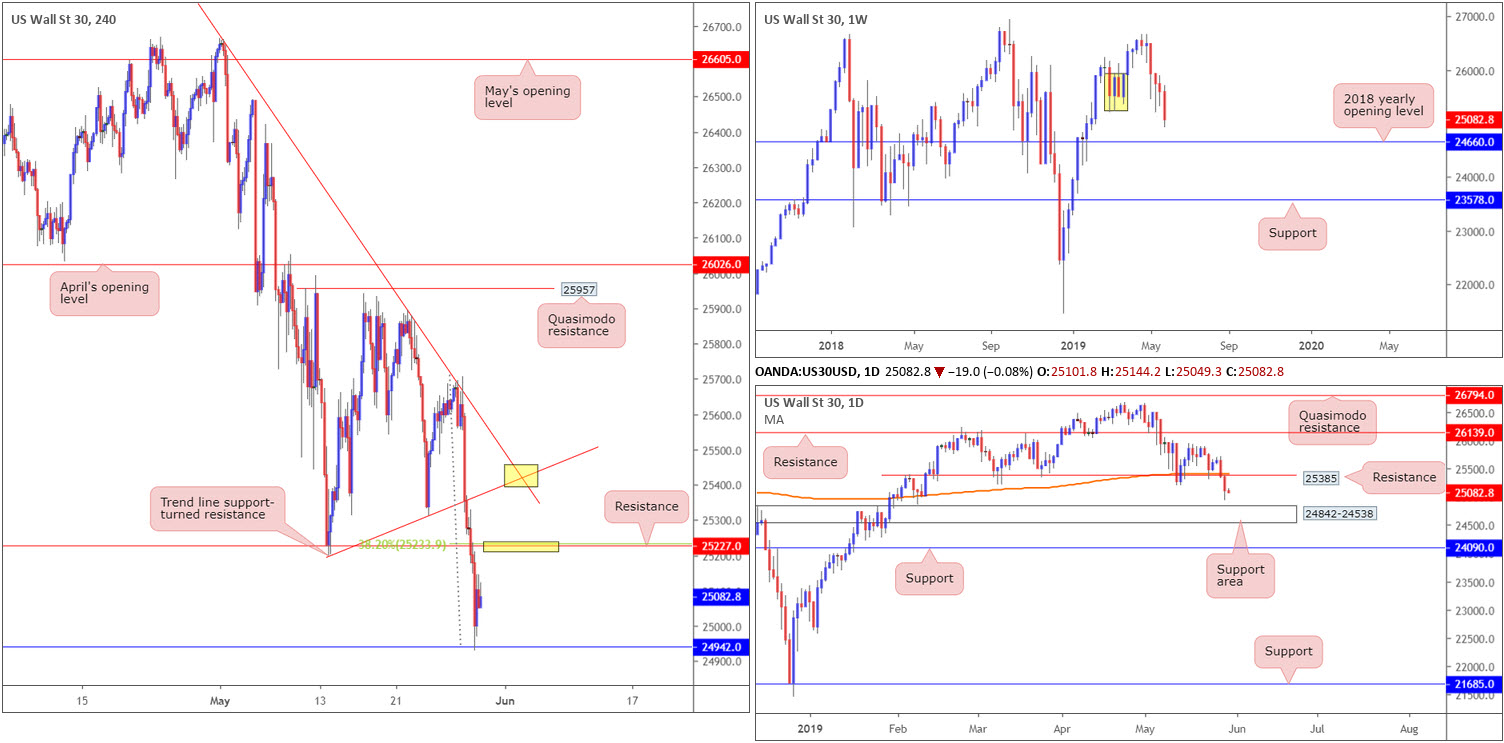
Technically, the DJIA crossed beneath H4 support at 25227 (now acting resistance) and crossed swords with another layer of support coming in at 24942. Note also we have the RSI testing oversold waters.
From a weekly perspective, demand marked in yellow at 25217-25927 has been engulfed thanks to yesterday’s selling, potentially setting the stage for further downside towards the 2018 yearly opening level at 24660. In conjunction with weekly activity, daily movement recently breached notable support at 25385 (now acting resistance), which happens to intersect with the 200-day SMA. Additional downside from this point has the support area at 24842-24538 in sight.
Areas of consideration:
According to our higher-timeframe technical reading, the pendulum appears to be swinging in favour of the sellers at present. For that reason, focus on the H4 timeframe resides around resistance at 25227 for possible shorting opportunities, which happens to merge closely with a 38.2% Fibonacci value at 25233. In addition to this, traders may also find the H4 converging trend line resistances (upper yellow box – 26659/25198) of use for shorts in the event we overthrow 25227.
Ultimately, the first downside target from either resistance highlighted above is H4 support at 24942, followed by the daily support area at 24842-24538.
Today’s data points: US Prelim GDP q/q; FOMC Member Clarida Speaks.
XAU/USD (GOLD):
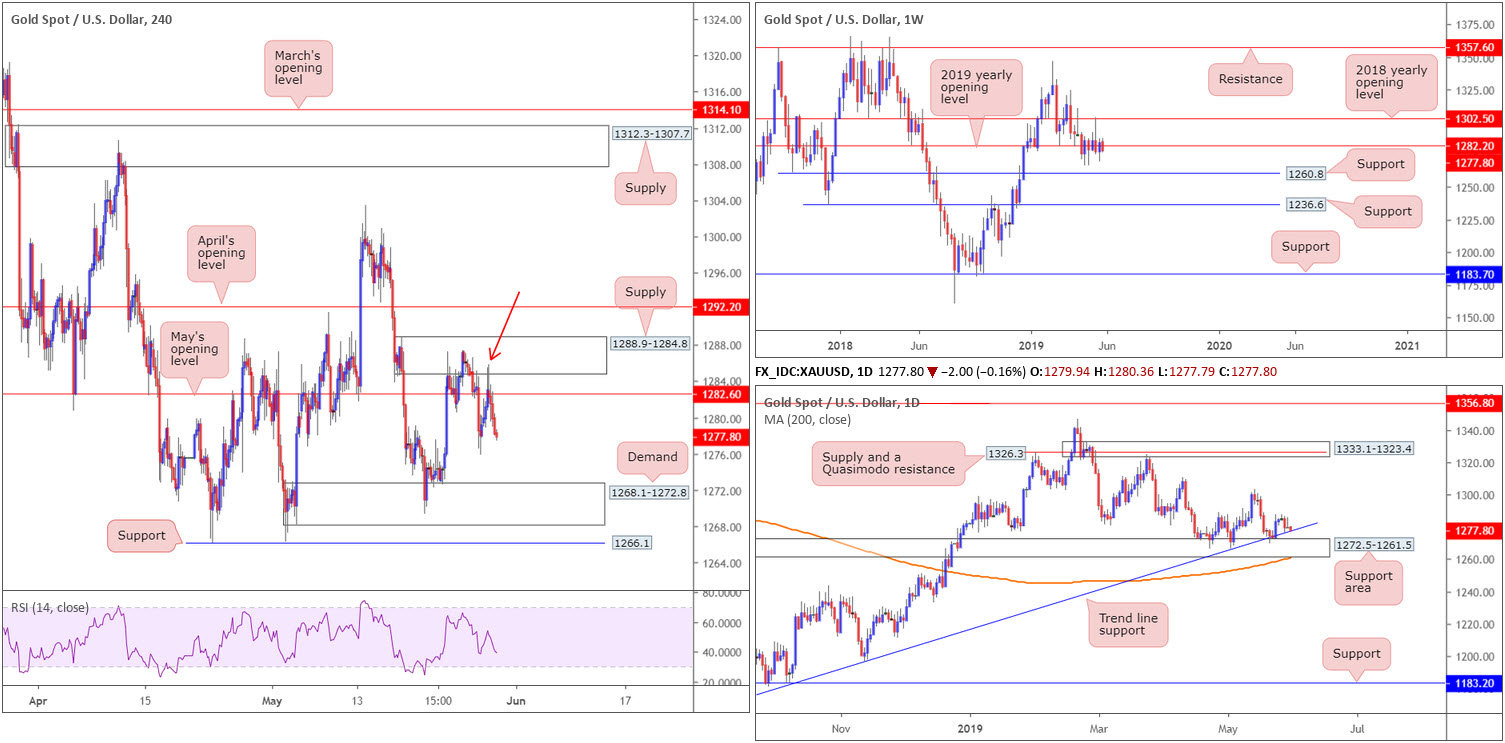
In spite of ranging more than $6 Wednesday, the price of gold, in $ terms, concluded unchanged. For those who read yesterday’s report you may recall the piece highlighted a possible selling opportunity developing from the underside of May’s opening level at 1282.6.
However, the briefing also stated the following:
Traders may, however, wish to wait for additional confirmation before pressing the sell button, due to the threat of further buying on the daily timeframe from trend line support (extended from the low 1160.3), and also a potential fakeout materialising through 1282.6 to the H4 supply at 1288.9-1284.8.
As you can see, price action whipsawed through 1282.6 to the noted H4 supply zone and produced a somewhat half-hearted shooting star pattern (red arrow). Well done to any of our readers who caught this move.
As already underlined above, daily movement is seen testing a trend line support at the moment, which is closely shadowed by a support area coming in at 1272.5-1261.5. Weekly price, on the other hand, has seen the unit fluctuate around its 2019 yearly opening level at 1282.2 for the past six weeks. A push higher from here has the 2018 yearly opening level at 1302.5 to target, whereas a push lower has support at 1260.8 in sight.
Areas of consideration:
Traders who are currently short this market may, given daily price testing trend line support, want to consider reducing risk to breakeven. Although the expectation is for a push towards H4 demand at 1268.1-1272.8 (resides around the top edge of the aforementioned daily support area), it is always best to be safe than sorry.
The accuracy, completeness and timeliness of the information contained on this site cannot be guaranteed. IC Markets does not warranty, guarantee or make any representations, or assume any liability with regard to financial results based on the use of the information in the site.
News, views, opinions, recommendations and other information obtained from sources outside of www.icmarkets.com.au, used in this site are believed to be reliable, but we cannot guarantee their accuracy or completeness. All such information is subject to change at any time without notice. IC Markets assumes no responsibility for the content of any linked site. The fact that such links may exist does not indicate approval or endorsement of any material contained on any linked site.
IC Markets is not liable for any harm caused by the transmission, through accessing the services or information on this site, of a computer virus, or other computer code or programming device that might be used to access, delete, damage, disable, disrupt or otherwise impede in any manner, the operation of the site or of any user’s software, hardware, data or property.


