
Key risk events today:
Swiss KOF Economic Barometer; German Prelim GDP q/q; US Advance GDP q/q and Advance GDP Price Index q/q; US Unemployment Claims.
(Previous analysis as well as outside sources – italics).
EUR/USD:
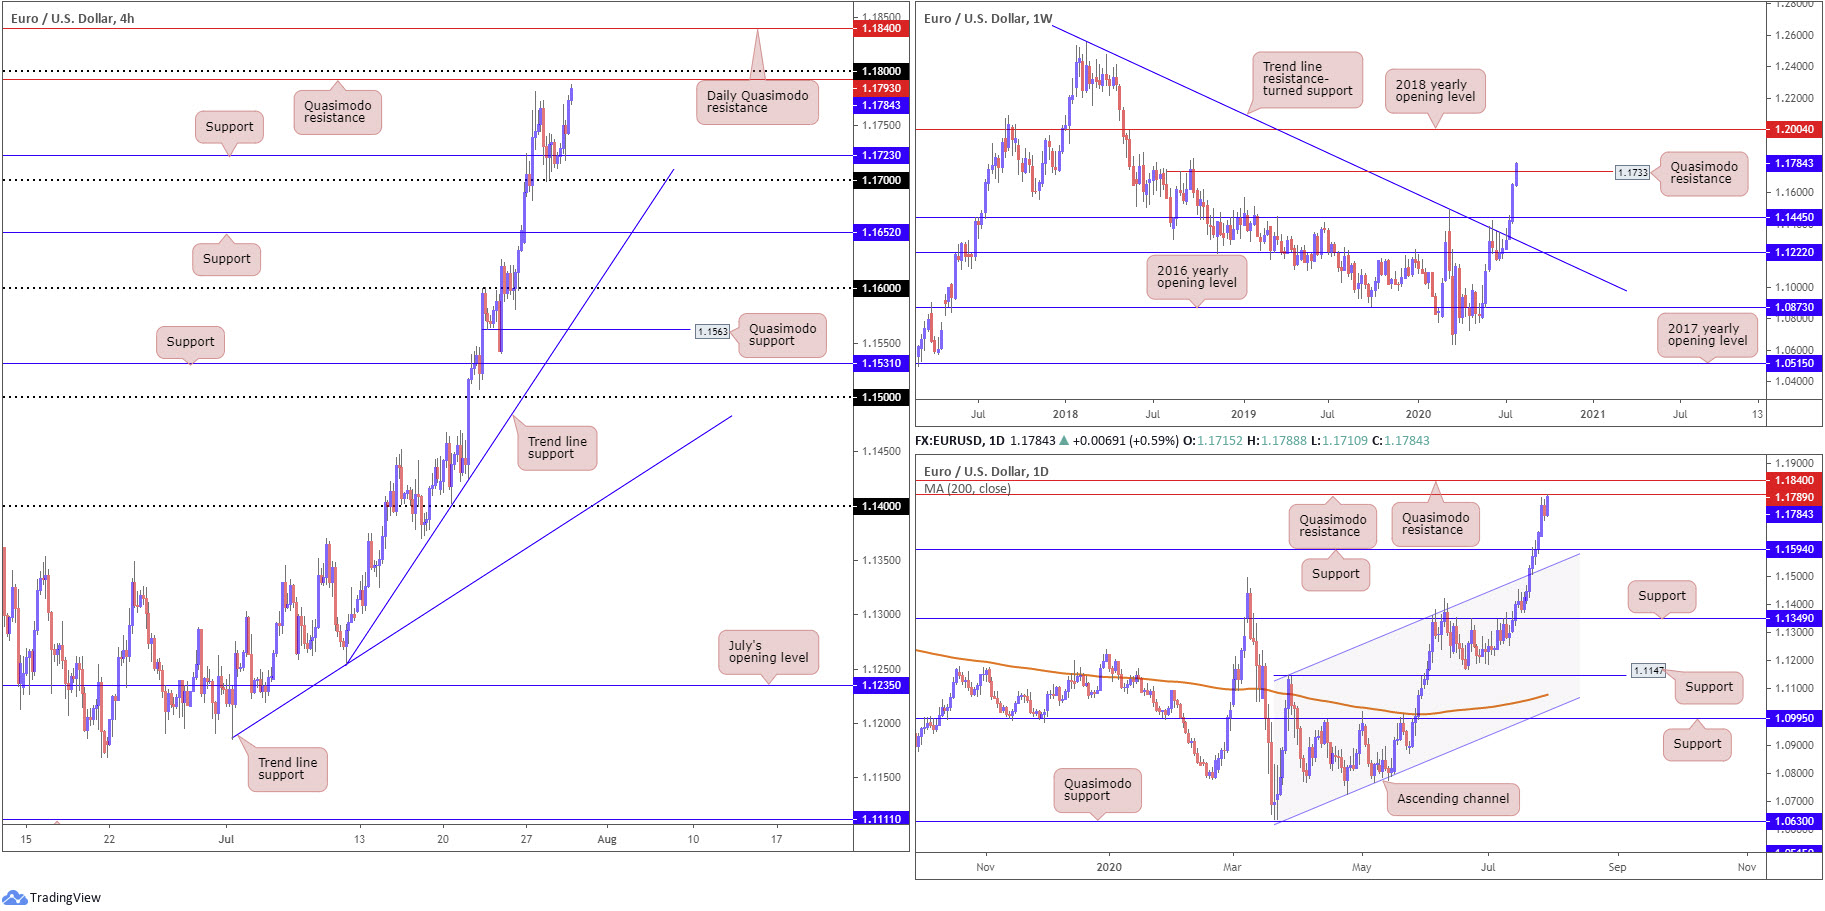
Despite having dipped a toe in waters above the 94.00 handle, the US dollar index resumed its downward decline Wednesday and overthrew 93.50. With the euro forming the largest component of the index, EUR/USD reclaimed Tuesday’s losses on Wednesday and established support off 1.17 and the 1.1723 base. The next upside targets can be seen at a Quasimodo resistance taken from 1.1793, closely shadowed by the 1.18 handle.
Technical structure on the higher timeframes has weekly price seeking levels above Quasimodo resistance at 1.1733. However, technicians are unlikely to consider the Quasimodo formation consumed until we take out the 1.1815 September 24 high (2018), which if it comes to pass shines the spotlight on the 2018 yearly opening level at 1.2004.
The technical story on the daily timeframe reveals price trading within touching distance of a Quasimodo resistance at 1.1789. A rejection here could turn things towards support at 1.1594; a break of 1.1789, however, not only suggests we’re heading north of the weekly Quasimodo resistance high, we’re likely to touch gloves with daily Quasimodo resistance parked at 1.1840.
Areas of consideration:
The break of weekly trend line resistance (July 13), taken from the high 1.2555, and violation of the 1.1495 March 9 high, reflects a long-term (potential) technical trend change.
Combined, the daily Quasimodo resistance at 1.1789, as well as H4 Quasimodo resistance at 1.1793 and the 1.18 handle, offers a resistance base to work with today, which may see countertrend traders emerge. Breaking 1.18, though, could have intraday breakout buyers make an entrance, targeting daily Quasimodo resistance at 1.1840.
GBP/USD:
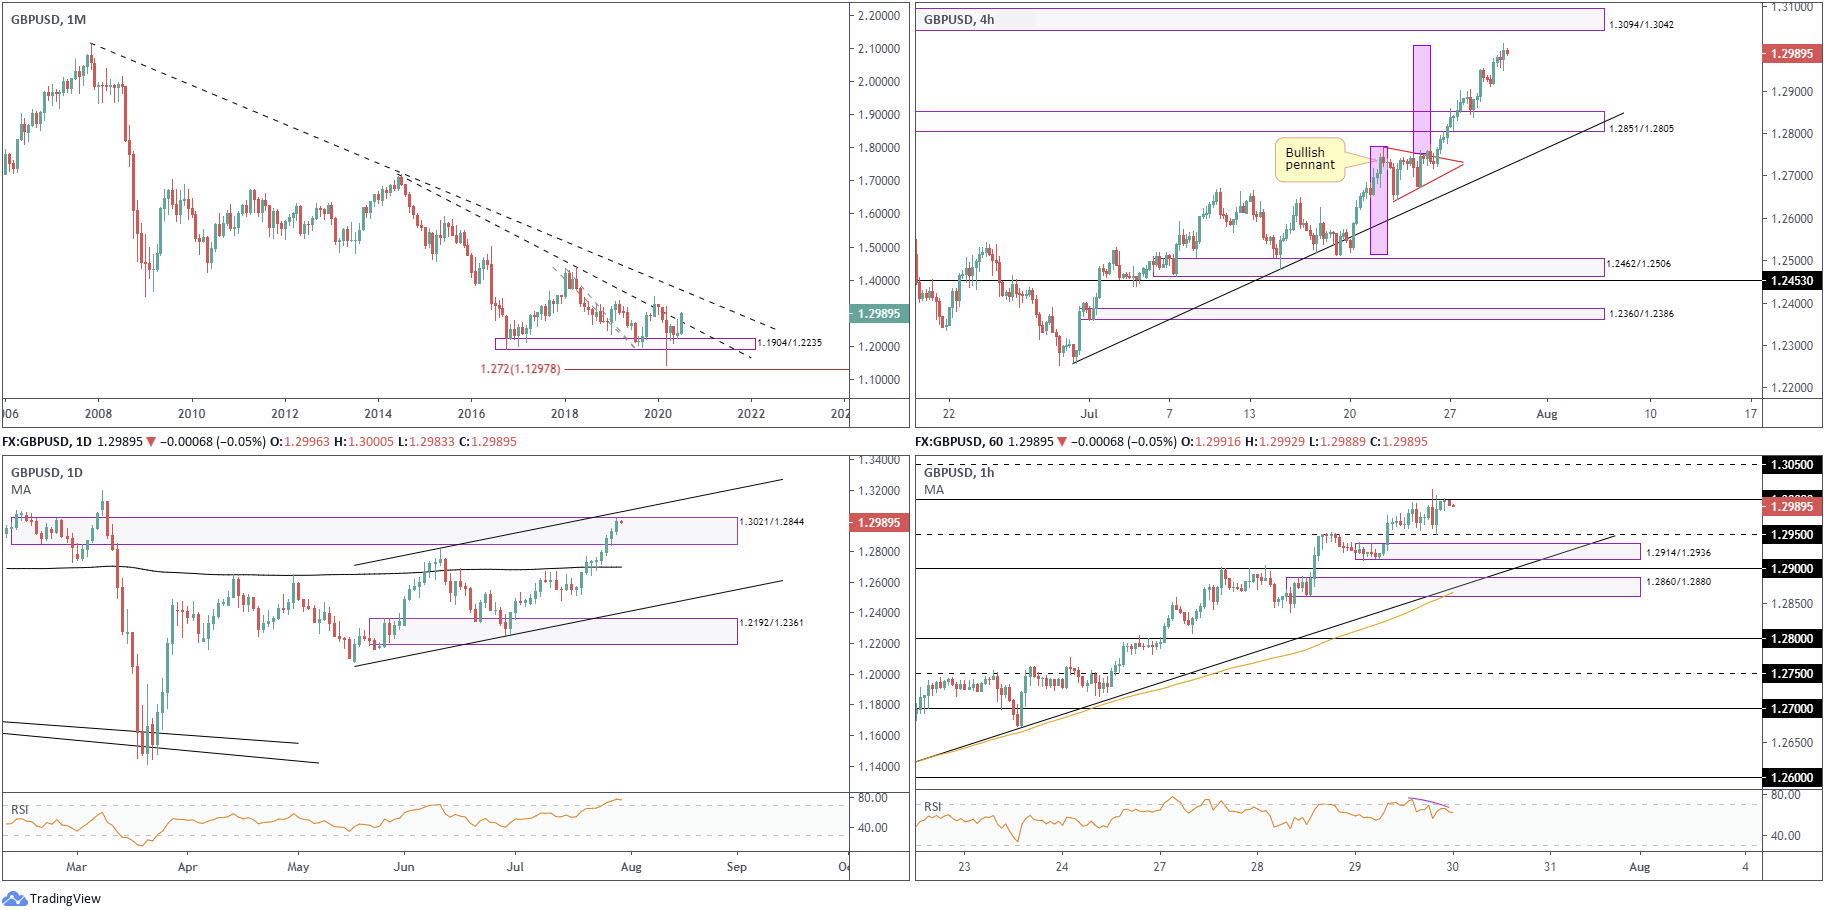
Amidst further USD decline, the British pound made headway north of H4 support at 1.2939 (a prior Quasimodo resistance) and cornered the key figure 1.30 Wednesday, a level sited under H4 Quasimodo resistance at 1.3017. This, as you can see, witnessed the pair record a ninth consecutive daily gain.
Weekly flow is seen overthrowing long-term trend line resistance, extended from the high 1.5930, consequently exposing the 127.2% Fibonacci extension point at 1.3043 as the next upside hurdle. This comes after a decisive breach of the 2019 yearly opening level at 1.2739 last week.
Readers will also want to acknowledge recent movement had daily price cross swords with an ABCD (black arrows) completion around 1.2982ish, plotted south of Quasimodo resistance at 1.3069.
Areas of consideration:
The recent trend line resistance break on the weekly timeframe, despite the 1.3514 December 9 high (2019) still intact (a break of here also signals trend change to the upside), may have long-term traders consider long positions.
The daily ABCD (black arrows) completion around 1.2982, coupled with the key figure 1.30 and H4 Quasimodo resistance at 1.3017, could put forward a base of resistance today.
Breaking 1.3017, nonetheless, leaves breakout traders in a precarious situation, given the 127.2% Fibonacci extension point at 1.3043 potentially offering resistance, based on the weekly timeframe. With that being said, a H4 break of 1.3017 and test of 1.3043, followed by a H4 close back under 1.30, could serve as an interesting countertrend sell signal (a fakeout setup due to buy-stop liquidity north of 1.30).
AUD/USD:
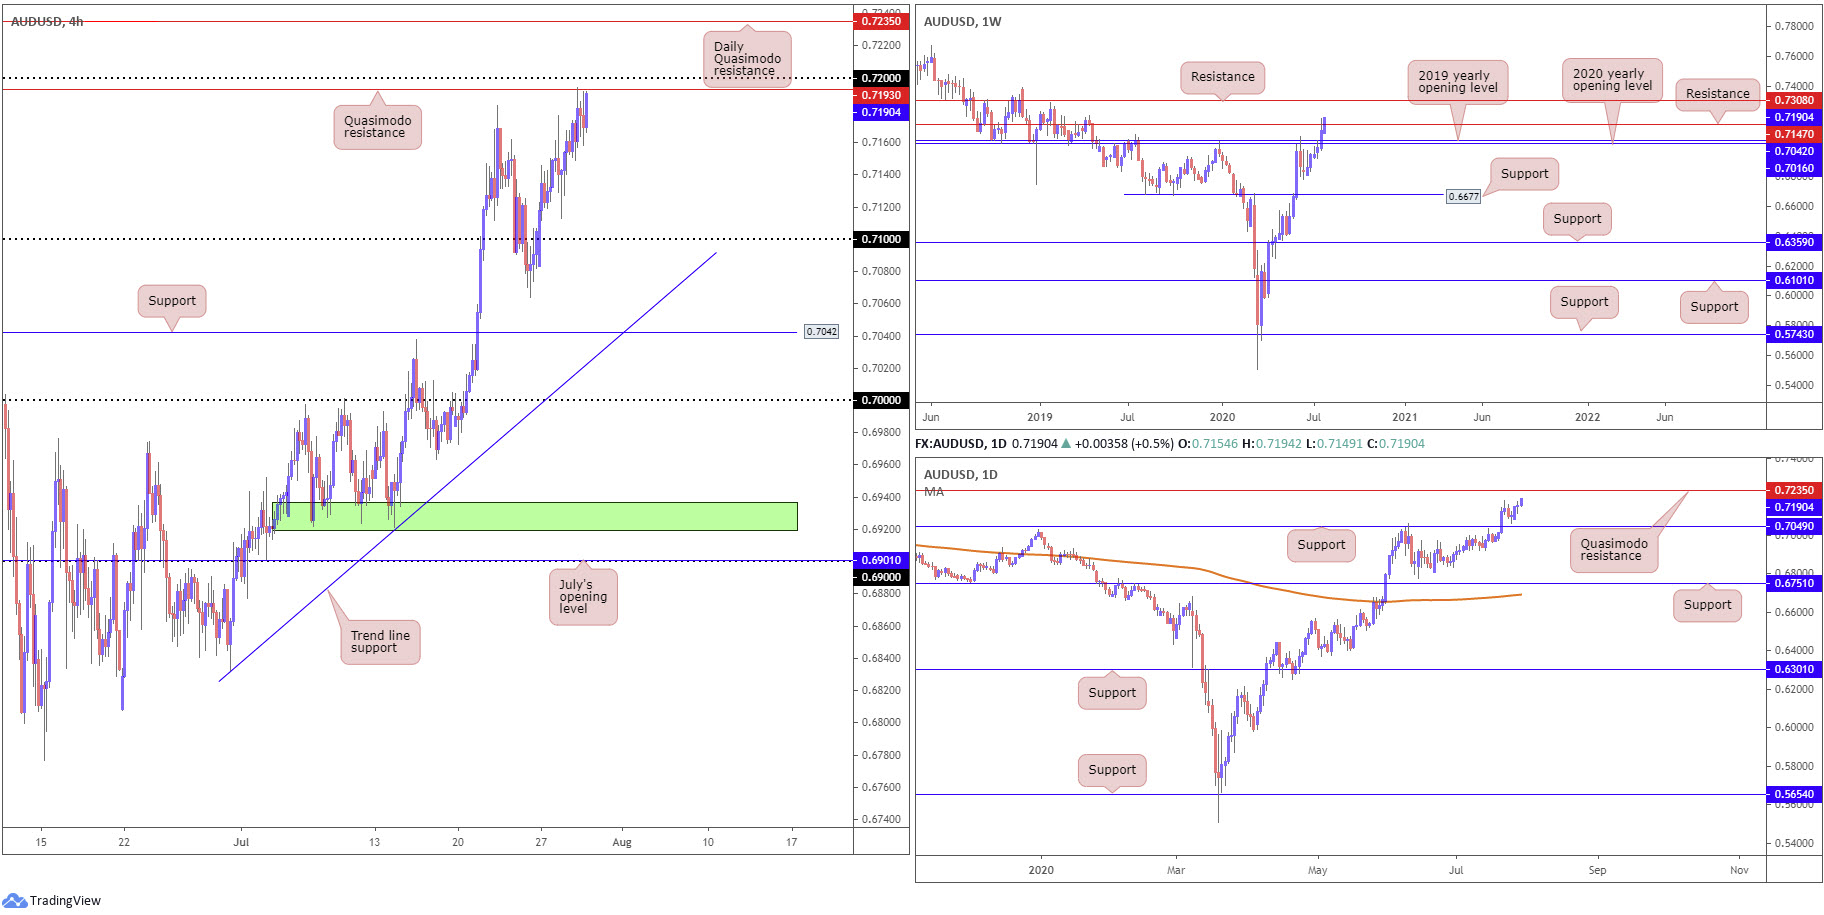
The Australian dollar concluded higher against a sinking buck for a fourth consecutive session Wednesday, lifting AUD/USD to H4 Quasimodo resistance plotted at 0.7193, a base clouded by the 0.72 handle. Absorbing offers at the aforementioned levels today points things to daily Quasimodo resistance at 0.7235. Meanwhile, the weekly timeframe recently invited an approach beyond resistance at 0.7147, perhaps setting the stage for continuation moves to resistance at 0.7308.
Areas of consideration:
The immediate trend favours buyers. The break of the 0.7031 December 30 high (2019) on the weekly timeframe shows this. With that in mind, as well as weekly resistance at 0.7147 showing signs of giving way, are we looking at a break of 0.72 on the H4 and run to daily Quasimodo resistance at 0.7235, with a possibility of eventually reaching weekly resistance at 0.7308.
USD/JPY:
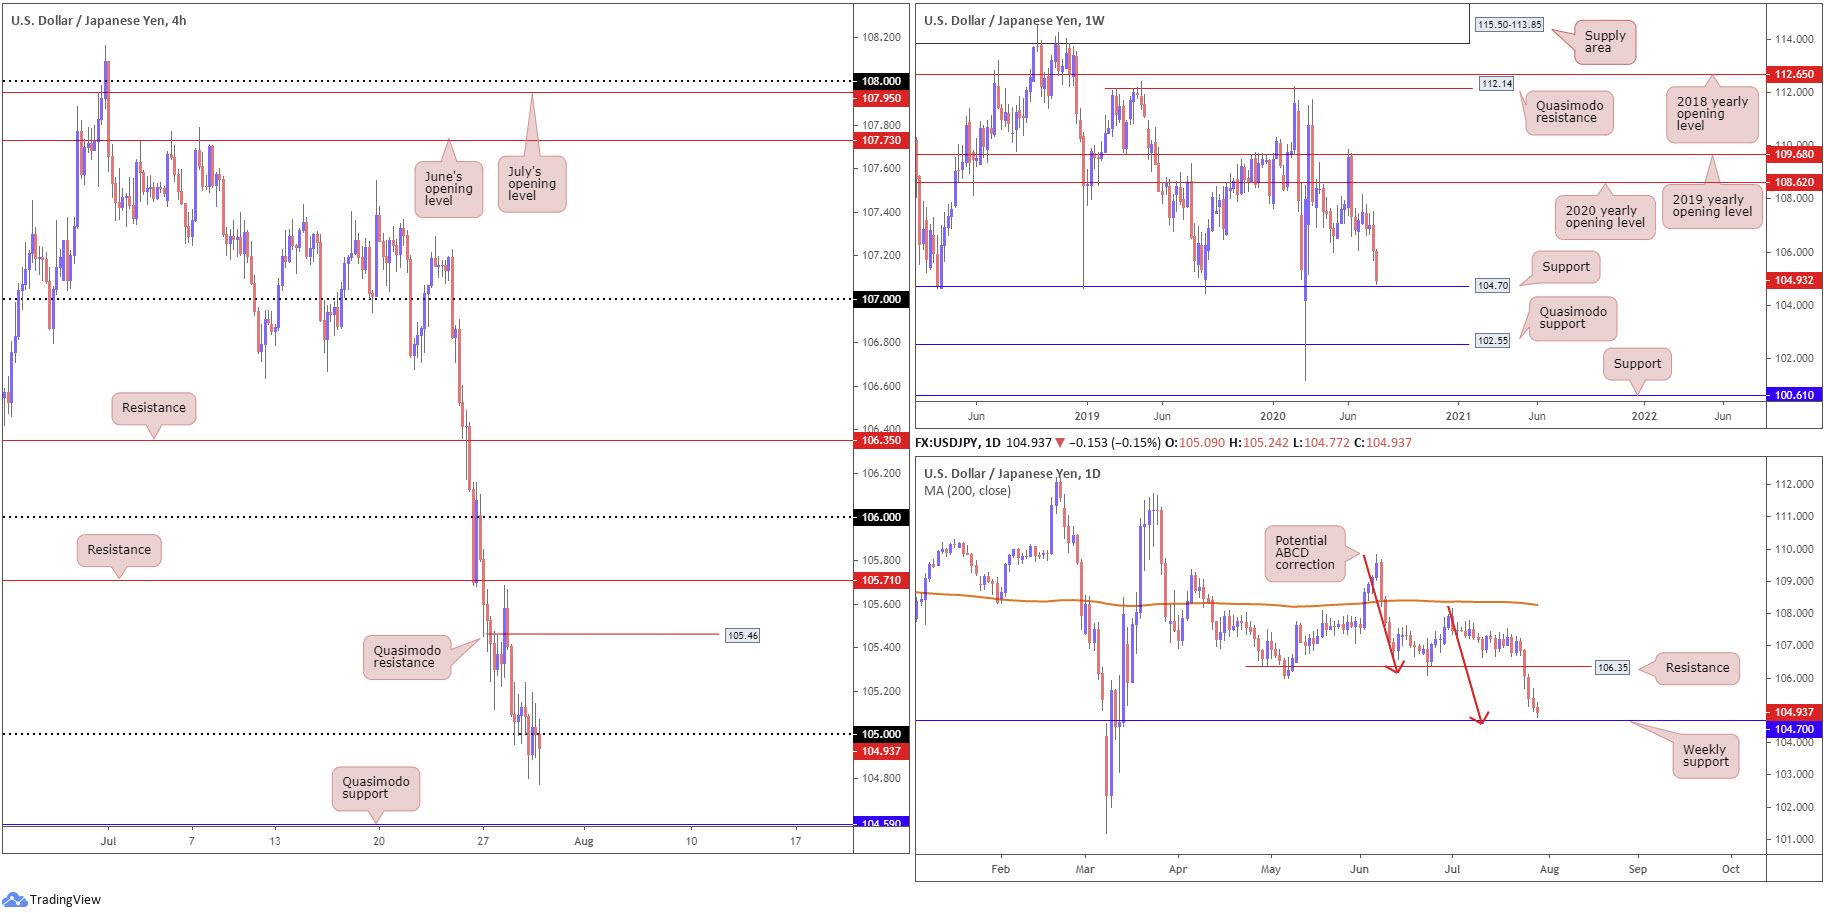
Eking out its fifth daily decline Wednesday, in keeping with the US dollar index swallowing 93.50, USD/JPY cautiously absorbed the 105 handle and has perhaps drew attention towards H4 Quasimodo support coming in at 104.59. While probing levels under 105 likely activates breakout sellers (and trips protective stop-loss orders from those attempting to fade the round number), a recovery back above the figure is likely to take aim at Quasimodo resistance from 105.46.
Interestingly, analysis on the higher timeframes demonstrates price to be closing in on weekly support at 104.70, ten pips above the aforementioned Quasimodo support on the H4 timeframe. What’s also notable around 104.70 is the formation of a daily ABCD bullish pattern (red arrows).
Areas of consideration:
Assuming we remain south of 105, the 104.70 weekly support and H4 Quasimodo support at 104.59 will be eyed. This is an area traders may expect buyers to make a show, given the additional daily ABCD completion, therefore forms an intraday downside target for sellers short sub 105.
Recovering above 105, as underlined above, could stretch price to H4 Quasimodo resistance at 105.46. Despite holding limited confluence, aside from forming alongside the immediate trend, this is still a base sellers could display interest in.
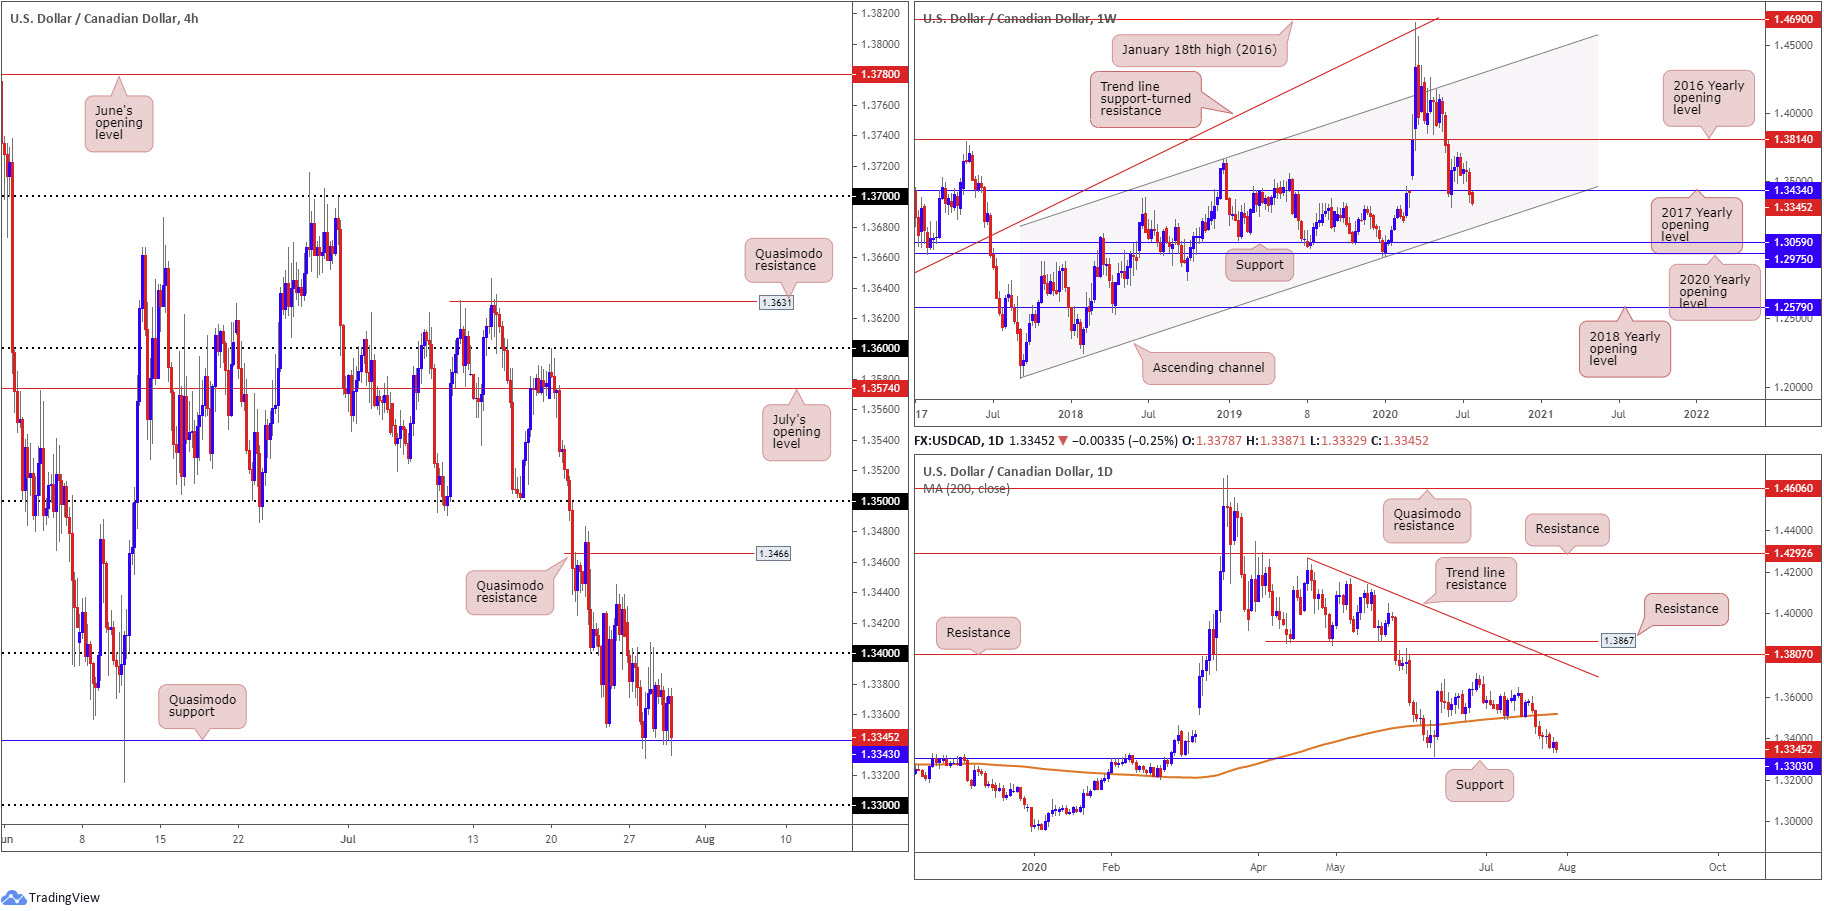
USD/CAD:
The US dollar ended Wednesday a shade lower against the Canadian dollar, though remains buoyed by Quasimodo support at 1.3343, based on the H4 timeframe. WTI faded session highs at $41.55 a barrel, weighing on the Canadian dollar (helping to support USD/CAD), while on the other side of the table the US dollar index plunged through 93.50.
Traders will also acknowledge south of 1.3343 we’ll have candles possibly drive towards 1.33.
Multi-timeframe analysis reveals structural action on the daily timeframe has support in sight at 1.3303, a level bringing forward an interesting history as support/resistance since early 2016. Support, by way of the 2017 yearly opening level, from 1.3434 on the weekly timeframe recently lost grip. Below 1.3434, channel support, taken from the low 1.2061, can be viewed as the next potential floor.
Areas of consideration:
Exploring territory beneath 1.3434 on the weekly timeframe reflects a bearish tone in this market, despite the primary trend facing north since late 2017 (within a weekly ascending channel [1.2061/1.3661]).
On the basis we have been unable to get things above 1.34 off H4 Quasimodo support at 1.3343, a break of the latter could be seen today, which may have intraday sellers take advantage of the space between the 1.3343 and 1.33.
In addition to the above, a bullish reaction from daily support at 1.3303 could still be in the offing, joined with the 1.33 handle on the H4.
Dow Jones Industrial Average:
US equities wrapped up higher Wednesday, following the US Federal Reserve leaving benchmark interest rates unchanged near zero. The Dow Jones Industrial Average advanced 160.29 points, or 0.61%; the S&P 500 increased 40.00 points, or 1.24%, and the tech-heavy Nasdaq 100 concluded higher by 130.48 points, or 1.24%.
Renewed upside invited a rebound within the lower limits of a particularly interesting area of H4 support at 26297/26455. Buyers out of the area will likely have eyes on 26717ish as an initial upside hurdle, with a break here exposing 26172 peaks, followed by resistance at 27360.
The 2018 yearly opening level at 24660 remains intact on the weekly timeframe and is an important base of support to keep eyes on. Traders are likely to eventually pull in the 27638 high, despite last week’s modest pullback snapping a three-week bullish phase, followed by a possible run to the 2020 yearly opening level at 28595.
Since climbing above the 200-day SMA (orange – 26245) on July 14, daily price has been trying to gain a toehold and approach resistance at 27640. As you can see, price action came within touching distance of retesting the SMA as support yesterday.
Areas of consideration:
26297/26455 (H4) remains in the frame for buyers this morning, with a break of 26717 likely to entice further upside. A break of the current support area, however, will see buyers shift focus to H4 trend line support, taken from the low 24881, and the nearby 200-day SMA.

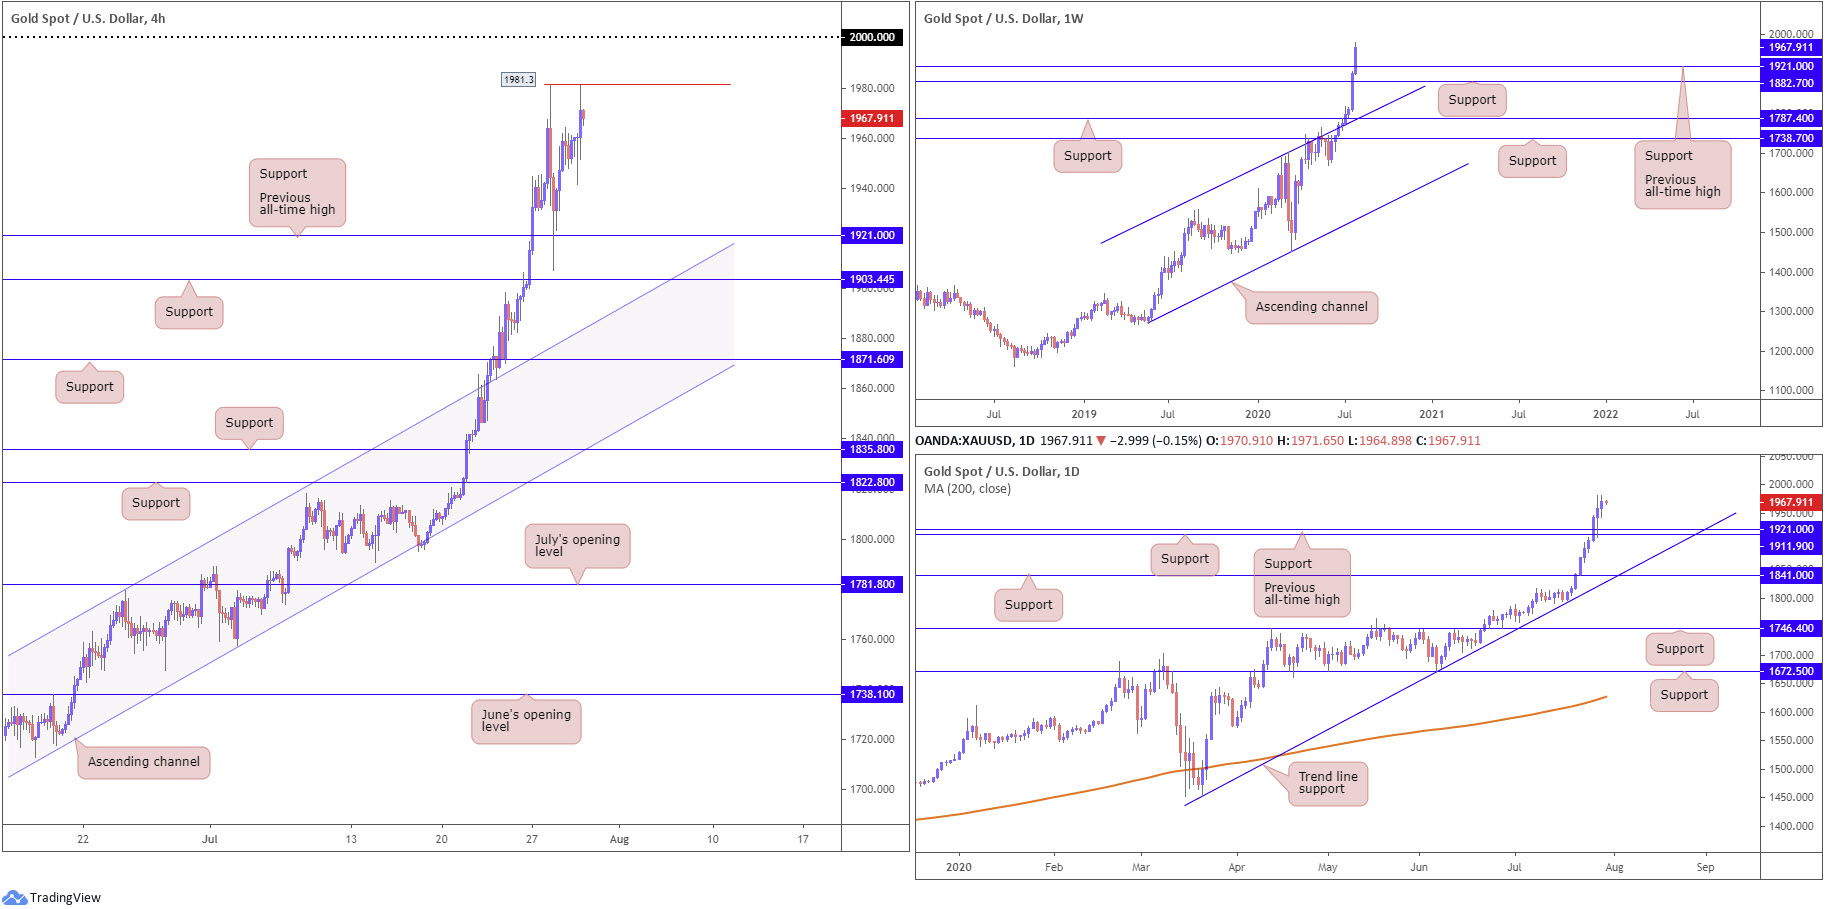
XAU/USD (GOLD):
The price of gold, in $ terms, received an additional boost Wednesday as the US dollar index navigated under 93.50. As you can see from the charts, XAU/USD came within shouting distance of challenging all-time peaks at 1981.3, following Tuesday’s decisive rebound from the previous all-time high at 1921.0 (now a serving support).
Upside targets remain at the recently formed all-time peak at 1981.3, with a decisive break exposing the widely watched 2000.0 base.
Areas of consideration:
Further buying remains likely in this market, with buyers potentially targeting 1981.3, followed by the 2000.0 level.
A break of 1981.3, therefore, could stimulate bullish scenarios to 2000.0 today, while dips back to 1921.0 may also attract fresh buyers.
The accuracy, completeness and timeliness of the information contained on this site cannot be guaranteed. IC Markets does not warranty, guarantee or make any representations, or assume any liability regarding financial results based on the use of the information in the site.
News, views, opinions, recommendations and other information obtained from sources outside of www.icmarkets.com.au, used in this site are believed to be reliable, but we cannot guarantee their accuracy or completeness. All such information is subject to change at any time without notice. IC Markets assumes no responsibility for the content of any linked site.
The fact that such links may exist does not indicate approval or endorsement of any material contained on any linked site. IC Markets is not liable for any harm caused by the transmission, through accessing the services or information on this site, of a computer virus, or other computer code or programming device that might be used to access, delete, damage, disable, disrupt or otherwise impede in any manner, the operation of the site or of any user’s software, hardware, data or property.


