
Key risk events today:
German Prelim CPI m/m; BoE Monetary Policy Report, MPC Official Bank Rate Votes, Monetary Policy Summary, Official Bank Rate; US Advance GDP q/q; US Advance GDP Price Index q/q.
(Italics represents previous analysis and outside sources).
EUR/USD:
The Federal Reserve kept its benchmark interest rate steady and continued to signal policy would stay on hold for the time being as the US enters a presidential election year. The target range of the federal funds rate of 1.5 per cent to 1.75 per cent is ‘appropriate to support sustained expansion of economic activity’, the Federal Open Market Committee said Wednesday, repeating language from the December statement (Bloomberg).
Key quotes from Jerome Powell, Chair of the Board of Governors of the Federal Reserve System (Reuters):
‘The labour market continues to perform well’.
‘It’s a bit surprising that wages haven’t risen more given such low unemployment’.
‘Coronavirus outbreak is a very serious issue’.
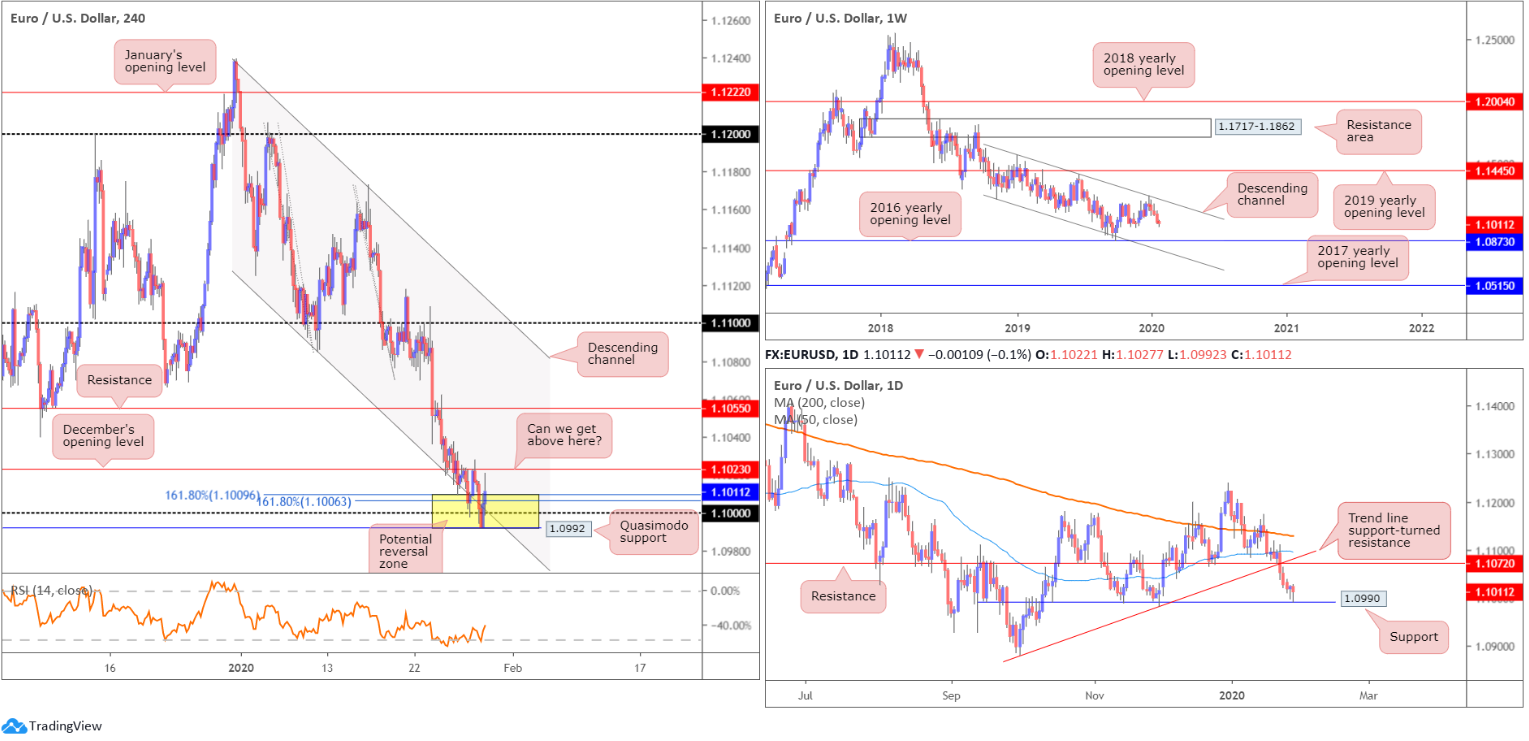
Technical research, based on H4 movement, has price action advancing out of 1.0992/1.1009 (comprised of the key figure 1.10, channel support, pencilled in from the low 1.1085, Quasimodo support at 1.0992 and two 161.8% Fibonacci extensions at 1.1006 and 1.1009 – yellow).
It might also be worth noting daily support is seen a touch south of the said H4 zone at 1.0990. Daily price, as you can see, is also in the process of chalking up its second hammer candlestick signal (considered a bullish signal at troughs).
Contrary to daily and H4 structure, the weekly timeframe exhibits scope to extend losses south of long-standing channel resistance, drawn from the high 1.1569. Assuming sellers remain in the driving seat, the 2016 yearly opening level at 1.0873 is feasible support followed by channel support, taken from the low 1.1109. Further supporting sellers is the primary trend, lower since topping in early 2018, at 1.2555.
Areas of consideration:
Well done to any traders long 1.0992/1.1009; this was a noted bullish reversal zone to keep an eye on. A H4 close above December’s opening level at 1.1023 is still likely on the radar for many before reducing risk.
The next resistance targets beyond here rest at H4 resistance drawn from 1.1055, closely followed by daily resistance at 1.1072. Eyeing much higher than here is unlikely due to weekly price threatening lower moves.
GBP/USD:
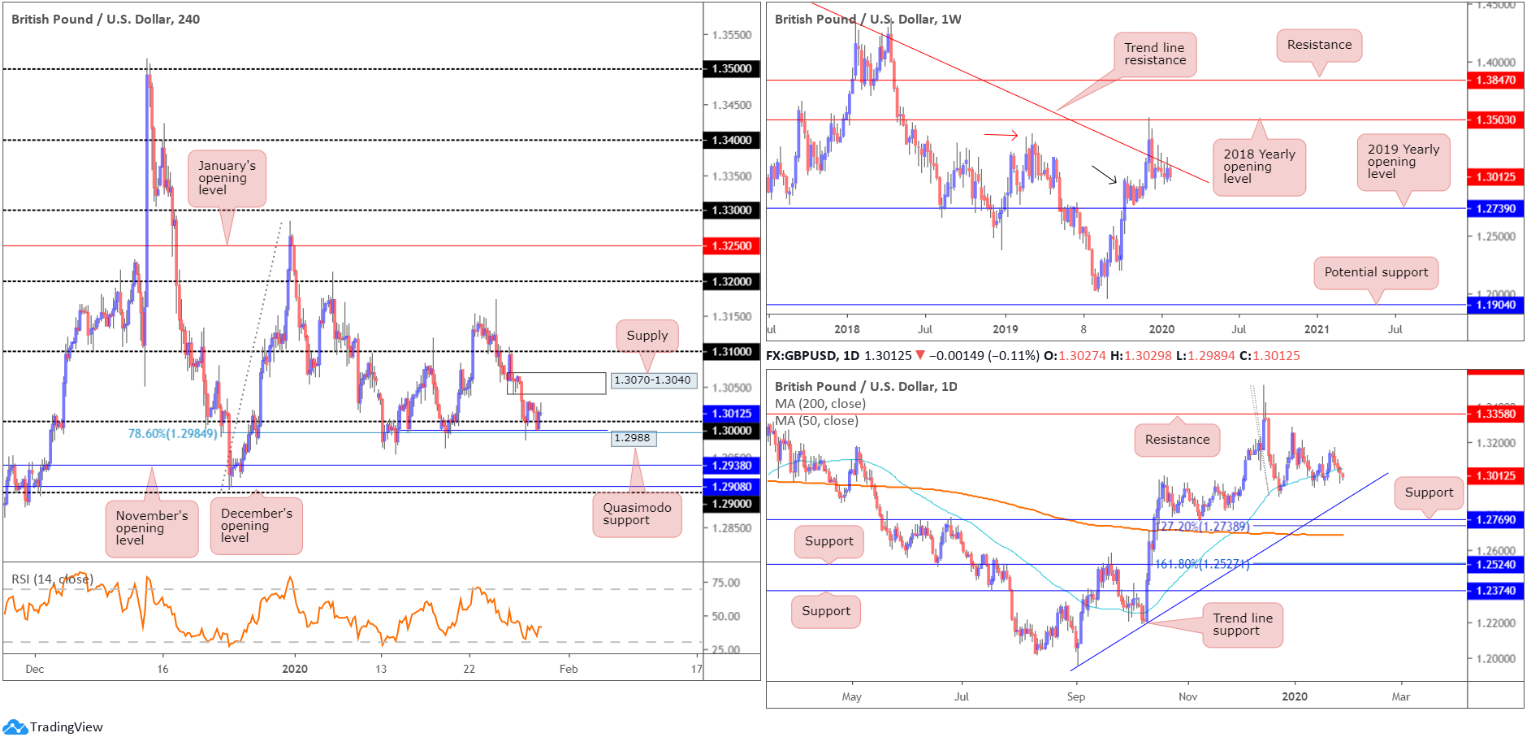
Although confined to a daily range between 1.3029/1.2989, cable marginally firmed in US trade following the Federal Reserve keeping its benchmark interest rate steady, lifting price north of the key figure 1.30 on the H4, Quasimodo support at 1.2988, as well as a 78.6% Fibonacci retracement at 1.2884. South of 1.30, we have November’s opening level at 1.2938 in sight, December’s opening level at 1.2908 and the 1.29 handle. To the upside, supply rests relatively close by at 1.3070-1.3040, shadowed by the 1.31 handle.
Technical research on the daily timeframe has the unit languishing beneath its 50-day SMA (blue – 1.3052). This violation may have cleared the pathway south to trend line support, drawn from the low 1.1958, support at 1.2769 and the 200-day SMA (orange – 1.2687). Note the aforementioned SMA is in the process of flattening after drifting south since the beginning of July. With respect to resistance on the daily timeframe, the only levels of interest right now sit at the 1.3173 January 24 high, the 1.3284 December 31st high and a resistance level at 1.3358, which capped upside since mid-June 2019. Daily shows potential to the downside after taking the 50-day SMA, though trade with caution. Late December and throughout January, price engulfed the said SMA to the downside in similar fashion, but was able to recover and close higher.
Since late December, longer-term movement on the weekly timeframe has been consolidating between long-standing trend line resistance, pencilled in from the high 1.5930, and demand around the 1.2939 region (black arrow), likely seduced by the recent break of the notable high at 1.3380 (red arrow). A break of the said trend line has the 2018 yearly opening level at 1.3503 to target, whereas a move south implies we might see a push to the 2019 yearly opening level at 1.2739, consequently tripping sell stops below the current demand zone.
Areas of consideration:
Sell stops beneath 1.30 are largely filled, with additional impetus derived from H4 Quasimodo support at 1.2988/78.6% Fibonacci retracement at 1.2984. This is possibly enough to draw in intraday buying towards H4 supply mentioned above at 1.3070-1.3040. Therefore, this space may be of interest to some readers this morning.
A decisive close south of 1.30 today, on the other hand, unlocks bearish scenarios to at least November’s opening level at 1.2938. Aggressive traders will look to trade the breakout candle’s close and position protective stop-loss orders accordingly, while conservative traders may opt to hold fire and wait for a retest at 1.30 to occur. This helps prevent getting taken out on a fakeout through 1.30, which is common viewing around psychological levels.
AUD/USD:
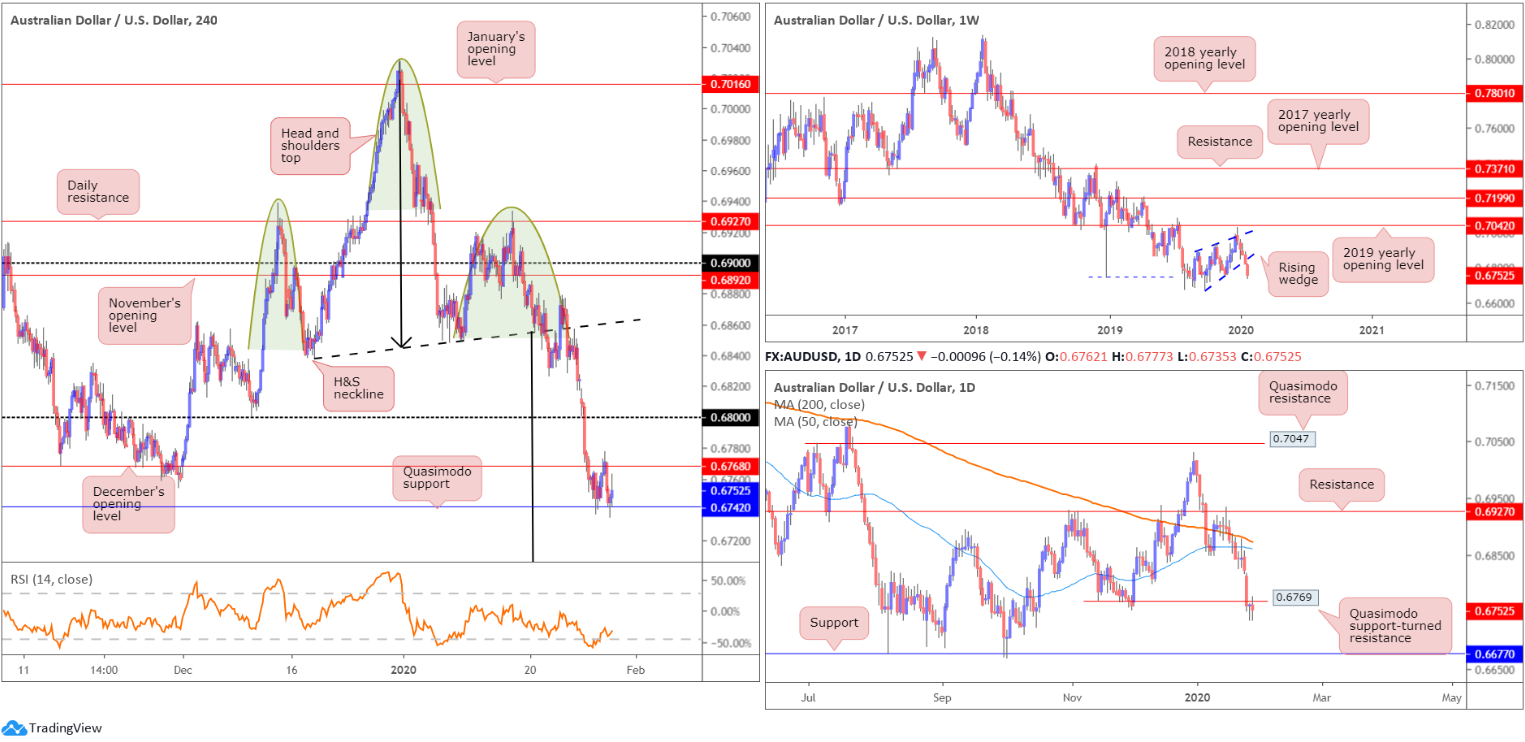
All in all, Wednesday hosted another relatively hushed session, though did manage to mildly breach Tuesday’s range between 0.6765/0.6737.
H4 Quasimodo support at 0.6742 remains in play and December’s opening level at 0.6768 continues to represent resistance. The next port of call beyond 0.6742 is 0.67 (not visible on the screen), whereas a break higher has 0.68 to target. Also note the relative strength index (RSI) is seen climbing out of oversold terrain.
Traders who read previous reports may also recall the following pieces (italics):
H4 price has been chalking up a head and shoulders top pattern since mid-December 2019 (left shoulder sports a top at 0.6938, right shoulder at 0.6933 and the head at 0.7031 – green). The neckline is drawn from the 0.6838 December 18 low and the 0.6850 January 9 low (black line).
H&S traders will be looking for 0.6671ish as a take-profit target (calculation from the head to neckline added to the breakout point – black arrows).
There will likely be traders short this market on last Tuesday’s H4 close south of the H&S neckline. In addition, price retested the H&S neckline on Friday and rotated lower, another noted entry point. Well done to any readers who remain short the H&S pattern.
On more of a broader perspective, the weekly timeframe, since registering a bottom in late September at 0.6670, has been carving out what appears to be a rising wedge formation, typically considered a continuation pattern. The past four weeks witnessed price decline back into the rising wedge and, thanks to recent selling, break the lower edge. With the primary downtrend having been in full force since topping at 0.8135, in early 2018, the recent close beyond the lower edge of the noted wedge formation may trigger weighty sell stops, both from lower-timeframe traders entering long the shorter-term correction and longer-term traders’ breakout sell orders.
Price action on the daily timeframe elbowed through Quasimodo support at 0.6769, testing lows of 0.6737 Tuesday. With this level now a serving resistance, limited support is seen on this timeframe until we reach support at 0.6677.
Areas of consideration:
Well done to any readers short the H4 H&S formation, either on last Tuesday’s breakout or Friday’s neckline retest. With 0.68 and December’s opening level at 0.6768 cleared, H4 Quasimodo support at 0.6742 is next on tap to break. Beyond here, 0.67 is visible, with a violation presenting the H&S take-profit target around 0.6670ish.
Traders who read Wednesday’s analysis may recall:
Additional selling opportunities, based on a H4 retest at 0.6768, preferably in the shape of a H4 or H1 bearish candlestick pattern (entry and risk can be defined according to this configuration), may also be an option worthy of consideration today.
0.6768 held as resistance yesterday, though price action failed to produce a bearish candlestick signal. A second retest of 0.6768 may form today, though, so keep an eye out for bearish candlestick signals in this region.
USD/JPY:
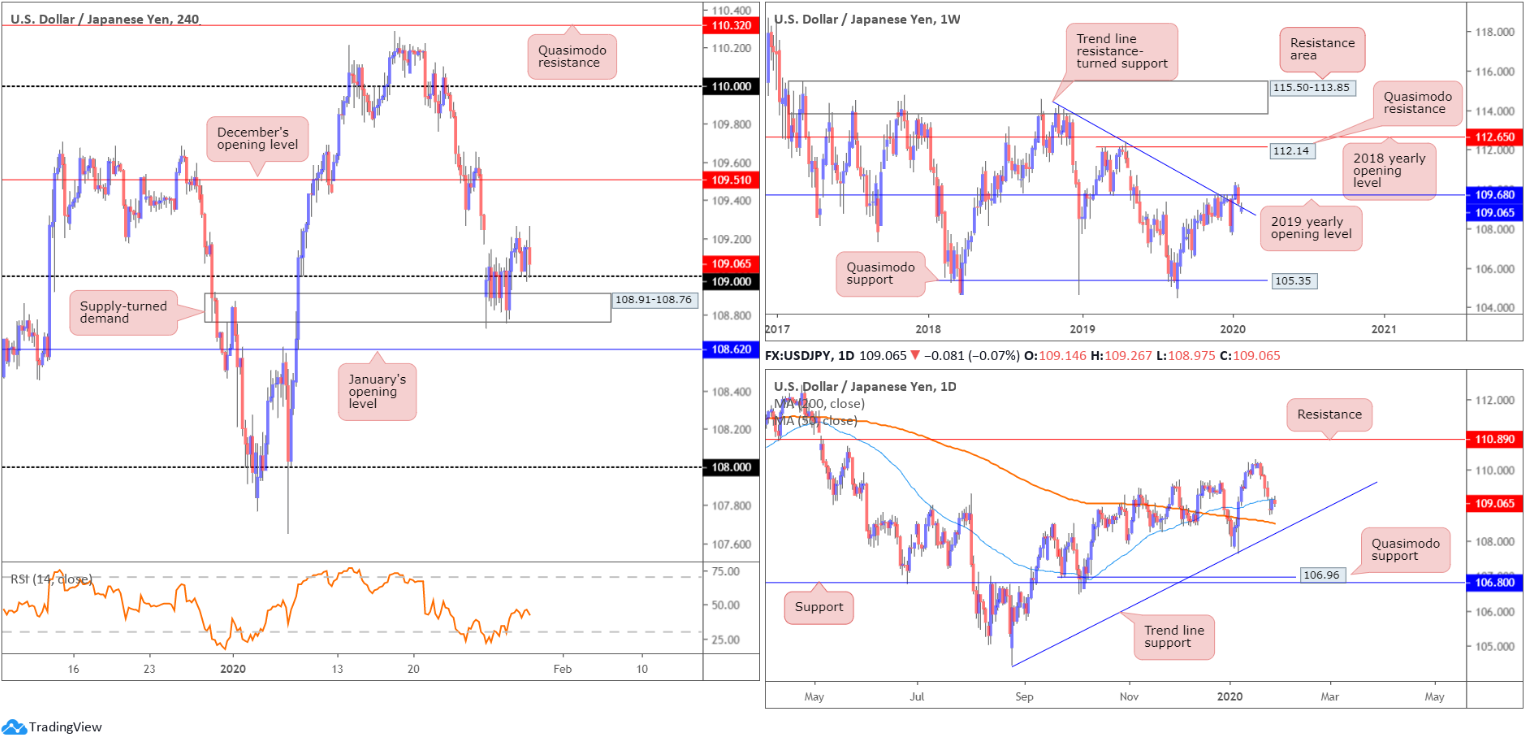
Despite highlighting subdued movement, confined to a 30-point range between 109.26/108.97, H4 price retested the top edge of 109. This followed Tuesday’s advance out of H4 supply-turned demand at 108.91-108.76.
Previous technical briefings reported the following:
The weekend’s gap, as you can see, was filled, though, as of current price, the unit appears uncertain to push higher – H4 price currently displays an indecision doji candle. This may have something to do with daily price testing the underside of its 50-day SMA (blue – 109.18).
The story on the weekly timeframe has price trading marginally beneath the 2019 yearly opening level at 109.68 and a touch north of trend line resistance-turned support, extended from the high 114.23. Buying from here may set the long-term stage for a run to Quasimodo resistance at 112.14 and the 2018 yearly opening level at 112.65, whereas moves lower underscores the 107.65 Jan 6 low.
The recent decline on the daily timeframe brought price through the 50-day SMA (blue – 109.17), which is currently offering resistance. Note the said SMA crossed above the 200-day SMA (orange – 108.48) mid-December 2019, referred to as a ‘Golden Cross’. Trend line support, drawn from the low 104.44, may enter sight, in the event we continue exploring lower ground, while a push above the said 50-day SMA has the 110.29 January 17 high to play for, with a break targeting resistance at 110.89.
Areas of consideration:
Wednesday’s technical piece aired the following here:
While yesterday’s decisive close above 109 possibly enticed some buyers long into the market, conservative traders are likely honing in on a potential retest at 109, before pulling the trigger. A retest at 109, although open to a fakeout into 108.91-108.76, is the more conservative approach, having noted daily price testing the underside of the 50-day SMA.
As underlined above, the initial take-profit target north of 109 is December’s opening level at 109.51. This is an ideal location to reduce risk to breakeven and take partial profits off the table.
Some traders are likely long the 109 retest yesterday, with protective stop-loss orders either tucked a few points beneath the round number or, more conservatively, south of 108.91-108.76.
USD/CAD:
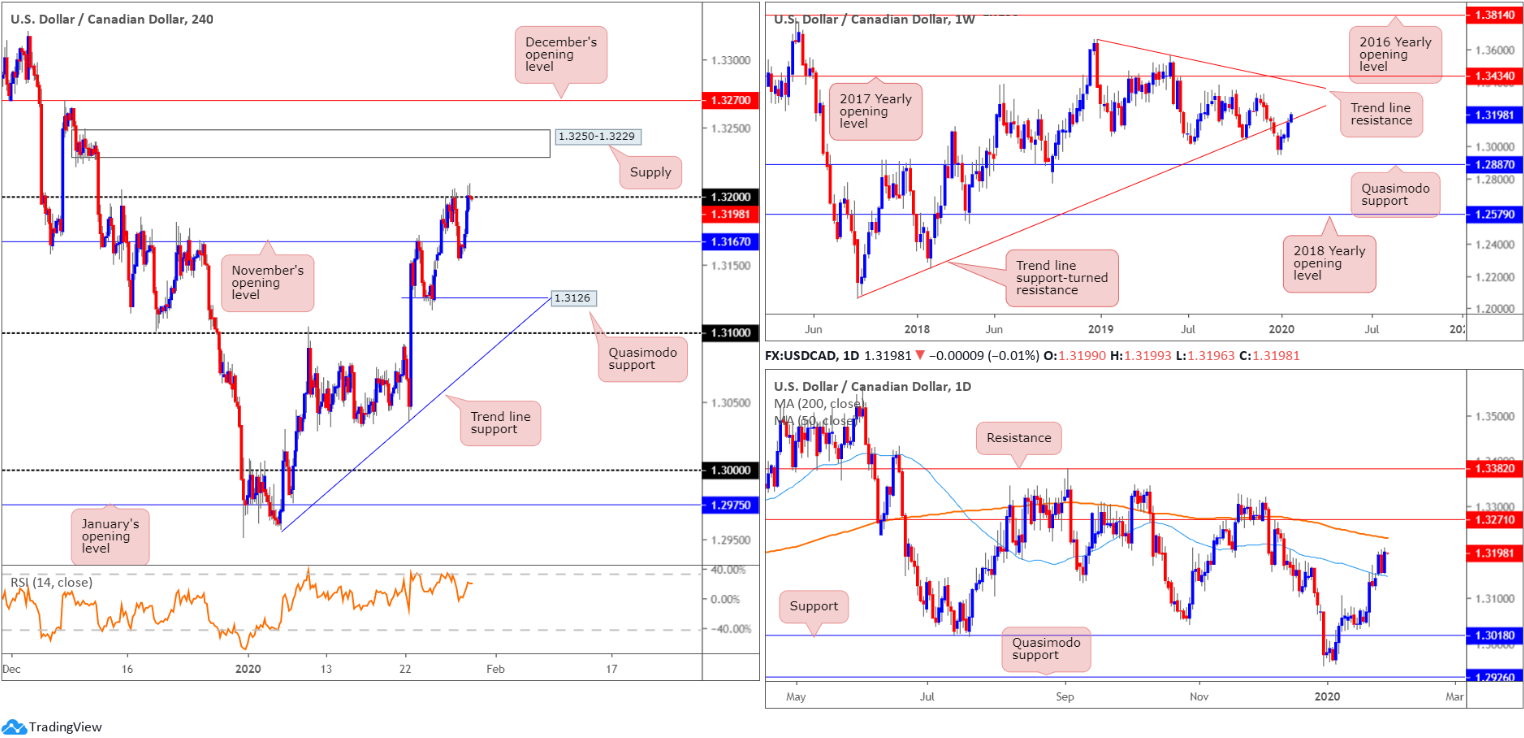
Conquering the 1.32 handle to the upside, USD/CAD added more than 45 points, or 0.37%, Wednesday.
The pair caught fresh bids south of November’s opening level at 1.3167 on the H4, and a touch above the 50-day SMA (blue – 1.3149), as WTI prices collapsed after the weekly EIA inventory data, and a wider cooling of risk appetite weighed on the sector. Note a decline in oil is generally considered bullish for USD/CAD.
Assuming buyers hold onto the bulk of their gains above 1.32 today, notable supply (strong momentum derived from the base) coming in at 1.3250-1.3229 is next on tap, closely followed by December’s opening level at 1.3270.
Weekly activity is seen attempting to climb above trend line support-turned resistance, extended from the low 1.2061. Continued bidding from here could reach tops around 1.3317, closely followed by trend line resistance (1.3661) and the 2017 yearly opening level at 1.3434. A rejection lower, on the other hand, may prompt a selloff to the 1.2951 December 30 low, followed by a Quasimodo formation at 1.2887. The immediate trend has faced north since bottoming in September 2017; however, this move could also be considered a deep pullback in a larger downtrend from the 1.4689 peak in early January 2016.
A closer reading of price action on the daily timeframe has the unit approaching the 200-day SMA (orange – 1.3232), tailed by resistance set at 1.3271. Both the 200-day SMA and the 50-day SMA (blue – 1.3149) currently point south.
Areas of consideration:
The break above 1.32 has drawn attention to the possibility of further buying; violations of round numbers are observed by many in the market. Although weekly price exhibits room to stretch higher, daily price has resistance stationed around 1.3232, the 200-day SMA, and H4 structure may hamper upside from supply at 1.3250-1.3229. Unless you’re able to drill down to the lower timeframes and secure a position that accommodates satisfactory risk/reward to 1.3229, a trade long above 1.32 is difficult.
In the event the current H4 supply enters view, though, a short from this angle may be something to consider, knowing the 200-day SMA intersects closely with this area. With protective stop-loss orders plotted above the upper edge of the supply, a move to at least 1.32 could be in store.
USD/CHF:
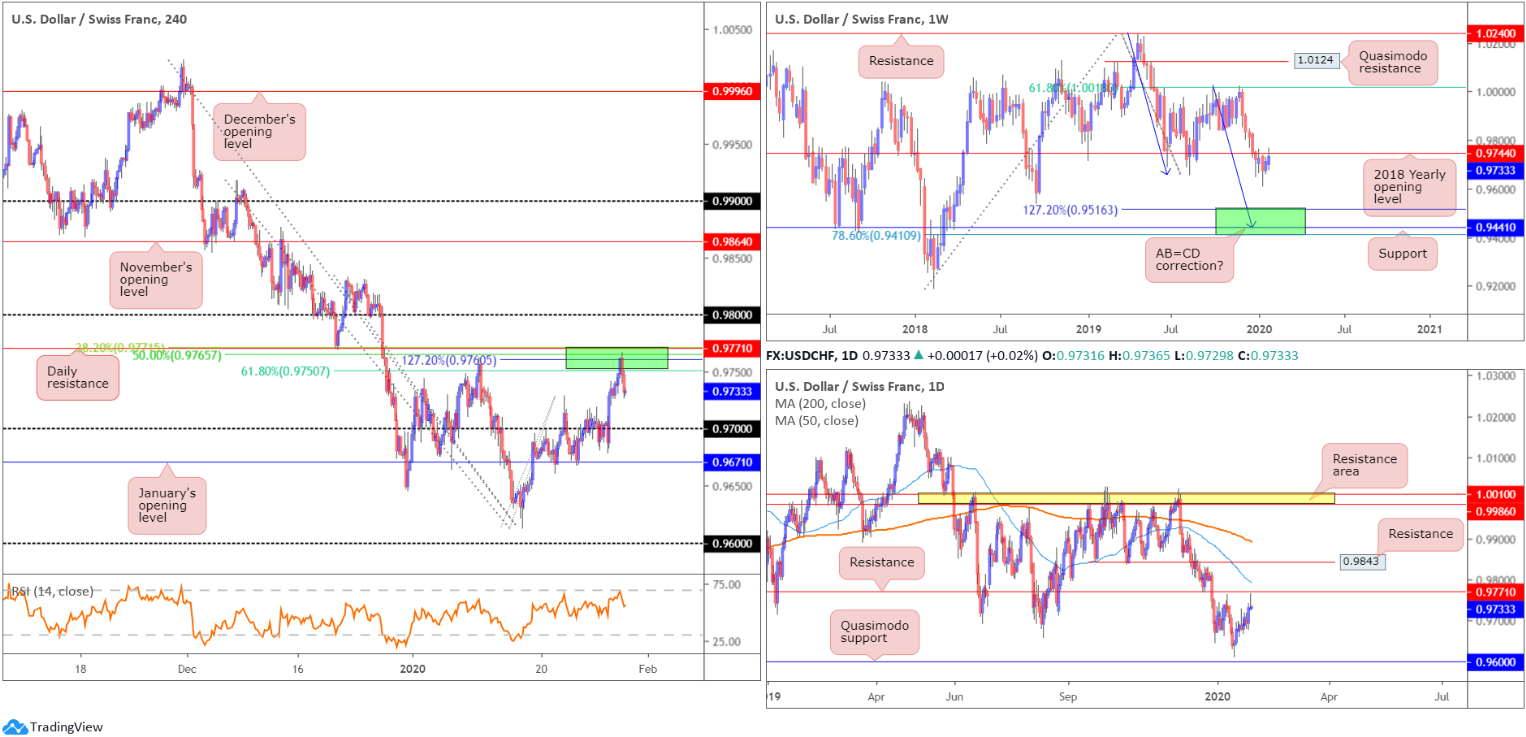
USD/CHF witnessed healthy bidding amid London hours Wednesday, based on broad-based USD buying. Things turned sour off session highs at 0.9766 in US trading, however, pressured lower from a strong area of Fibonacci confluence on the H4 timeframe and nearby daily resistance at 0.9771, between 0.9771/0.9750 (green). What also made this area appealing was the buy stops tripped above the 0.9762 January 10th high; this provided liquidity to sell into, and also the relative strength index (RSI) struck its overbought value. In terms of support, the 0.9729 January 22nd high could offer an intraday ‘floor’ today, with a break exposing the 0.97 handle.
On more of a broader perspective, weekly price is touching gloves with the 2018 yearly opening level at 0.9744, a resistance. Having seen this level serve well as support since January 2019, a turn lower from here is probable. The next downside target sits within 0.9410/0.9516, comprised of a 78.6% Fibonacci retracement at 0.9410, support at 0.9441 and a 127.2% AB=CD bullish correction (black arrows]) at 0.9516 – green.
According to structure on the daily timeframe, price pencilled in a shooting star candlestick pattern yesterday (considered a bearish signal), with the upper shadow missing resistance at 0.9771 by a hair. Pushing lower from this point has the 0.9613 January 16th low in position, stationed a few points above Quasimodo support at 0.9600.
Areas of consideration:
Traders short 0.9771/0.9750, based on the H4 timeframe, likely reduced risk to breakeven and cashed in a portion of the position at the tail end of the session. As underscored above, 0.97 is a reasonably logical downside target beyond 0.9729.
A retest at 0.9771/0.9750, by way of a H4 bearish candlestick configuration, may prompt additional selling out of the zone today, therefore, it is certainly worth keeping an eye on.
Dow Jones Industrial Average:
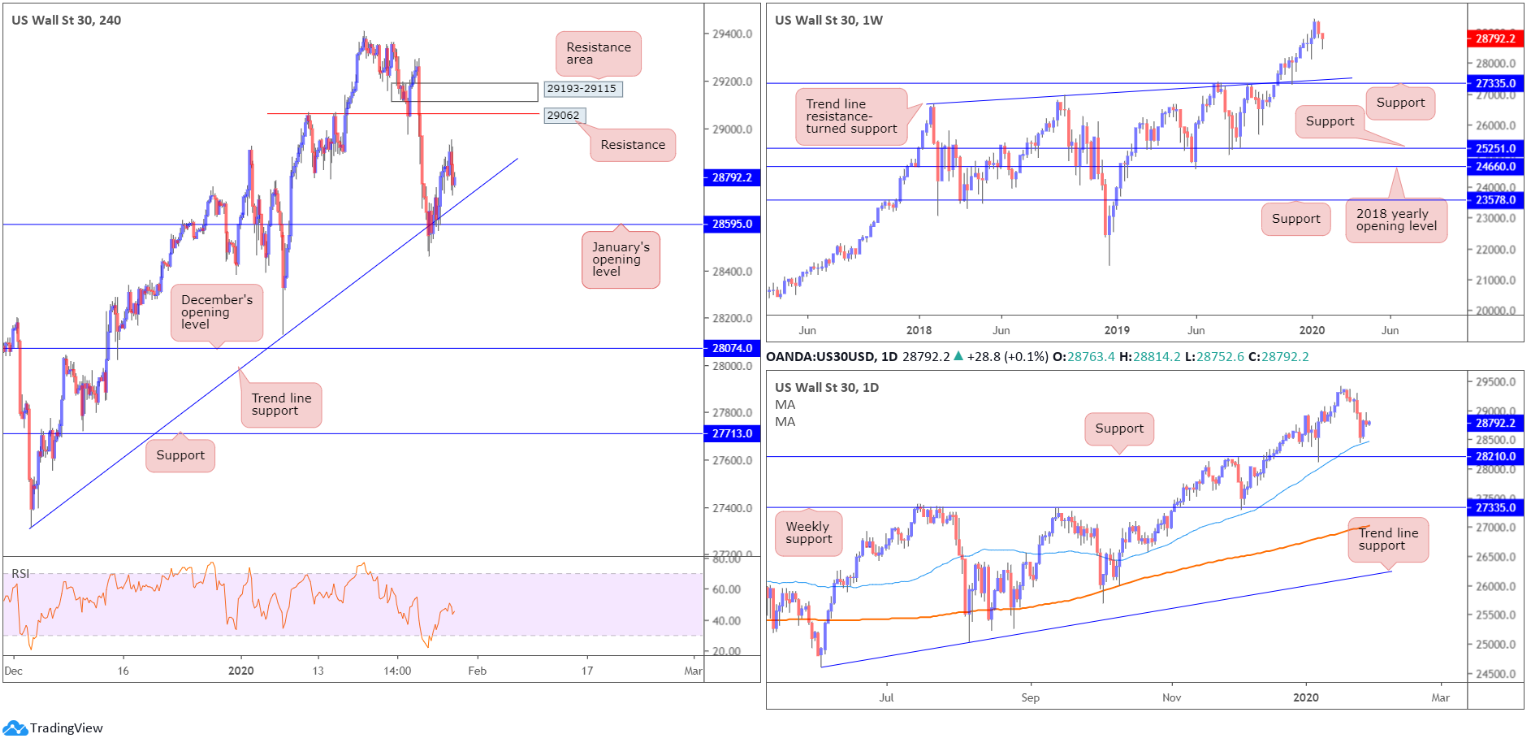
Wall Street’s major benchmarks finished mixed Wednesday, following the latest round of earnings and a warning from Federal Reserve chair Powell that the coronavirus outbreak could hit China’s economic growth. The Dow Jones Industrial Average added 11.60 points, or 0.04%; the S&P 500 declined 2.84 points, or 0.09% and the tech-heavy Nasdaq 100 ended higher by 10.68 points, or 0.12%.
From a technical standpoint, price action on the H4 timeframe remains stationed north of trend line support, extended from the low 27314, following Tuesday’s recovery off the said line along with January’s opening level at 28595. Moves higher today has resistance at 29062 and a resistance area at 29193-29115 in the firing range.
Higher-timeframe action has daily price recovering a touch above its 50-day SMA (blue – 28471), shadowed by daily support at 28210, while weekly price exhibits scope to push as far south as trend line resistance-turned support (26670), and support coming in at 27335.
Areas of consideration:
Traders long from the said H4 trend line likely reduced risk to breakeven yesterday, and maybe even cashed in a portion of the position. The next upside target, as highlighted above, falls in at H4 resistance drawn from 29062.
XAU/USD (GOLD):
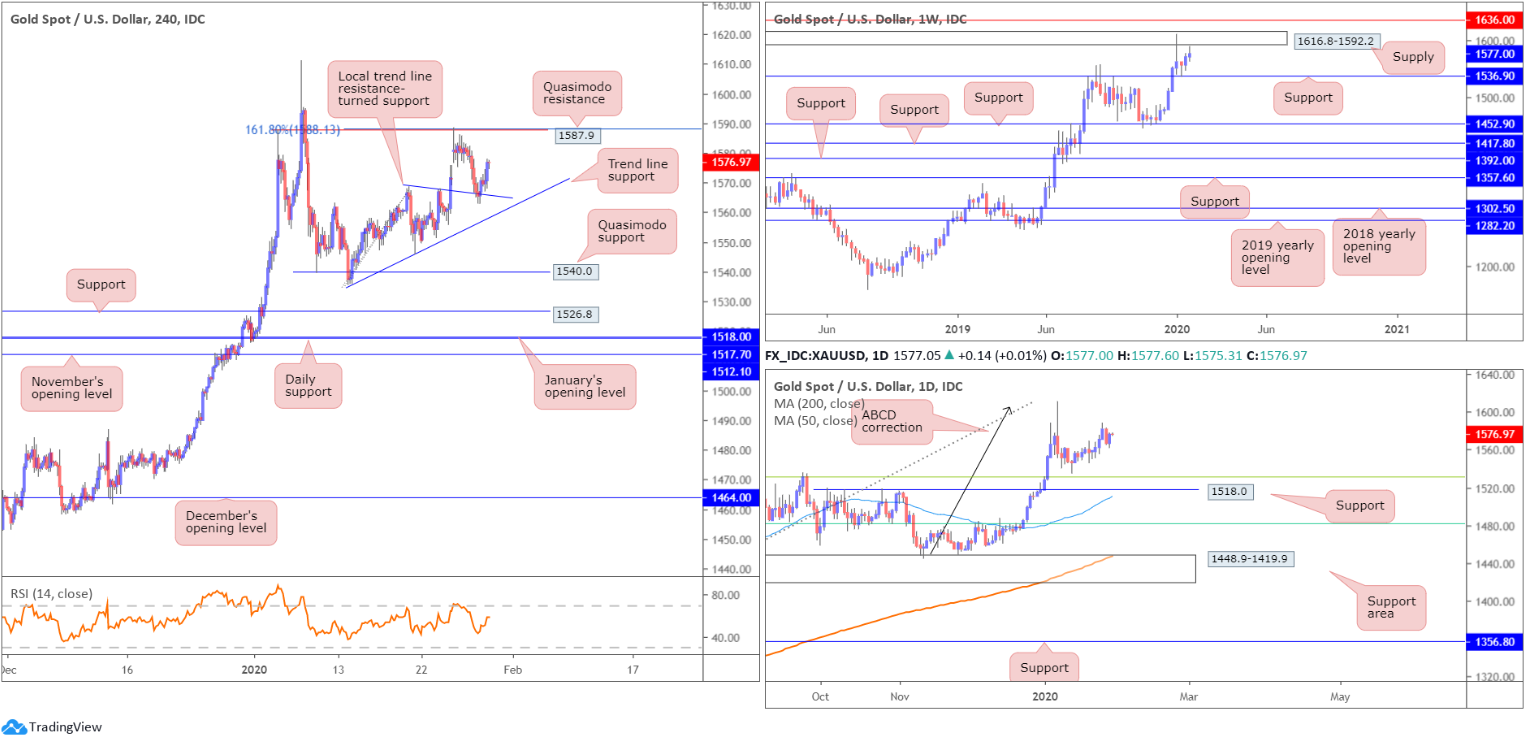
XAU/USD managed to pare most of Tuesday’s losses Wednesday, adding more than $9, or 0.63%. Short-term technical action reveals a local H4 trend line resistance-turned support, taken from the high 1568.6, helped boost price higher yesterday, repositioning H4 Quasimodo resistance at 1587.9 back in the spotlight, along with the 161.8% Fibonacci extension at 1188.1. Additional levels of interest on the H4 rest in the form of a trend line support, extended from the low 1535.7, with a break of this level underscoring a Quasimodo support level at 1540.0.
According to the daily chart, price action turned higher just ahead of the 38.2% Fibonacci retracement at 1530.9, closely followed by 1518.0. The former offers an initial take-profit target for traders short the ABCD bearish correction (black arrows) at 1608.0.
Supply at 1616.8-1592.2, sited just north of the H4 Quasimodo resistance mentioned above at 1587.9, remains a point of interest on the weekly timeframe, as does resistance plotted at 1636.6 and support priced in at 1536.9.
Areas of consideration:
Potential shorts may emerge once more off H4 Quasimodo resistance at 1587.9, in the event of a retest, though traders are urged to pencil in the possibility of a fakeout to the underside of the weekly supply (1592.2), before turning lower. It may, therefore, be an idea to consider waiting for additional candlestick confirmation, such as a shooting star pattern or an engulfing formation, before committing (entry and risk levels can be defined according to this structure). As of current price, the only support target is the noted (local) H4 trend line support.
The accuracy, completeness and timeliness of the information contained on this site cannot be guaranteed. IC Markets does not warranty, guarantee or make any representations, or assume any liability regarding financial results based on the use of the information in the site.
News, views, opinions, recommendations and other information obtained from sources outside of www.icmarkets.com.au, used in this site are believed to be reliable, but we cannot guarantee their accuracy or completeness. All such information is subject to change at any time without notice. IC Markets assumes no responsibility for the content of any linked site.
The fact that such links may exist does not indicate approval or endorsement of any material contained on any linked site. IC Markets is not liable for any harm caused by the transmission, through accessing the services or information on this site, of a computer virus, or other computer code or programming device that might be used to access, delete, damage, disable, disrupt or otherwise impede in any manner, the operation of the site or of any user’s software, hardware, data or property.


