
Key risk events today:
China Manufacturing PMI and Non-Manufacturing PMI; New Zealand ANZ Business Confidence; French Flash GDP q/q; German Retail Sales m/m; Spanish Flash GDP q/q; EUR Prelim Flash GDP q/q; ECB Main Refinancing Rate, Monetary Policy Statement and Press Conference; Canada GDP m/m; US Unemployment Claims; US Personal Spending m/m; Chicago PMI.
(Previous analysis as well as outside sources – italics).
EUR/USD:
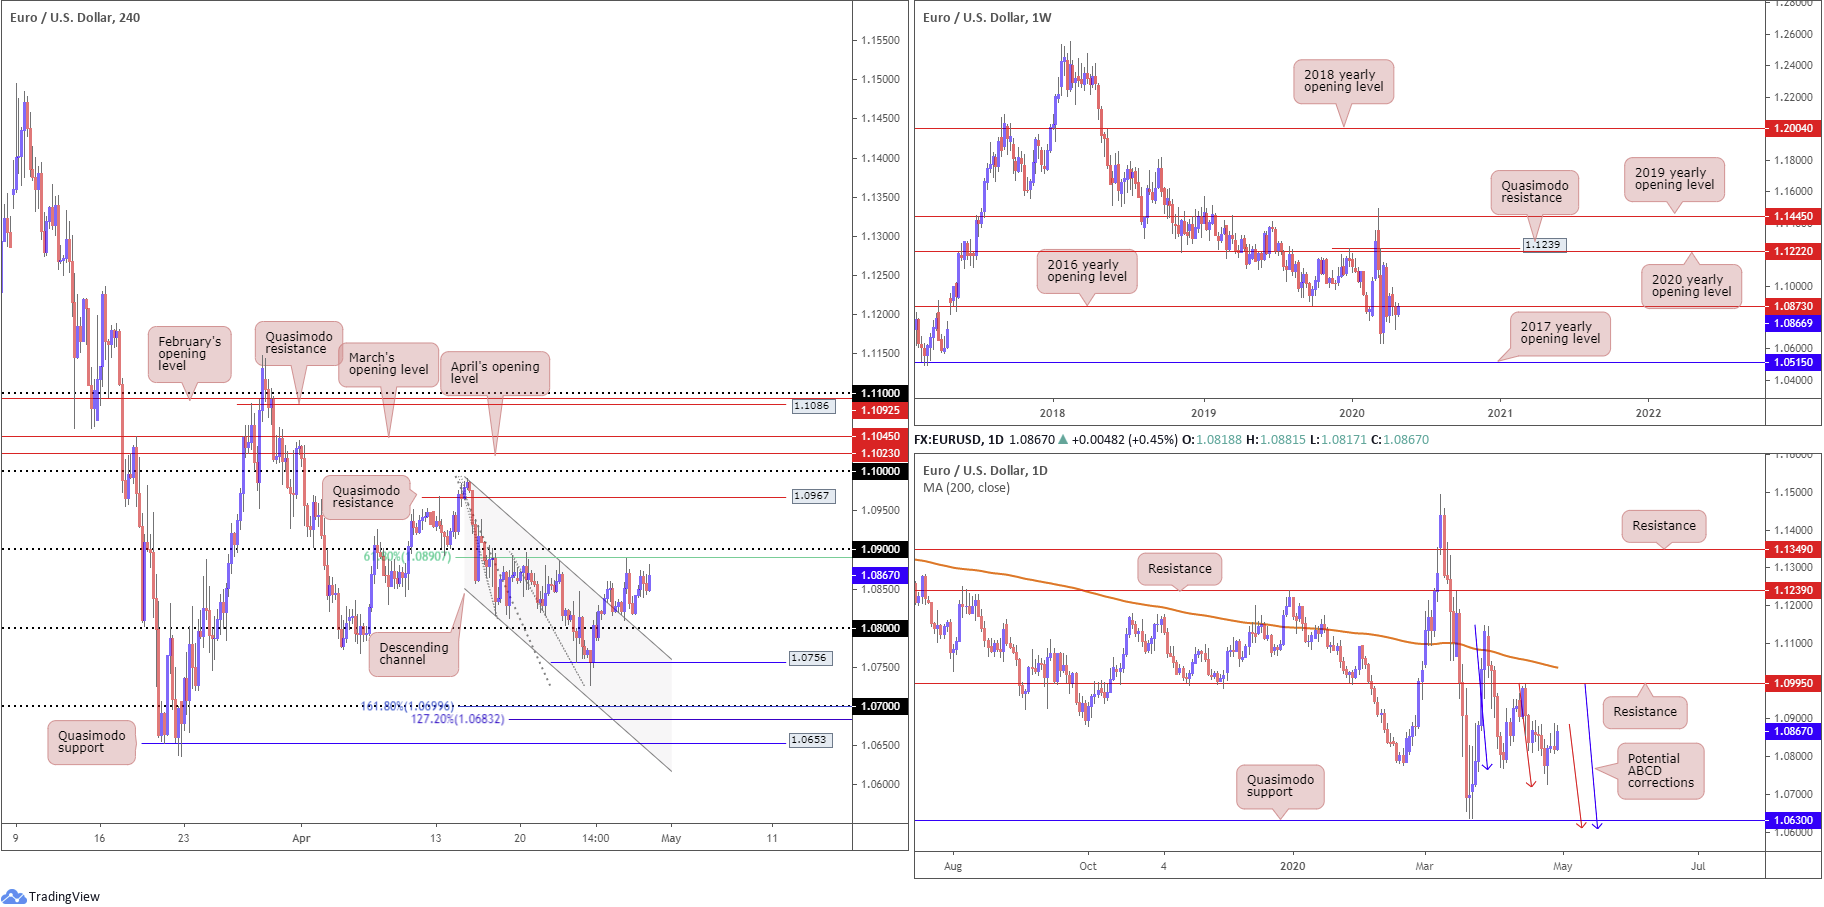
Leaving the 1.08 handle and intersecting H4 channel resistance-turned support, taken from the high 1.0990, unopposed, EUR/USD bulls entered a moderately offensive phase Wednesday. The 1.09 handle potentially holds some weight as a resistance, owing to its close connection with a 61.8% Fibonacci retracement at 1.0890.
Overthrowing 1.08, on the other hand, may bring light to Quasimodo support at 1.0756, with follow-through moves potentially setting the stage for a run to 1.07, which merges closely with a 161.8% Fibonacci extension at 1.0699 and a 127.2% Fibonacci extension at 1.0683.
Interestingly, technical research based on the weekly timeframe has price action toying with the underside of the 2016 yearly opening level at 1.0873. A response from this angle could lead to multi-year lows at 1.0635 making an appearance, with additional moves shining the spotlight on the 2017 yearly opening level at 1.0515. The daily timeframe, despite the recent advance, still demonstrates the possibility of further downside, targeting Quasimodo support at 1.0630, closely followed by two potential ABCD corrections (blue/red arrows) at 1.0597ish. Continued bidding, however, has resistance to target at 1.0995.
Areas of consideration:
In view of weekly price hugging the 2016 yearly opening level at 1.0873 as resistance, 1.09 and the H4 61.8% Fibonacci retracement at 1.0890 could provide strong resistance today. Whipsaws are common around psychological levels; therefore, conservative traders may wait for additional confirmation before taking action.
A break of 1.09, nevertheless, is likely to be interpreted as a bullish indicator, with H4 Quasimodo resistance at 1.0967 serving as an initial target.
GBP/USD:
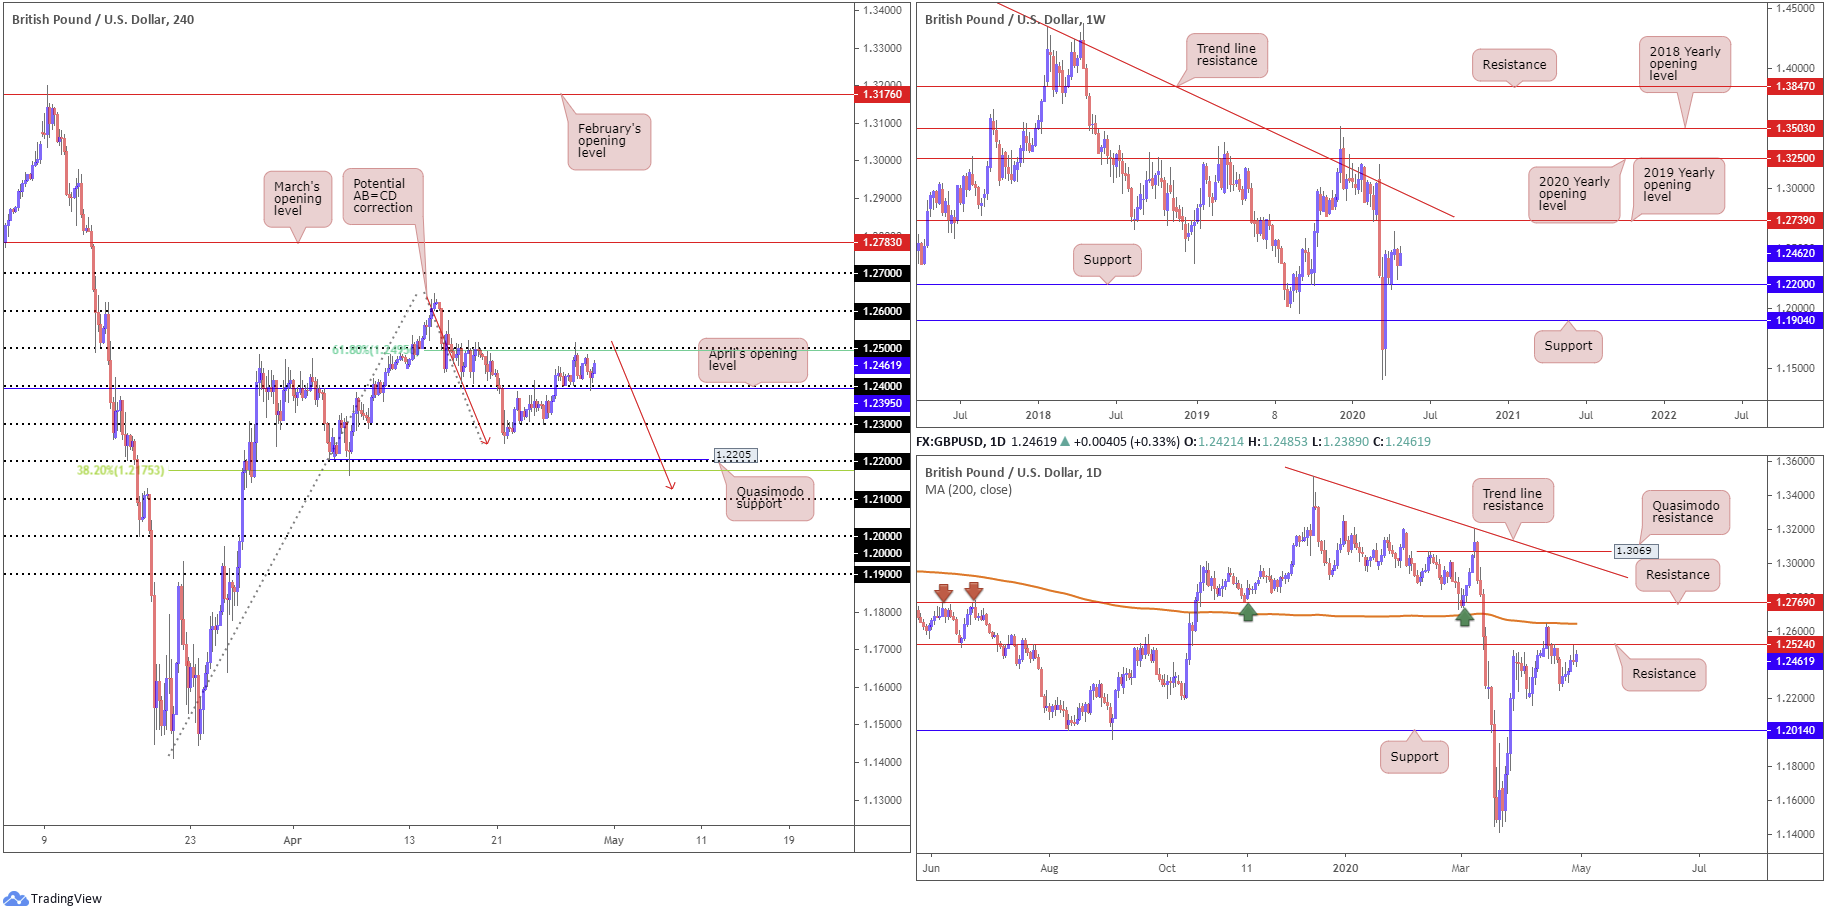
As markets transitioned into US trading Wednesday, GBP/USD reversed a dip sub 1.24 (and April’s opening level at 1.2395) and has, as of current price, sited the pair within striking distance of 1.25 and the 61.8% Fibonacci retracement ratio at 1.2495. Breaking 1.25, although traditionally interpreted as a bullish indicator, could find moves hindered at daily resistance from 1.2524.
Dipping a toe beneath 1.24 could also be interesting. Continued downside from here may eventually form the D-leg to an AB=CD bullish correction (red arrows), which, as of current structure, terminates around the 1.2123ish neighbourhood.
Meanwhile, on the bigger picture, the weekly timeframe has support plotted at 1.2200. Elbowing through the 1.2647 April 14 high, nevertheless, could land the candles within striking distance of the 2019 yearly opening level at 1.2739, with a break exposing a long-standing trend line resistance, taken from the high 1.5930.
Over on the daily timeframe, yesterday’s candle has sited price action within close proximity of resistance at 1.2524. Remember, support/resistance levels are often viewed as zones rather than definitive price points. Also worth highlighting is a possible head and shoulder’s top should we hold the said resistance and navigate lower levels.
Areas of consideration:
A fakeout through 1.25, one that tests daily resistance at 1.2524 and prints a H4 close sub 1.25, could be of interest for sellers today, targeting 1.24.
The daily head and shoulder’s top would likely become a feature following a H4 close south of 1.23 on the H4 scale, breaking the pattern’s neckline (not yet applied to the chart).
AUD/USD:
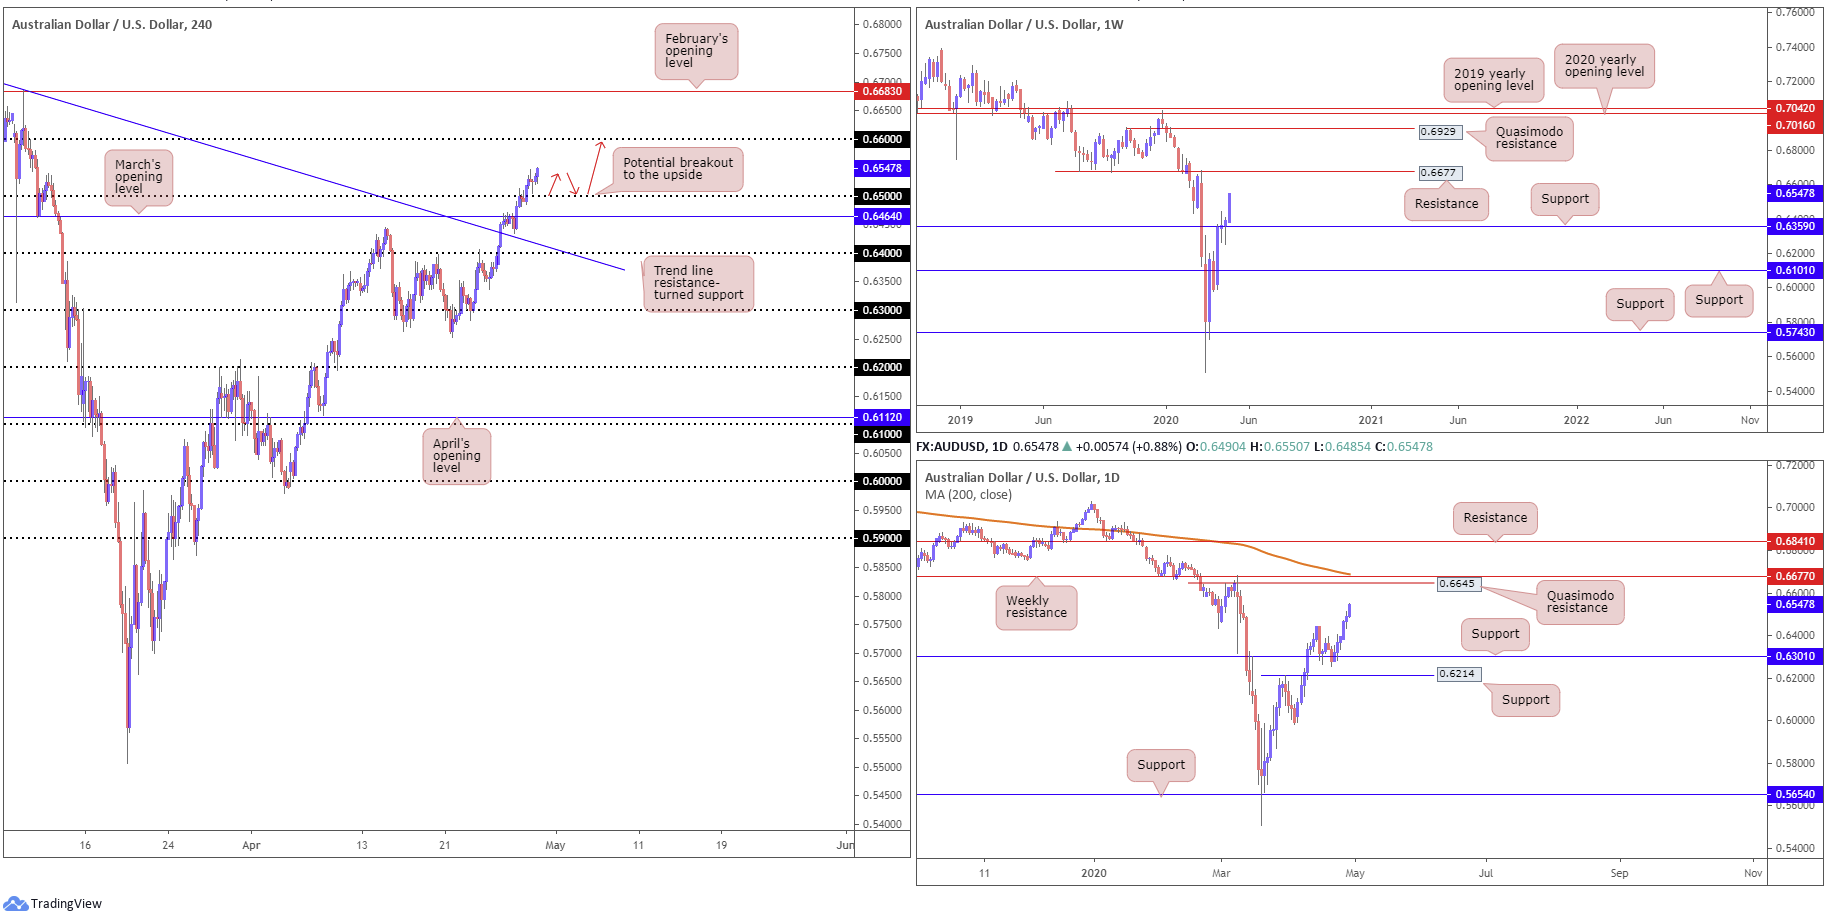
Up 2.30% so far this week, the Australian dollar continued to extend recovery gains against the buck Wednesday, adding 50 points, or 0.77%. Technical movement on the H4 timeframe saw 0.65 give way, filling buy stops from those attempting to fade the round number and also those looking to trade the breakout higher. As of yet, a retest at 0.65 has not materialised (there was a minor retest seen on the M15 timeframe however). Recent movement potentially paves the way north to 0.66.
Weekly support is seen at 0.6359 and remains a dominant fixture in this market, with scope to approach resistance based at 0.6677. Similarly, daily action remains on firm footing north of support at 0.6301, also displaying room to navigate higher ground to at least Quasimodo resistance at 0.6645, parked just ahead of the weekly resistance level mentioned above at 0.6677 and the 200-day SMA (orange – 0.6688).
Areas of consideration:
For those who read Wednesday’s technical briefing you may recall the following piece (italics):
Having identified clear-cut higher-timeframe support in play, with room to climb, selling the 0.65 handle on the H4 timeframe may understandably unnerve some traders. While a H4 close above 0.65 is expected, traders are still urged to pencil in the possibility of a retest forming at March’s opening level from 0.6464 before buyers step in.
With 0.65 out of the picture as resistance, breakout buyers may already be long this market. However, conservative traders are still likely sitting on their hands waiting for a retest that may never come (unless of course you drilled down to the lower timeframes and caught the M15 move). As highlighted above, 0.66 is set as the next upside target.
USD/JPY:
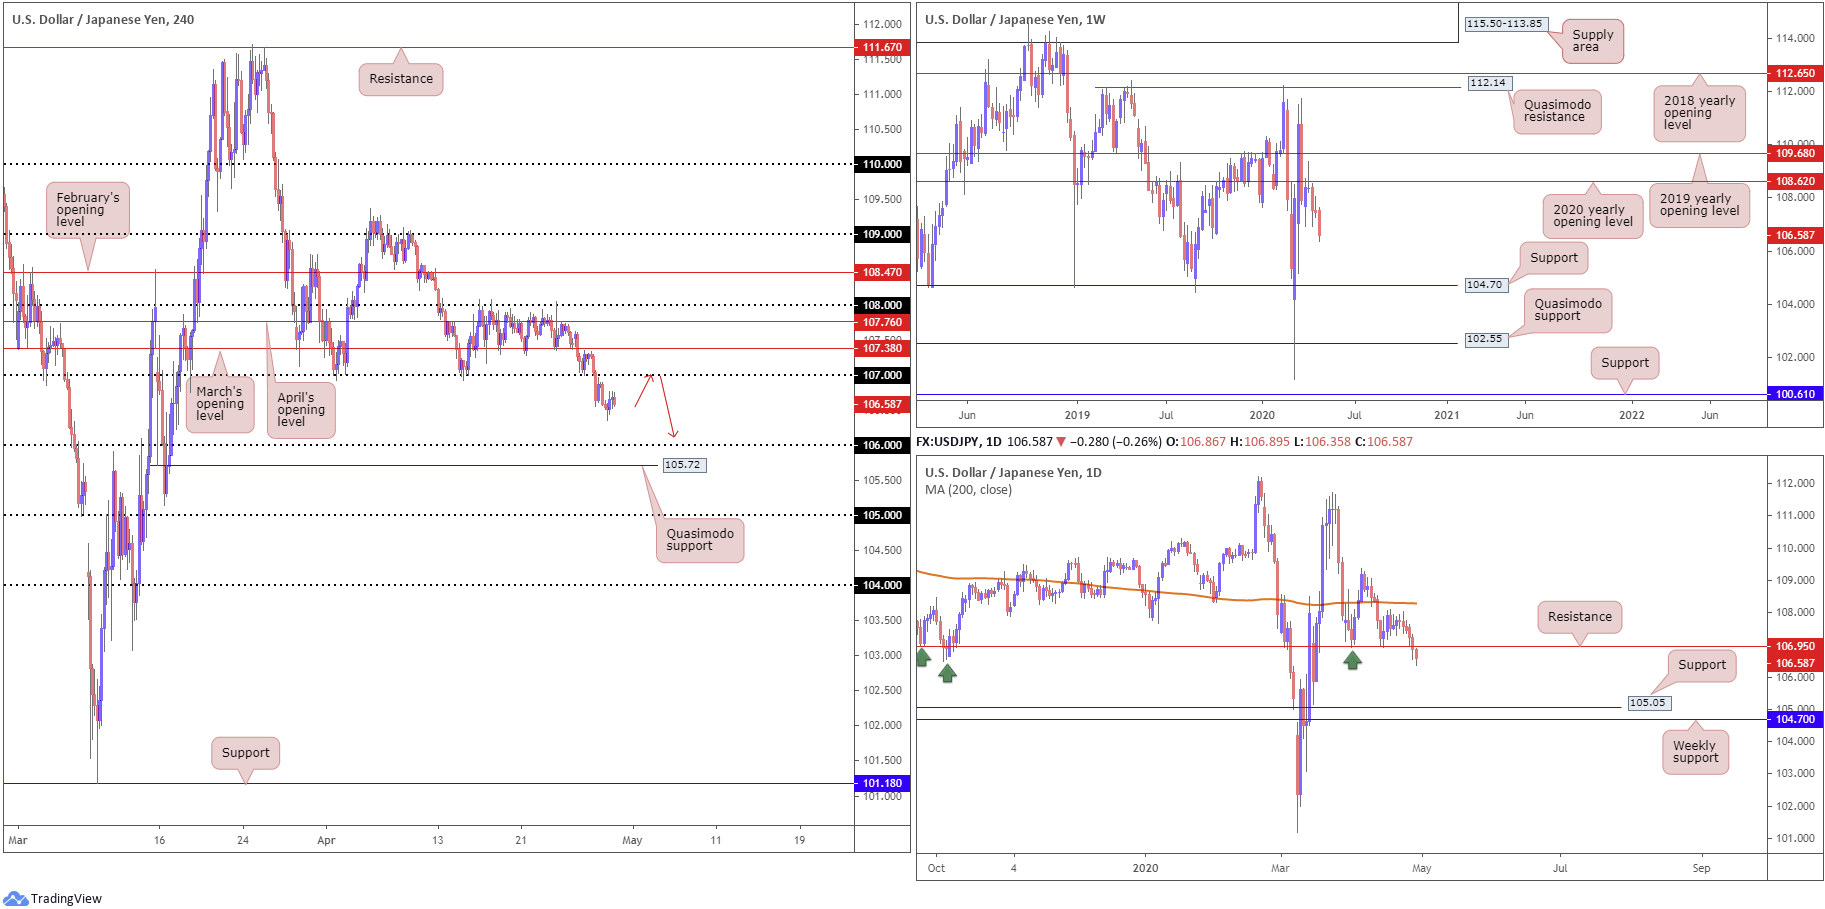
The US dollar spun off into another wave of selling against the Japanese yen Wednesday, registering its sixth consecutive daily loss.
After overwhelming orders at 107 Tuesday, Wednesday extended ground beneath the said round number and further cleared the river south to 106 and a nearby Quasimodo support at 105.72. However, we cannot rule out the possibility of fresh upside attempts towards 107.
Daily support at 106.95, a level that was noted as perhaps a fragile base, ceded ground in recent movement. South of 106.95 could see an approach form to support at 105.05.
In terms of the weekly timeframe, nevertheless, the chart continues to emphasise a bearish tone. Price action recently produced a clear-cut shooting star candlestick configuration off the 2020 yearly opening level at 108.62, with a strong follow-through move to the downside to lows of 106.92 seen thereafter. This week, as you can see, is extending space sub 108.62, with support not expected to emerge until reaching 104.70.
Areas of consideration:
Room to explore lower ground on the weekly chart, along with daily price recently dipping through support at 106.95, underscores a bearish theme in this market right now.
A retest at the underside of 107 on the H4 timeframe, therefore, may offer sellers a platform to drive lower today. Downside targets from 107 fall in at 106 and then H4 Quasimodo support at 105.72.
USD/CAD:
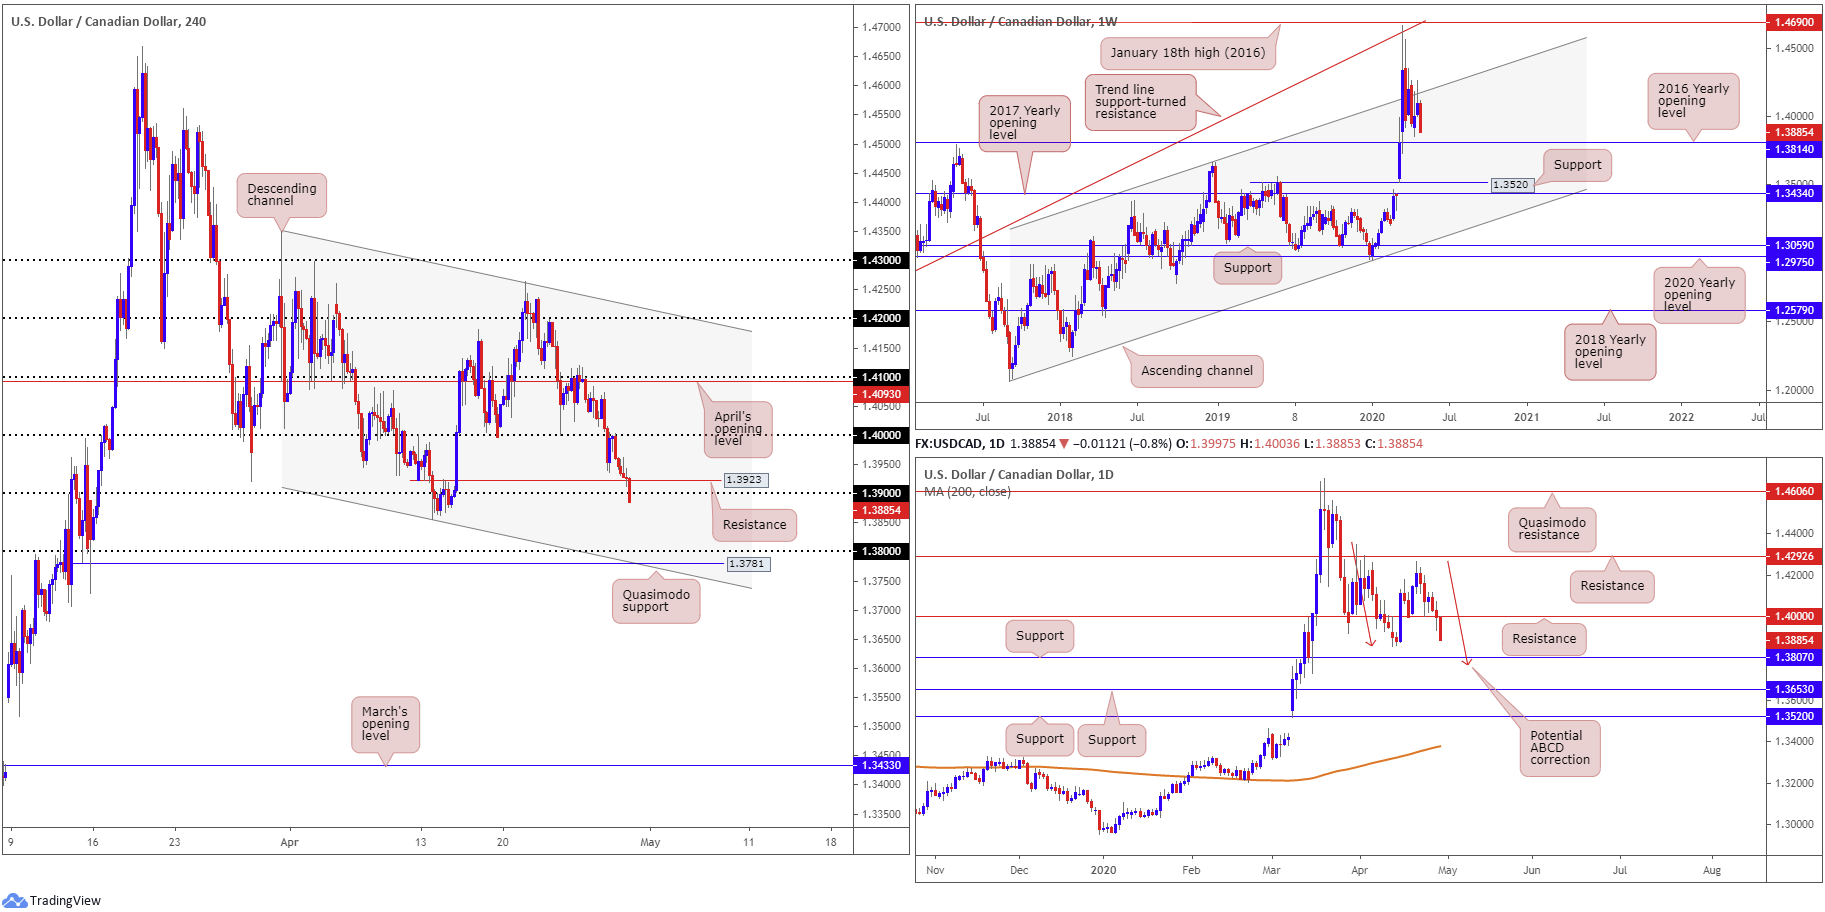
In recent hours we have seen USD/CAD engage with the 1.39 handle after overthrowing H4 Quasimodo support coming in from 1.3923. The pair lost more than 100 points Wednesday, weighed by rising oil prices and broad-based USD selling.
From the H4 timeframe, south of 1.39, aside from the 1.3855 April 13 low, support is unlikely to emerge until shaking hands with the 1.38 handle, located close by channel support, taken from the low 1.3855, and Quasimodo support at 1.3781.
Elsewhere, on the weekly timeframe longer-term traders will note the unit recently crossed swords with channel resistance, extended from the high 1.3661. The retest, shaped by way of a shooting star candlestick pattern, along with recent downside, has placed price action within reasonably close proximity to 1.3814, the 2016 yearly opening level. From the daily timeframe, support at 1.4000 was recently overrun (now a serving resistance level), shifting the spotlight to support coming in at 1.3807.
Areas of consideration:
With all three timeframes potentially clear of support right now, assuming a H4 close south of 1.39, additional selling might be in the offing. Some breakout traders will be looking to enter long at the close of the current H4 candle, with protective stop-loss orders tucked above resistance at 1.3923; others may feel a retest at 1.39 may be the safer approach.
As for downside targets from 1.39, weekly support enters the mix at 1.3814 (2016 yearly opening level), followed by daily support priced in at 1.3807 and then 1.38, as well as H4 Quasimodo support at 1.3781.
USD/CHF:
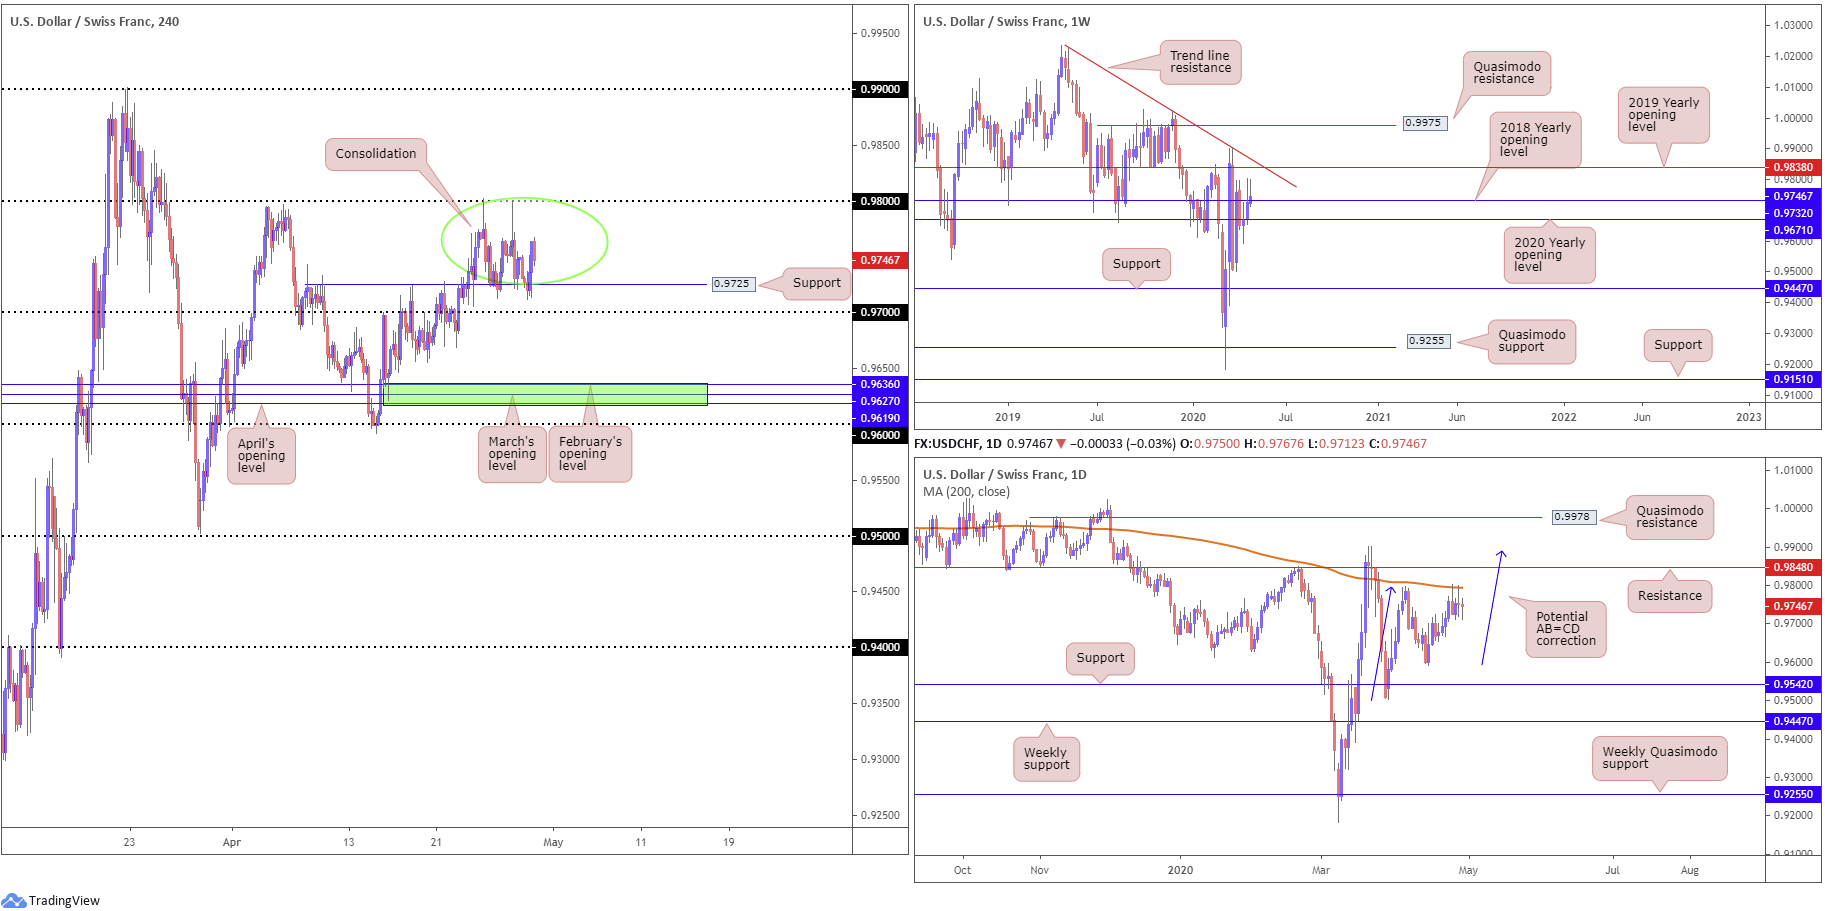
Once again, intraday flow found support off 0.9725 on the H4 timeframe on Wednesday. USD/CHF managed to reverse an early slide from lows at 0.9712 and wrap up the day around the top of its daily trading range. Since last Friday, we have seen the H4 candles carve out a range between the said support and the 0.98 handle. Outside of the range walls, traders are urged to note 0.97 and 0.99.
Meanwhile, on the weekly timeframe, current action is attempting to make headway above the 2018 yearly opening level at 0.9732. The move higher has unmasked the 2019 yearly opening level at 0.9838 and trend line resistance, taken from the high 1.0226, but is struggling to reach the said levels.
Price action on the daily timeframe, however, shows Tuesday launched itself into the 200-day SMA (orange – 0.9794) in the same manner as Friday. Wednesday, as can be clearly seen from the daily timeframe, ended pretty much unmoved, albeit forming a buying tail. Despite the recent rejection off the 200-day SMA, resistance at 0.9848 and a potential AB=CD correction (blue arrows) at 0.9886 are visible in case of moves higher. Lower on the curve, aside from the 0.9592 April 15 low, we have support priced in at 0.9542, situated just ahead of weekly support at 0.9447.
Areas of consideration:
The upper boundary of the current H4 range (0.98) is bolstered by the 200-day SMA, therefore additional tests of the round number could interest sellers.
A fakeout through the lower boundary of the current H4 range (0.9725), on the other hand, will see price action welcome 0.97. This offers a potential fakeout scenario, with sell-stops up for grabs beneath 0.9725.
Clearing 0.97 is another scenario worth taking into account. This could unlock the door for bearish scenarios; beneath this base we see limited demand until reaching 0.9619/0.9636 (green), an area made up of April, March and February’s opening levels.
Dow Jones Industrial Average:
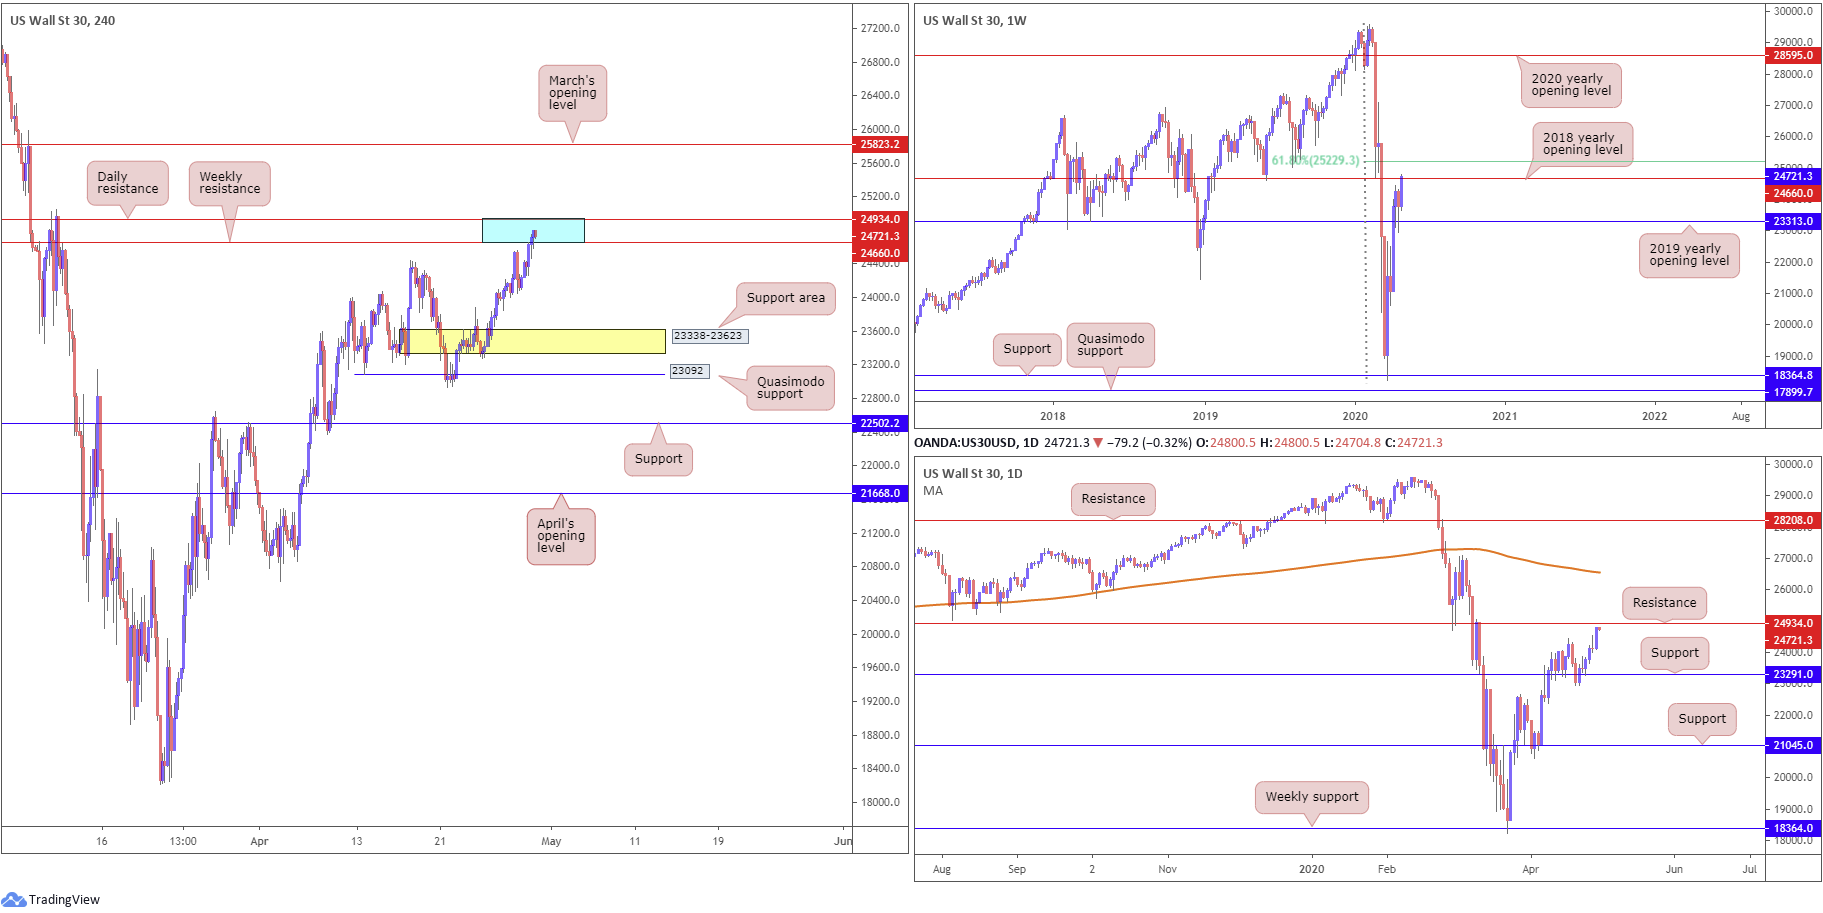
Global equities finished higher across the board Wednesday as investors digested the potential for a coronavirus treatment from Gilead Sciences. The Dow Jones Industrial Average added 532.31 points, or 2.21%; the S&P 500 gained 76.12 points, or 2.66%, and the tech-heavy Nasdaq 100 concluded higher by 305.16 points, or 3.52%.
Technical action observed H4 candles drive into a potential resistance area, made up of daily resistance coming in at 24934 and weekly resistance from 24660 (blue). Breaking through this zone sets the stage for an approach to the 61.8% Fibonacci retracement ratio at 25229 on the weekly timeframe, followed by March’s opening level at 25823 on the H4 scale.
Downside from 24934/24660 could have H4 price drive as far south as a support area (yellow) at 23338-23623.
Areas of consideration:
Technical traders, particularly price action traders, will have eyes on 24934/24660 for signs of selling today. A H4 bearish candlestick pattern formed from this region would likely entice sellers into the market. Not only does this help identify seller intent, it also provides a structure to base entry/risk levels from.
Breakout buying, in the event we push through 24934/24660, has the 61.8% Fibonacci retracement ratio at 25229 on the weekly timeframe to target.
XAU/USD (GOLD):
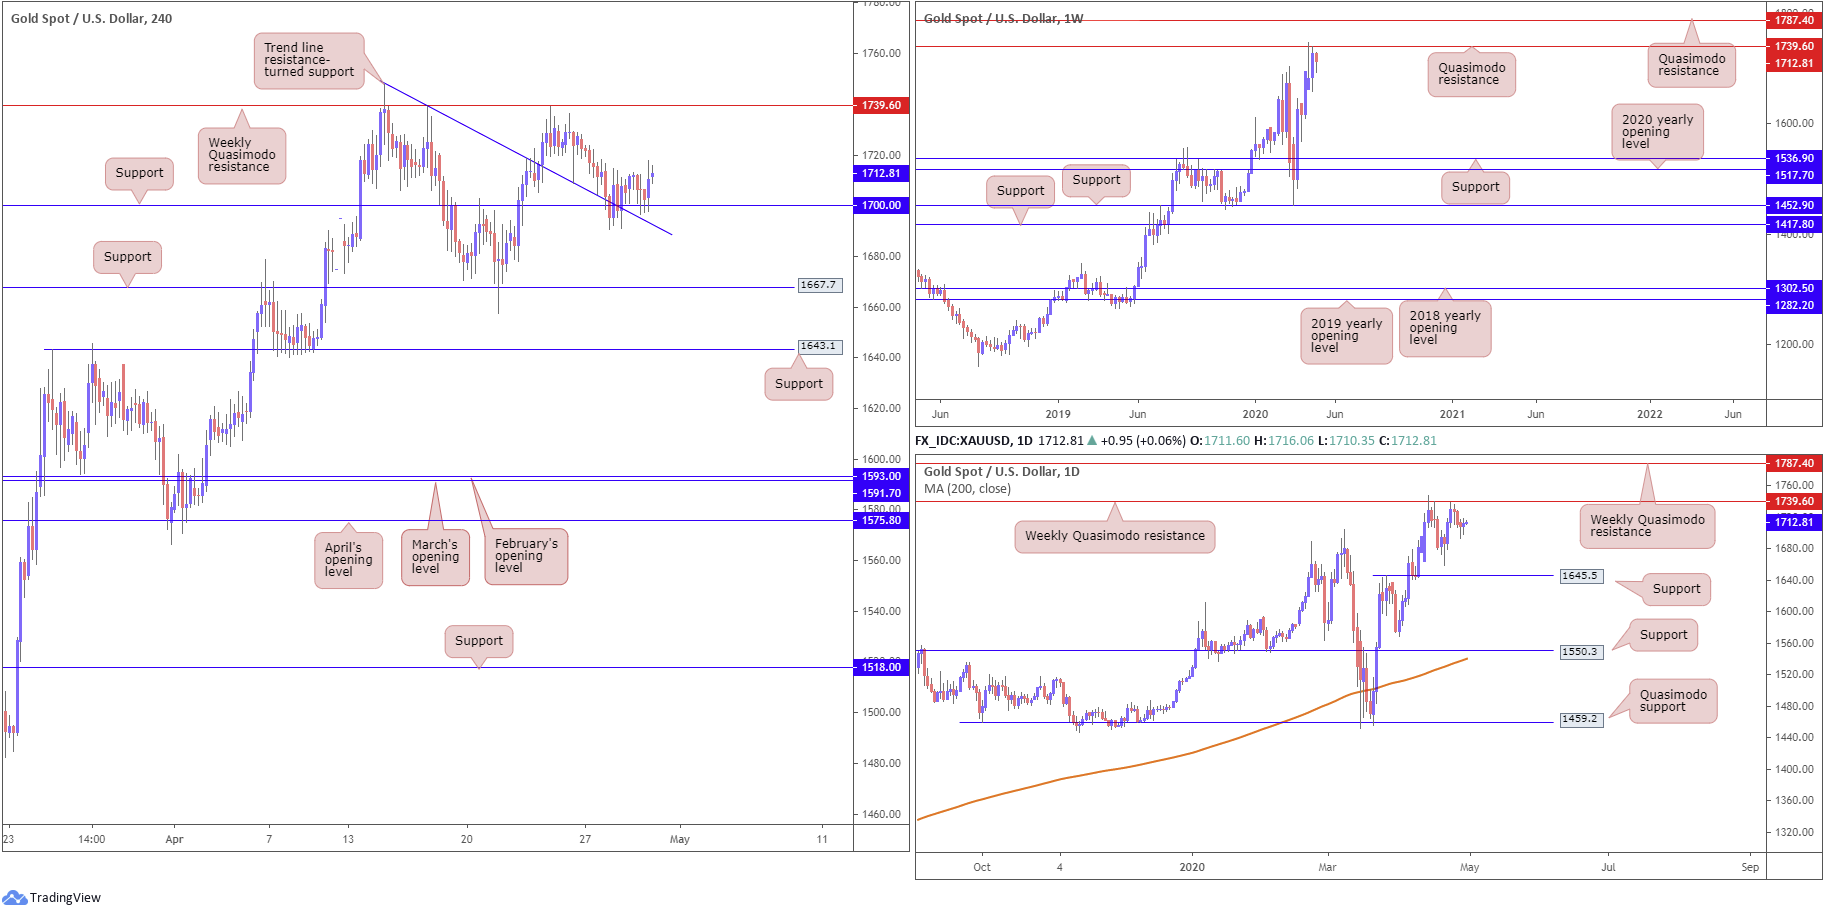
Wednesday concluded in much the same way as Tuesday: relatively unchanged.
In recent sessions, XAU/USD boarded support on the H4 timeframe at 1700.0, which joins closely with a trend line resistance-turned support, taken from the high 1747.7. Any upside off the said support has so far been capped by 1712.00. As of current price action, however, buyers do appear to have the upper hand.
Should buyers continue to bid gold higher today and reconnect with weekly Quasimodo resistance at 1739.6, this could spell trouble for longer-term countertrend traders short the weekly base. Unable to break a H4 support after fading a weekly level generally indicates delicate sellers.
Should price conquer the said weekly Quasimodo, focus will rest on another layer of weekly Quasimodo resistance coming in at 1787.4.
Areas of consideration:
With H4 support at 1700.0 recently coming under fire and withstanding multiple downside attempts, it will be interesting to see if buyers can overpower sellers here and revisit the weekly Quasimodo resistance at 1739.6.
Should this come to fruition, selling from the said Quasimodo may unsettle some traders, knowing the previous reaction failed to dethrone H4 support. Therefore, a break above 1739.6 may materialise, unlocking the trapdoor for breakout buyers to weekly Quasimodo resistance highlighted above at 1787.4.
The accuracy, completeness and timeliness of the information contained on this site cannot be guaranteed. IC Markets does not warranty, guarantee or make any representations, or assume any liability regarding financial results based on the use of the information in the site.
News, views, opinions, recommendations and other information obtained from sources outside of www.icmarkets.com.au, used in this site are believed to be reliable, but we cannot guarantee their accuracy or completeness. All such information is subject to change at any time without notice. IC Markets assumes no responsibility for the content of any linked site.
The fact that such links may exist does not indicate approval or endorsement of any material contained on any linked site. IC Markets is not liable for any harm caused by the transmission, through accessing the services or information on this site, of a computer virus, or other computer code or programming device that might be used to access, delete, damage, disable, disrupt or otherwise impede in any manner, the operation of the site or of any user’s software, hardware, data or property.


