
EUR/USD:
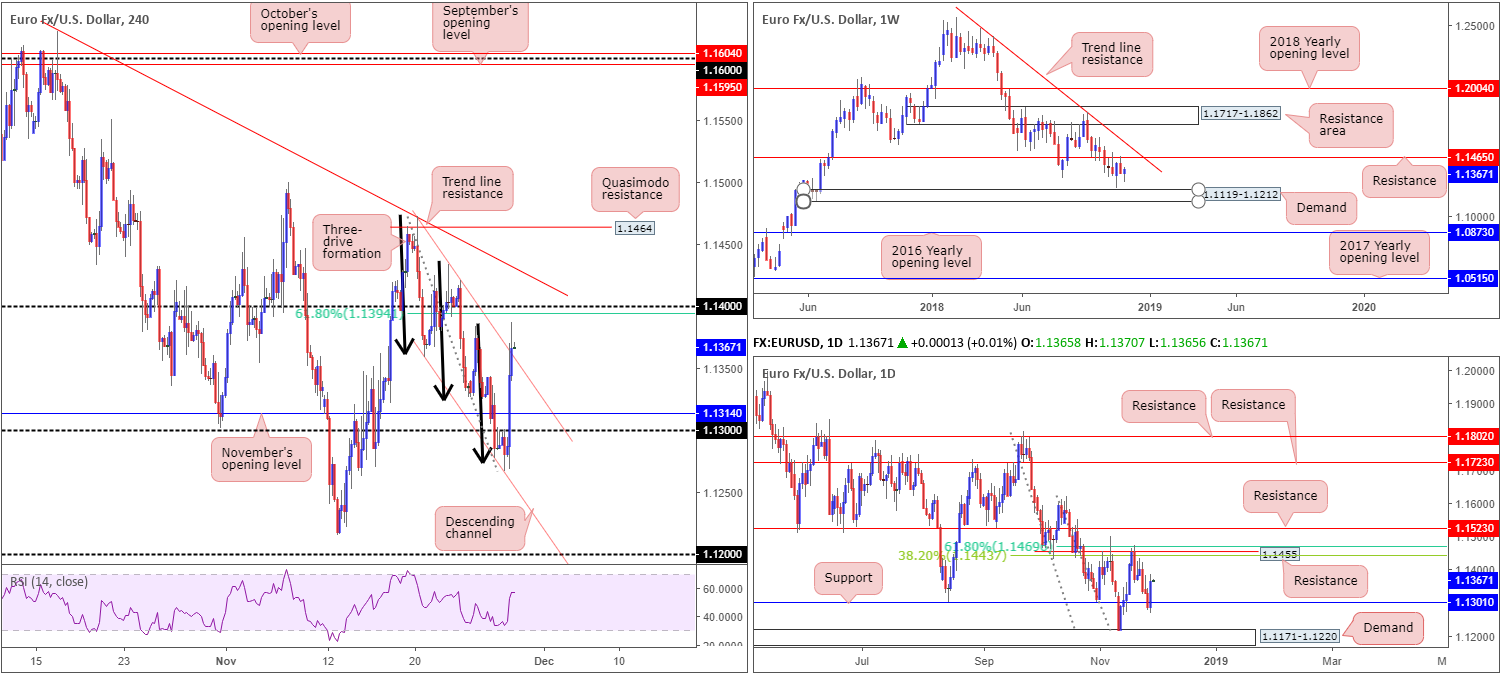
Breaking a three-day bearish phase, the EUR/USD recovered in strong fashion Wednesday, following comments by Fed Chair Powell. He stated interest rates are just below the broad range of estimates of the neutral rate (which is estimated at between 2.50% and 3.50%), and the Fed was not on a pre-set policy course.
Despite a brief flicker of activity under 1.13, the H4 candles established strong support off a ‘completed’ three-drive bullish pattern (black arrows) that merged with channel support (etched from the low 1.1358). Price swiftly reclaimed 1.13+ status, reaching highs of 1.1387 and shaking hands with channel resistance (taken from the high 1.1472) into the close.
Assessing the higher-timeframe picture immediately brings a daily bullish engulfing pattern into the spotlight off daily support priced in at 1.1301. Further upside from this point could lead to a test of daily resistance at 1.1455, which has two Fibonacci resistances sited close by: a 61.8% and a 38.2% at 1.1469 and 1.1443, respectively. The other key thing to note here is weekly resistance plotted at 1.1465.
Areas of consideration:
In light of both weekly and daily timeframes displaying room to extend higher, along with the H4 candles violently whipsawing through the noted channel resistance (stop-loss orders likely tripped), the 1.14 handle is likely to be challenged today.
1.14 may prompt selling given it is closely associated with a 61.8% H4 Fibonacci value at 1.1394, though the concern, once again, is the higher-timeframe picture showing scope for a move beyond this number towards 1.1450s.
Ultimately, the research team have pinned a H4 Quasimodo resistance level at 1.1464 as a higher-probability selling zone, largely due to its connection with the aforementioned higher-timeframe resistances. The level may not come into play today, though may be of use Friday/early next week.
Today’s data points: German Prelim CPI m/m; ECB President Draghi Speaks; US Core PCE Price Index m/m; US Personal Spending m/m; FOMC Meeting Minutes.
GBP/USD:
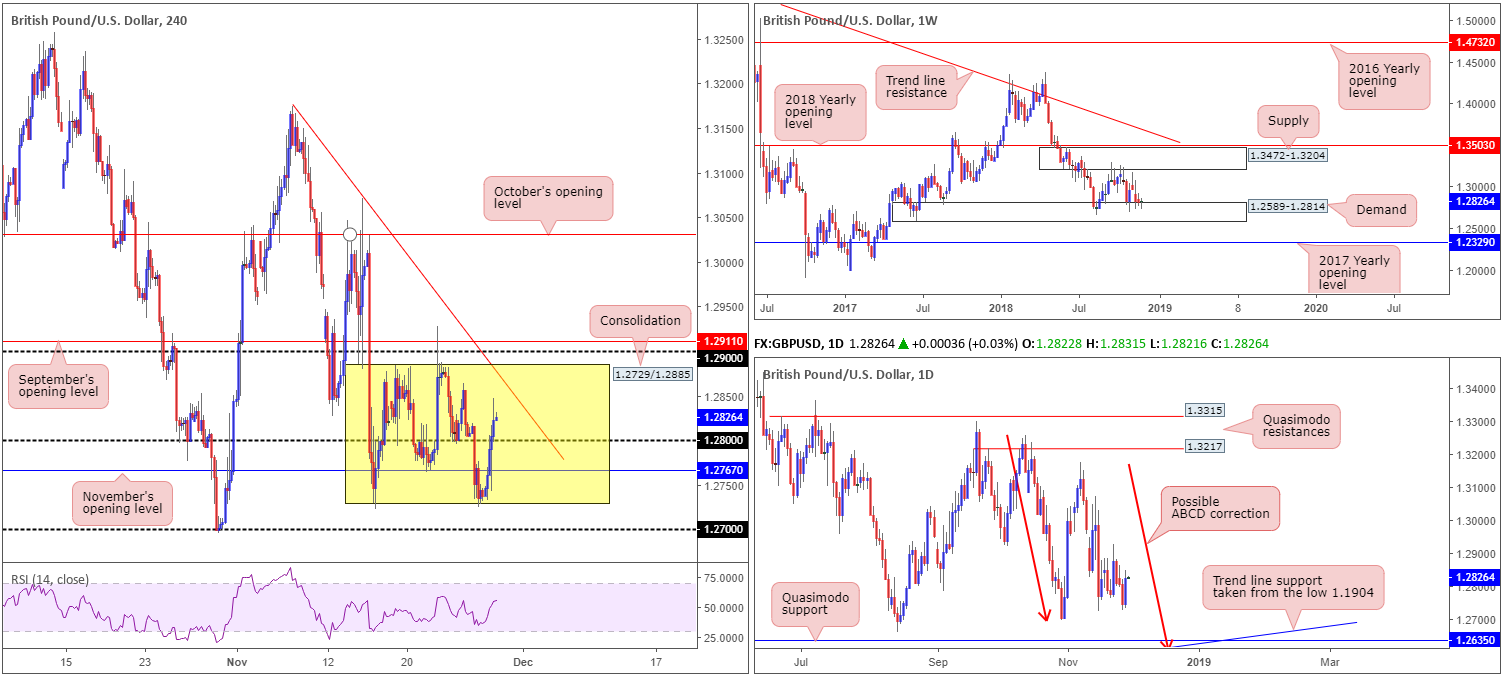
The Brexit saga took a back seat Wednesday after Fed Chair Powell stepped up and stated interest rates are just below the estimate of the neutral rate (estimated at between 2.50% and 3.50%). This, as you can see, provided fresh impetus to the GBP/USD, with the H4 candles reclaiming 1.28 and clocking highs of 1.2847. Overhead, trend line resistance (extended from the high 1.3174) appears to be the next upside target in view, followed closely by 1.29 and September’s opening level plotted at 1.2911. Traders may also want to acknowledge cable is currently caught within a range between 1.2729/1.2885 (yellow).
Despite recent buying, the higher-timeframe structure remains unchanged. Here’s a snippet from Wednesday’s briefing:
Weekly price is seen engaging with demand at 1.2589-1.2814, though as of yet has failed to produce anything meaningful to the upside. Price action on the daily timeframe, however, suggests the pair might want to explore lower ground within the walls of the said weekly demand area. The candles, as you can see, are hovering north of the 1.2695 Oct 30 low. While a response from this neighbourhood is possible, the Quasimodo support seen at 1.2635 remains a far more appealing level. Aside from 1.2635 fusing with trend line support (taken from the low 1.1904), the approach, should we push for lower levels, will form by way of an ABCD bullish pattern (red arrows) terminating just south at 1.2614.
Areas of consideration:
Intraday, a retest of 1.28 as support could be something to keep an eyeball on today, targeting the trend line resistance highlighted above (red arrows) as an initial take-profit zone, followed then by a possible range completion towards 1.2885. Waiting for lower-timeframe confirming candle action prior to pulling the trigger is advised (entry/stop parameters can be defined according to this configuration), since round numbers are prone to fakeouts.
Longer term, nonetheless, focus remains drawn towards the daily Quasimodo support at 1.2635 for potential longs. The fact this level is positioned within the current weekly demand, and fuses with an ABCD correction point as well as a trend line support, marks a reasonably strong buy zone for future use.
Today’s data points: UK Net Lending to Individuals m/m; US Core PCE Price Index m/m; US Personal Spending m/m; FOMC Meeting Minutes.
AUD/USD:
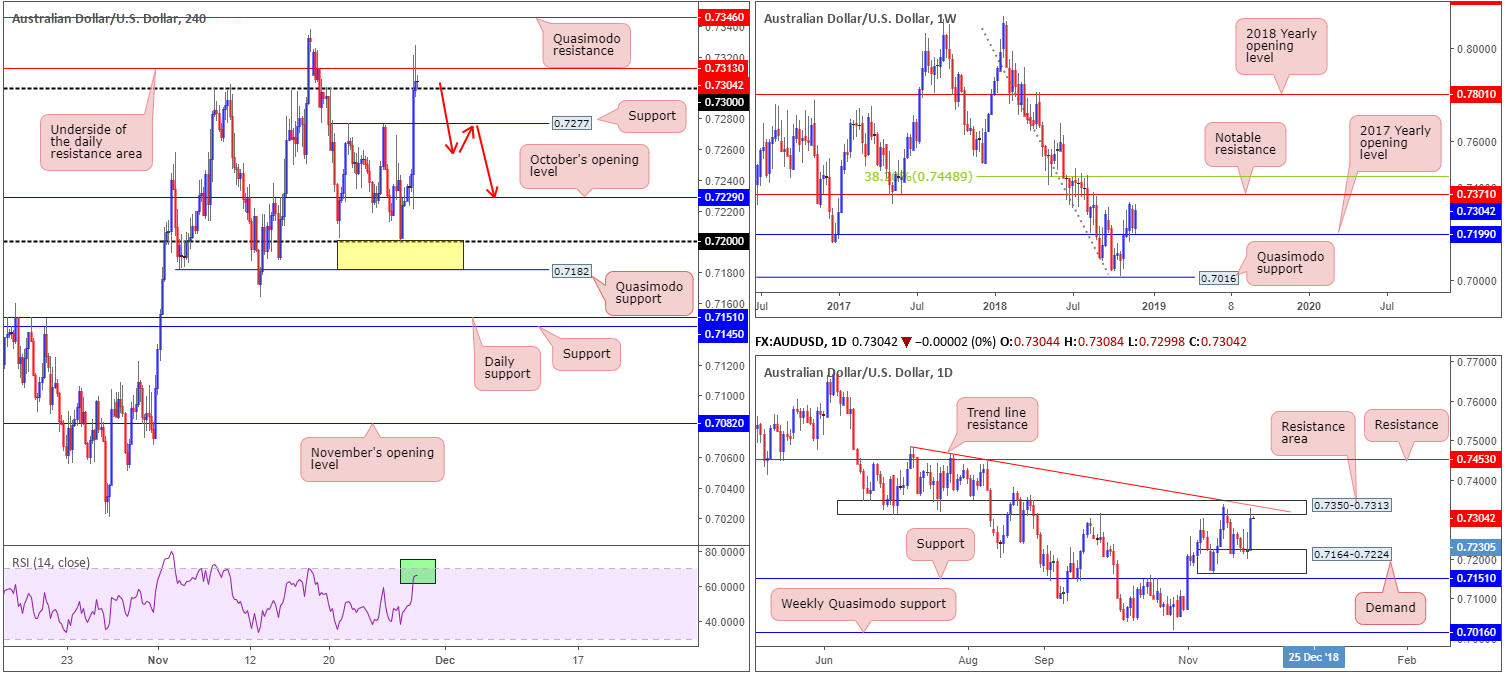
After firmly retesting the top edge of October’s opening level at 0.7229 on the H4 timeframe Wednesday, the Australian dollar strongly advanced against its US counterpart. A more-dovish-than-expected stance on US interest rates out of the Fed sent the US dollar spiraling back under 97.00 and provided fresh impetus to the AUD/USD. In one fell swoop, H4 price ripped through double-top resistance at 0.7277, took out 0.73 and tested highs of 0.7327. It might also be worth penciling in the RSI indicator is seen fast approaching its overbought value (green). Well done to any of our readers who managed to remain long this market from 0.7182/0.72 (yellow). The risk/reward is incredible!
While many market players will now be looking to buy above 0.73, caution is advised. Recent buying brought the market into a daily resistance area at 0.7350-0.7313, which happens to also converge with a nearby trend line resistance (drawn from the high 0.7483). We feel this area, although weekly price shows scope to possibly extend higher towards resistance at 0.7371, is likely to hinder buying.
Areas of consideration:
Should the H4 candles close under 0.73 today, this, according to our technical studies, is a strong sign daily sellers are wanting to take things lower from here. H4 support rests nearby at 0.7277, though with overhead selling pressure from the daily timeframe, we expect this level to be taken out and price head in the direction of October’s opening level at 0.7229 (at this point the market would also be sited just north of daily demand mentioned above at 0.7164-0.7224). To be on the safe side, traders could even wait for the H4 candles to consume 0.7277 and attempt to enter short on any retest of the level as resistance (red arrows – preferably in the shape of a bearish candlestick formation as this will provide entry/stop parameters).
Today’s data points: US Core PCE Price Index m/m; US Personal Spending m/m; FOMC Meeting Minutes.
USD/JPY:
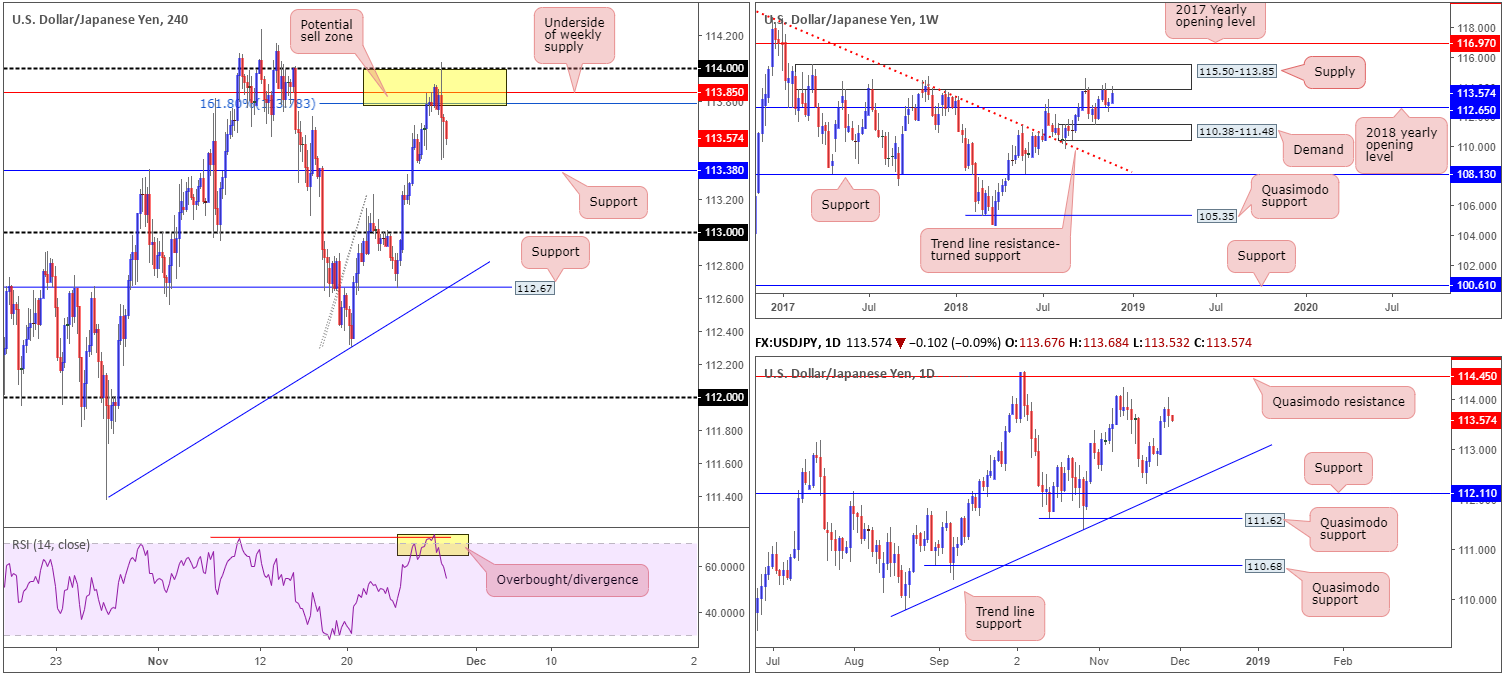
Fed Chair Powell’s comments on policy outlook weighed on the greenback Wednesday, tugging the USD/JPY lower, down 0.10% on the day. For folks who read Wednesday’s briefing you may recall the piece underscored a possible sell zone on the H4 timeframe at 114/113.78 (yellow). The research team selected this area due to a number of closely converging structures: a 161.8% Fibonacci ext. point at 113.78, the 114 handle, the RSI indicator displaying an overbought/divergence reading and the underside of weekly supply at 113.85. As is evident from the chart, price marginally breached the top edge of the sell zone (114) before turning lower. Well done to any of our readers who managed to jump aboard this move.
As of current price, the next downside target visible on the H4 timeframe falls in at 113.38, followed by the 113 handle and then support seen at 112.67 (merges with the next support target on the weekly timeframe at 112.65 [the 2018 yearly opening level]).
Areas of consideration:
Aside from the H4 sell zone already in play at 114/113.78, there’s not really much else to hang our hat on at the moment in terms of high-probability trading zones.
A H4 close beneath support at 113.38 may offer an intraday shorting opportunity on a retest of the level, targeting 113 as an initial port of call, followed by a possible move lower towards 112.67 (as highlighted above). However, traders are urged to only consider this a viable trade if risk/reward considerations provide at least a 1:1 ratio towards 113 from 113.38. This will allow traders to comfortably reduce risk to breakeven at 113 and even take partial profit.
Today’s data points: US Core PCE Price Index m/m; US Personal Spending m/m; FOMC Meeting Minutes.
USD/CAD:
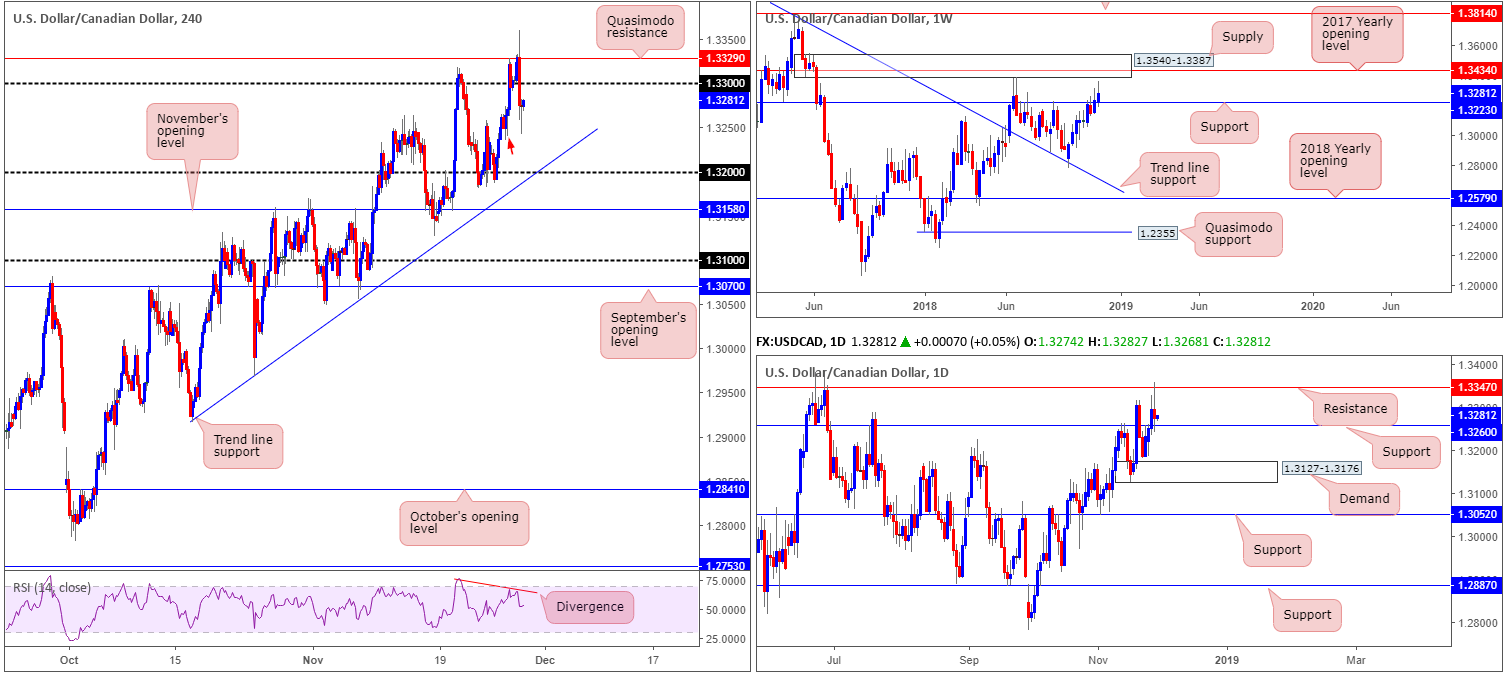
A Powell-led USD selloff took shape amid US trading hours Wednesday, after the Fed Chair stated policy rate is just below neutral estimates. Retreating from a peak of 1.3360, the H4 candles respected Quasimodo resistance at 1.3329 (and daily resistance at 1.3347) and reclaimed 1.33 to the downside. Minor H4 demand marked with a red arrow at 1.3235-1.3264 is being tested, as we write, though the more appealing structure appears around 1.32, which happens to merge with a trend line support (extended from the low 1.2932).
Throwing higher-timeframe structure into the mix, however, changes things. Daily support is visible at 1.3260, which fuses with the top edge of H4 demand mentioned above at 1.3235-1.3264. Adding to this, we can also see weekly support is present at 1.3223, positioned between the current H4 demand and round number 1.32.
Areas of consideration:
In view of our technical reading, overall structure appears restricted at the moment.
To the upside, we have the 1.33 handle and a Quasimodo resistance at 1.3329 on the H4 timeframe, and a resistance at 1.3347 on the daily timeframe. To the downside, demand at 1.3235-1.3264 is visible on the H4 scale, along with daily support at 1.3260. This is positioned just north of weekly support at 1.3223.
Given this, neither a long nor short seems attractive at the moment.
Today’s data points: US Core PCE Price Index m/m; US Personal Spending m/m; FOMC Meeting Minutes; Canadian Current Account.
USD/CHF:
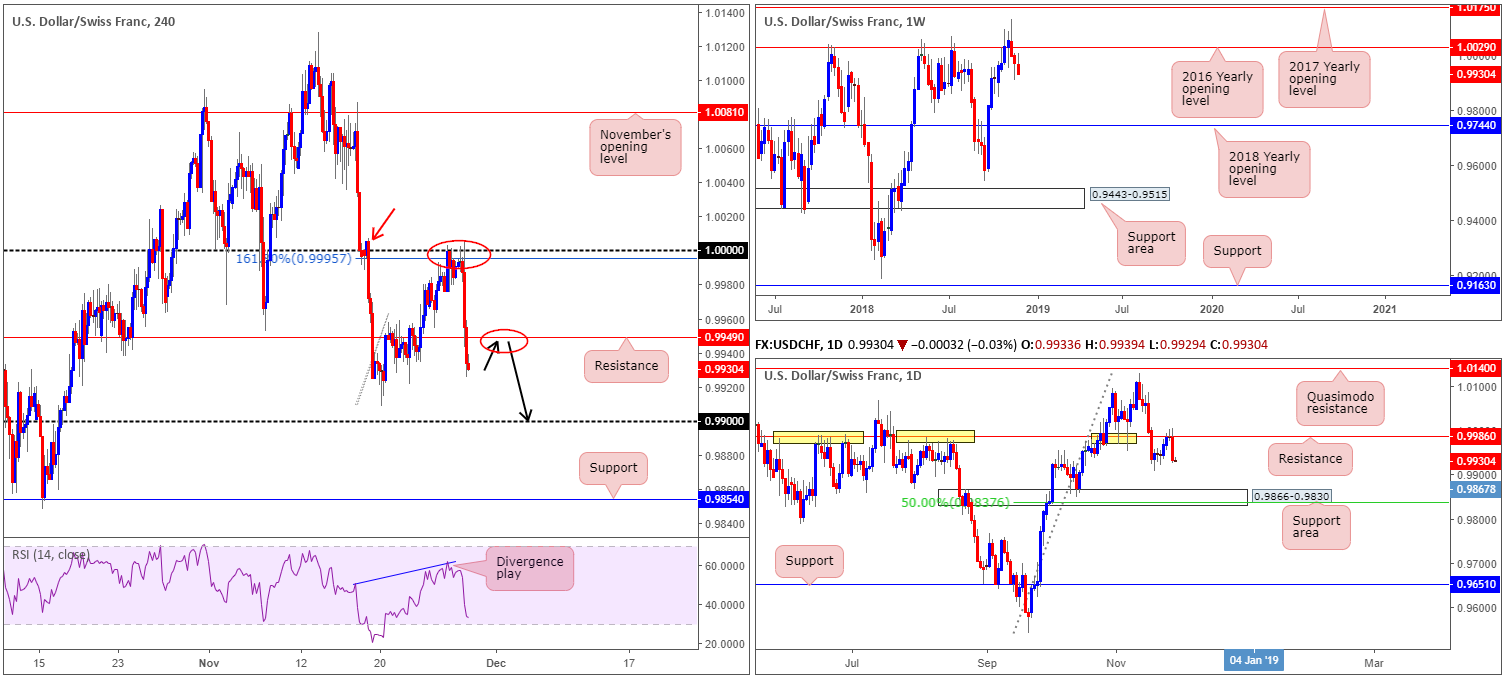
Supported by a 161.8% H4 Fibonacci ext. point at 0.9995, H4 supply marked with a red arrow at 1.0007-0.9988, daily resistance plotted at 0.9986 and the RSI indicator running a divergence play, the market observed a strong selloff take shape from 1.0000 (parity) Wednesday on the back of comments from Fed Chair Powell regarding interest rates.
For those who read Wednesday’s briefing you will recall 1.0000 was a noted sell zone. Well done to any of our readers who managed to take advantage of the recent move lower. H4 price, as you can see, overthrew support at 0.9949 (now acting resistance) at the closing stages of yesterday’s trade and is now eyeing a possible test of the 0.9908 Nov 20 low, shadowed closely by 0.99. Higher-timeframe structure, on the other hand, displays room to press beyond 0.99, targeting a daily support area at 0.9866-0.9830.
Areas of consideration:
Aside from the selloff out of 1.0000, additional shorting opportunities may be in store today. A retest of 0.9949 as resistance (black arrows) by way of a bearish candlestick formation (entry/stop parameters can be defined according to this configuration) would, according to the overall picture, likely be enough evidence to consider a sell, targeting 0.99ish as an initial take-profit zone.
Today’s data points: US Core PCE Price Index m/m; US Personal Spending m/m; FOMC Meeting Minutes.
Dow Jones Industrial Average:
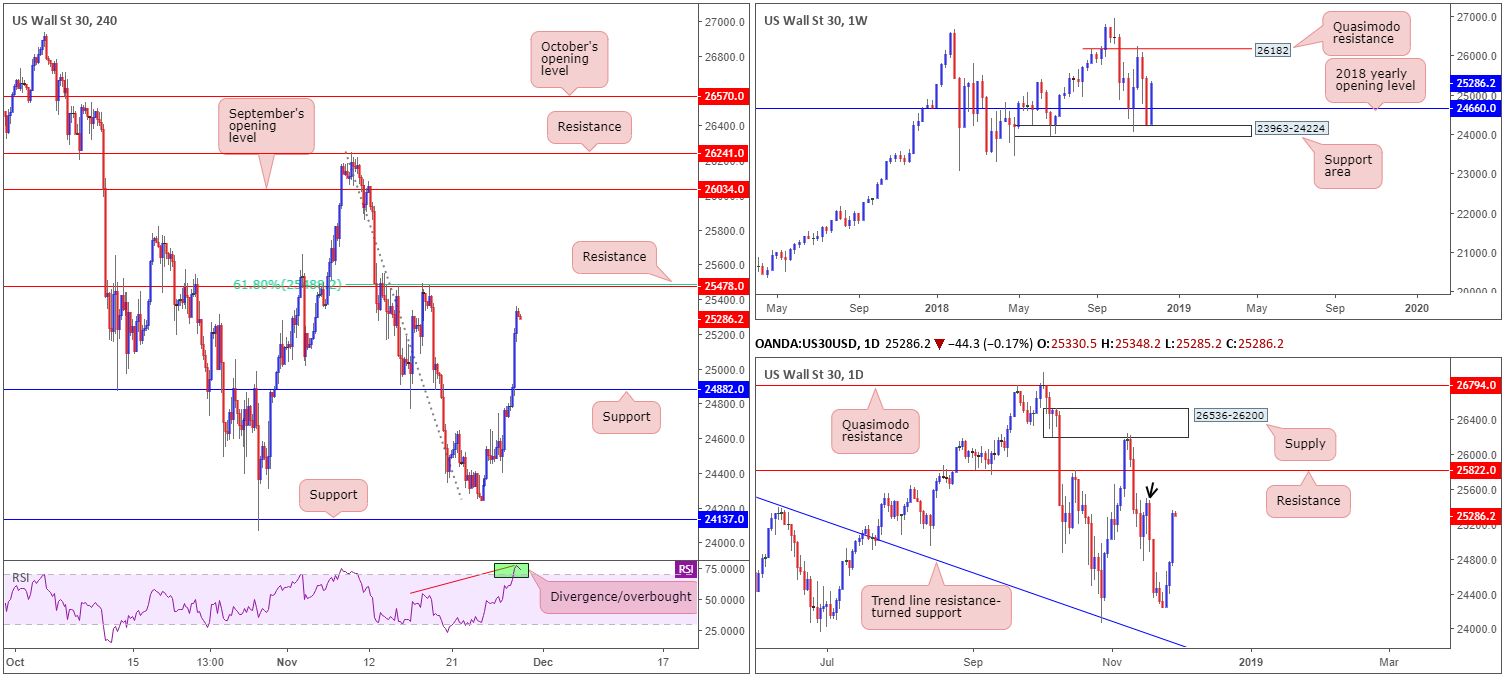
Fed Chair Powell’s recent speech on monetary policy sparked a round of heavy buying amid US hours Wednesday. Registering its third consecutive daily gain, the H4 candles concluded the day closing within striking distance of resistance priced in at 25478. By and of itself, this barrier packs a reasonably solid history, and is also connected closely with a 61.8% Fibonacci resistance value at 25488 as well as having a confirming RSI divergence/overbought reading.
In addition to the above, the research team has also noted potential daily supply lurking (black arrow) around the 25492-25305 neighbourhood. Against the backdrop of H4 and daily flow, nonetheless, traders may want to take into account weekly price exhibits space to explore higher ground until connecting with a Quasimodo resistance plotted at 26182.
Areas of consideration:
Although weekly price suggests we could be in for higher prices, a bounce lower from the H4 resistance at 25478, given its surrounding confluence, could still be on the cards.
Aggressive traders will likely enter short at 25478 and position stops around 25648ish. Conservative traders, on the other hand, may opt to wait and see how H4 action behaves before pulling the trigger. A H4 bearish candlestick configuration printed from here (entry/stop parameters can be defined according to this pattern) would help in identifying seller intent.
As for downside support targets, the team has H4 support at 24882 on the radar, followed then by the 2018 yearly opening level on the weekly timeframe at 24660.
Today’s data points: US Core PCE Price Index m/m; US Personal Spending m/m; FOMC Meeting Minutes.
XAU/USD (Gold):
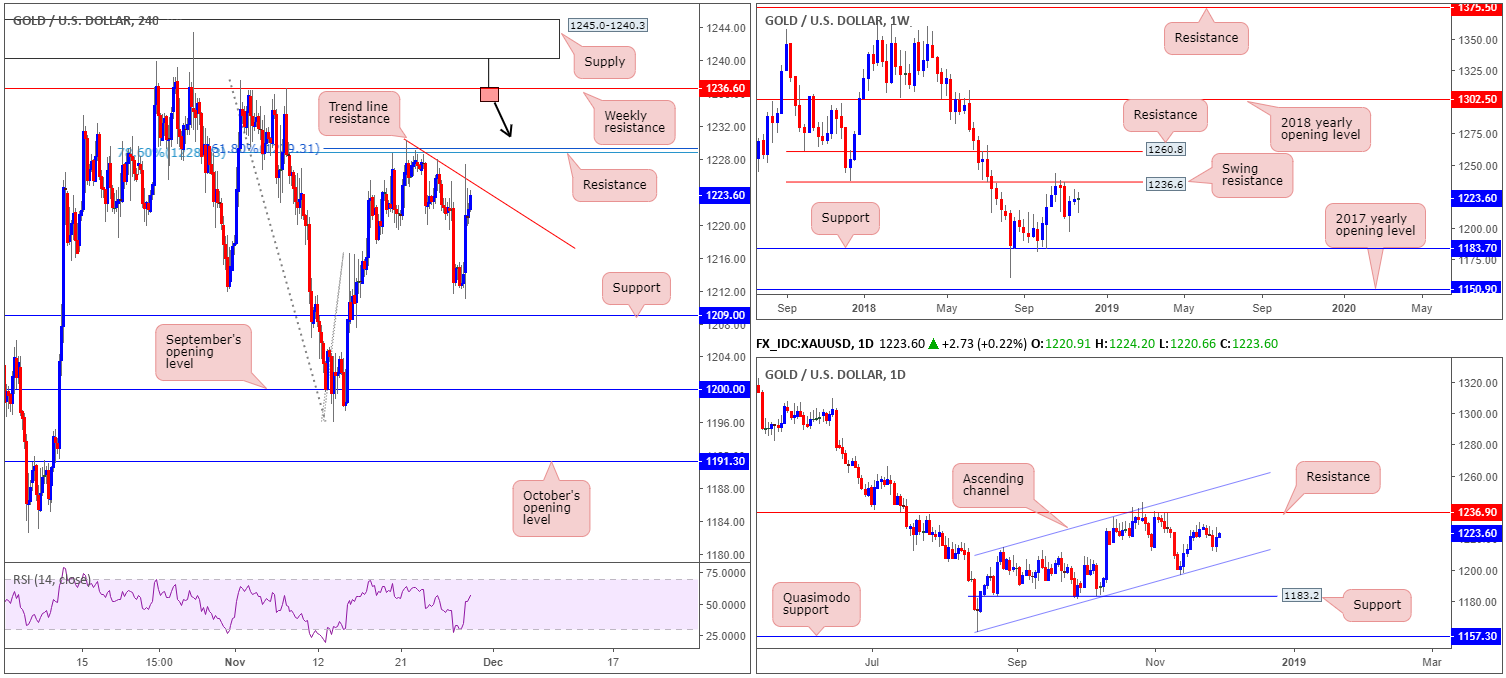
Having seen the US dollar surrender ground to many of its major trading peers Wednesday following Fed Chair Powell’s recent speech on monetary policy, bullion discovered higher ground, up 0.50% on the day.
According to our technical studies on the weekly timeframe, the yellow metal shows potential to continue pushing north until reaching a swing resistance plotted at 1236.6. A similar story is seen on the daily timeframe, whereby the next upside target on this scale falls in at resistance drawn from 1236.9.
Closer analysis, however, draws the spotlight towards a local H4 trend line resistance (taken from the high 1230.3), which is shadowed closely by another layer of H4 resistance by way of two nearby Fibonacci levels: a 161.8% Fibonacci ext. point at 1229.3 and a 78.6% retracement resistance at 1228.8.
Areas of consideration:
Weekly swing resistance mentioned above at 1236.6 is of interest, thanks to recent buying. This places the current H4 trend line resistance and the nearby Fibonacci resistances in a vulnerable position.
With H4 supply at 1245.0-1240.3 positioned just north of the weekly resistance line, traders should prepare for the possibility of a fakeout play through the weekly level. In the event a H4 bearish pin-bar formation take shape that pierces through the weekly resistance and tests the H4 supply (see H4 chart for a visual), this would be considered a high-probability shorting opportunity (stop-loss orders can be positioned either beyond the noted H4 supply or a few pips above the pin-bar’s wick).
As for downside targets, it’s a little difficult to judge at present prices given we have yet to see an approach form.
The use of the site is agreement that the site is for informational and educational purposes only and does not constitute advice in any form in the furtherance of any trade or trading decisions.
The accuracy, completeness and timeliness of the information contained on this site cannot be guaranteed. IC Markets does not warranty, guarantee or make any representations, or assume any liability with regard to financial results based on the use of the information in the site.
News, views, opinions, recommendations and other information obtained from sources outside of www.icmarkets.com.au, used in this site are believed to be reliable, but we cannot guarantee their accuracy or completeness. All such information is subject to change at any time without notice. IC Markets assumes no responsibility for the content of any linked site. The fact that such links may exist does not indicate approval or endorsement of any material contained on any linked site.
IC Markets is not liable for any harm caused by the transmission, through accessing the services or information on this site, of a computer virus, or other computer code or programming device that might be used to access, delete, damage, disable, disrupt or otherwise impede in any manner, the operation of the site or of any user’s software, hardware, data or property.


