
Key risk events today:
German Prelim CPI m/m; Canadian Current Account; US Prelim GDP q/q.
EUR/USD:
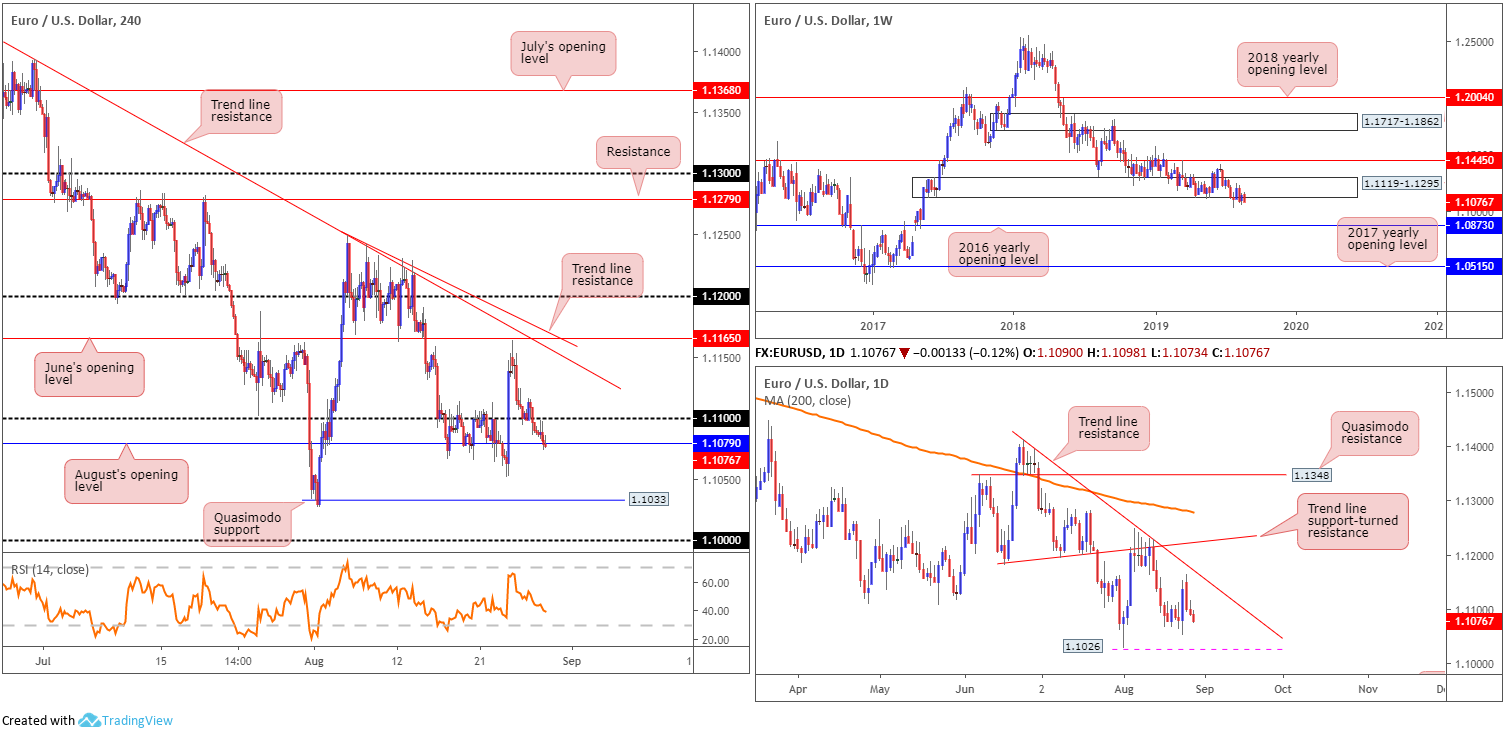
The euro subsided further Wednesday, consequently expanding weekly losses to a touch over 0.50% against the buck. The EUR/USD shrugged off weak import/export prices from Germany, however GfK Consumer Sentiment did surprise slightly to the upside.
The H4 candles remain languishing sub 1.11 and are on course to overthrow August’s opening level at 1.1079. Beyond this point, as highlighted in Wednesday’s technical briefing, Quasimodo support is in the firing range at 1.1033, closely shadowed by the widely watched key figure 1.10.
In terms of the longer-term picture, weekly structure remains unchanged from Monday’s weekly briefing:
Long-standing demand at 1.1119-1.1295 remains delicate, as sell stops continue to fill beneath its boundary. Although concluding the week in mildly firmer territory, additional downside is the favoured route on this timeframe. Continued selling could eventually see the unit knock on the 2016 yearly opening level’s door at 1.0873, which houses strong historical significance.
In addition to the above, since topping in early 2018, the long-term trend remains pointing in a southerly bearing.
The daily timeframe:
Neighbouring resistance on tap this week is visible by way of a trend line resistance (etched from the high 1.1412), shadowed closely by another layer of trend line resistance (prior support) extended from the low 1.1181 and then the 200-day SMA (orange – currently circulating around 1.1283). To the downside, support resides at 1.1026, the 2019 low, followed by demand (not visible on the screen) at 1.0851-1.0950.
Areas of consideration:
Having seen room to press lower on the daily timeframe until 1.1026 and waning impetus out of weekly demand at 1.1119-1.1295, a break of August’s opening level at 1.1079 on the H4 timeframe may be in store. With this being the case, a H4 close taking shape below 1.1079 unlocks the door to a potentially bearish scenario, either selling based on the breakout candlestick or, more conservatively, at a possible retest motion of 1.1079 as resistance. The next support target from here is the H4 Quasimodo support highlighted above at 1.1033, closely followed by 1.1026 on the daily scale and then the key figure 1.10 on the H4.
GBP/USD:
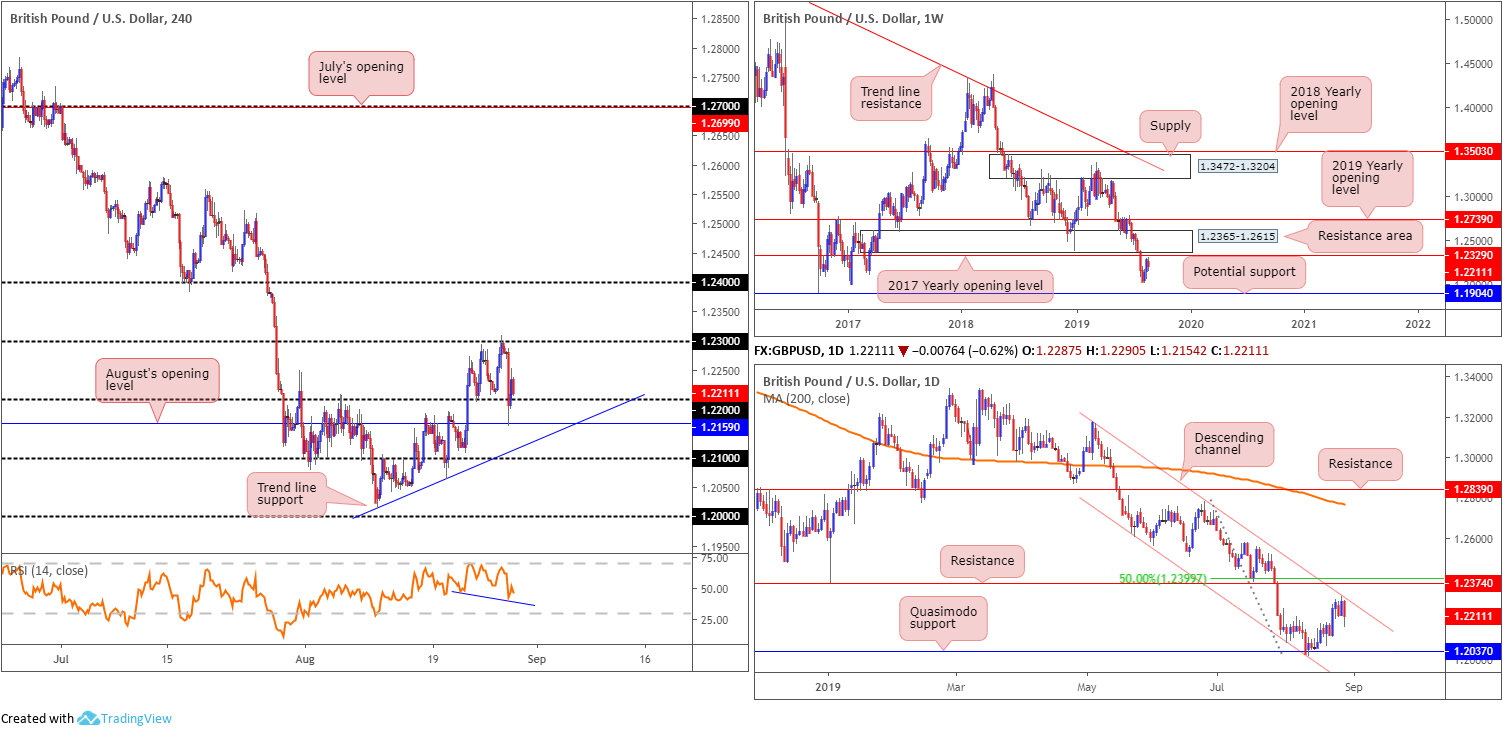
Pound sterling, an underperformer in the G10 space, fell sharply against its US counterpart Wednesday, down more than 0.60%. The slump came about on news the Queen approved the request to prorogue parliament from no sooner than September 9th and no later than September 12th, until October 14th; limiting time for the Anti-No-Deal team to put together a legislative way to prevent a no deal.
GBP/USD initially breached 1.22 to the downside, however the moves were pared back off August’s opening level at 1.2159 on the H4 scale back above the key level into the close. With sell stops beneath 1.22 wincing, a revisit of August’s opening level could be in store, followed by a possible move towards nearby trend line support (extended from the low 1.2014).
According to higher-timeframe structure, though, further downside is a possibility. The 2017 yearly opening level at 1.2329 (resistance) on the weekly timeframe, set a couple of points south of a major resistance area at 1.2365-1.2615, remains a stronghold for sellers. In conjunction with this, daily channel resistance recently entered the mix (taken from the high 1.3176) and is holding firm.
Areas of consideration:
Although daily channel resistance suggests sellers may have the upper hand now, a rally to weekly resistance at 1.2329 is certainly not out of the question to draw in longer-term sellers. This would also imply a run of buy stops above 1.23 on the H4. For that reason, longs off 1.22 today could be an idea, though waiting for additional candlestick confirmation to form before pulling the trigger is advised (entry and risk can be determined according to this structure) – not only because we’re coming off daily channel resistance, but also due to potentially fragile buyers at 1.22 thanks to yesterday’s whipsaw motion.
Another scenario worthy of attention is a stop run above 1.23 that tags in weekly sellers from 1.2329, and drops lower. The closing price formed beneath 1.23 would serve as an entry price for shorts, with protective stop-loss orders positioned above the weekly resistance level.
AUD/USD:
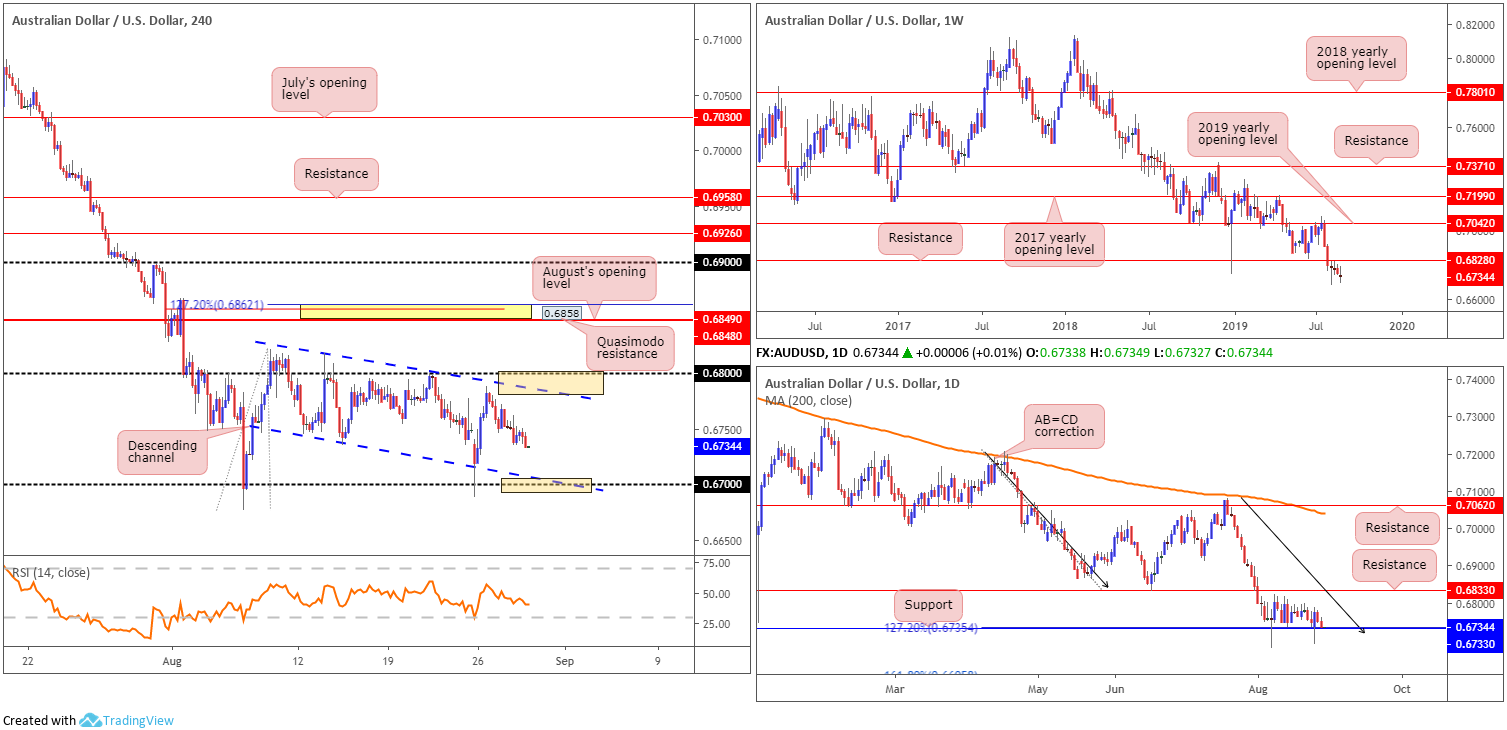
The slowdown in Australia’s construction industries recently intensified, with a weaker-than-expected contraction over the second quarter. Data published by the Australian Bureau of Statistics revealed Construction Work Done came in at -3.8%, missing market expectations of -1.00%. The report triggered a bout of selling in early trade Wednesday, subsequently extending Tuesday’s losses.
Despite recent downside, technical structure remains unchanged.
Since early August, the H4 candles have been contained beneath 0.68, compressing within the limits of a descending channel formation (0.6817/0.6745). Beyond the 0.68 handle, a close-fitting area of resistance (yellow) resides between a 127.2% Fibonacci ext. point at 0.6862, a Quasimodo resistance at 0.6858 and August’s opening level at 0.6848.
Higher-timeframe structure remains intact and unaltered – extracted from Monday’s weekly report:
The end of July witnessed the unit slip beneath notable weekly support at 0.6828, now a serving resistance. The following two weeks were colourless, organised as back-to-back indecision candles, with last week’s session also not really doing much to turn the dial.
The long-term downtrend, intact since the beginning of 2018, remains unbroken, with further selling likely on the cards as the next weekly support is not visible until 0.6395 on this timeframe (not seen on the screen).
Daily timeframe also remains unchanged:
Since elbowing beneath weekly support mentioned above at 0.6828, support at 0.6733 on the daily timeframe, along with a 127.2% AB=CD (black arrows) formation at 0.6735, entered the fray and held things higher. Despite this, the pair remains deeply in bearish territory and does not appear to have the firepower to cross swords with resistance at 0.6833 (June 18 low).
Areas of consideration:
Psychological levels 0.67 and 0.68 remain in the firing range as potentially tradeable barriers, given both merge closely with the H4 descending channel extremes highlighted above. As round numbers are prone to stop runs, traders are urged to wait for additional candlestick confirmation to form before pulling the trigger. This way, not have you only identified buyer/seller intent, you also have structure to base entry/risk levels from.
The yellow H4 area of resistance between 0.6862/0.6848 is also an area worthy of consideration for shorts. Granted, while this zone is a touch above higher timeframe-resistance, a fakeout above these levels (likely flushing out greedy buy stops) to the said H4 zone is a strong possibility if we break 0.68. Entry at 0.6848 is valid, with a tight protective stop-loss order plotted above 0.6862, but if you prefer waiting for additional confirmation, a bearish candlestick pattern would suffice and help base entry and risk levels.
USD/JPY:
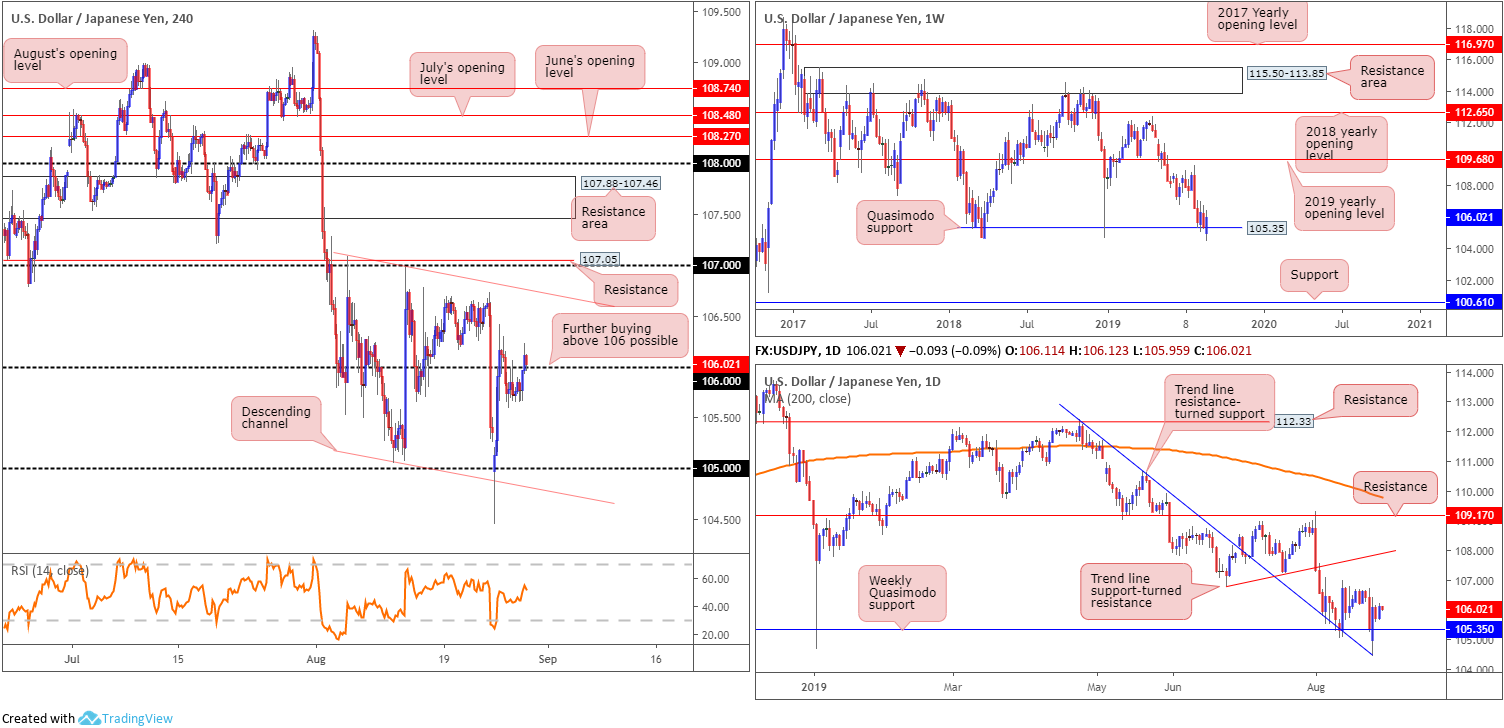
In recent sessions, the USD/JPY held within a tight intraday range for most of the day, though managed to marginally overthrow 106 to the upside into the close. The next upside objective on the H4 timeframe falls in at channel resistance etched from the high 107.09, closely trailed by the 107 handle and resistance coming in at 107.05. The next port of call in terms of potential support, aside from 106, can be seen around the 105 handle, closely shadowed by channel support etched from the low 105.05.
Longer term, as highlighted in previous reports, has weekly price defending Quasimodo support at 105.35 – a level that proved its worth by holding the unit higher at the beginning of the year. Outside of this base, limited support is evident until 100.61, whereas a push north has the 2019 yearly opening level at 109.68 to target. Beyond the weekly Quasimodo support, daily traders have a trend line resistance-turned support (pencilled in from the high 112.40) in motion, which could eventually send the candles to tops set at 106.77, followed by trend line support-turned resistance (taken from the low 106.78).
Areas of consideration:
With higher-timeframe impetus drawing energy from weekly Quasimodo support at 105.35, and daily structure exhibiting scope for additional upside, further gains above 106 could be seen today/tomorrow, targeting the said H4 resistances underlined above in bold. H4 price holding above 106 in the shape of a notable bullish candlestick signal is likely eyed by some traders. Not only will this help discern buyer intent, it also provides entry/risk levels to work with.
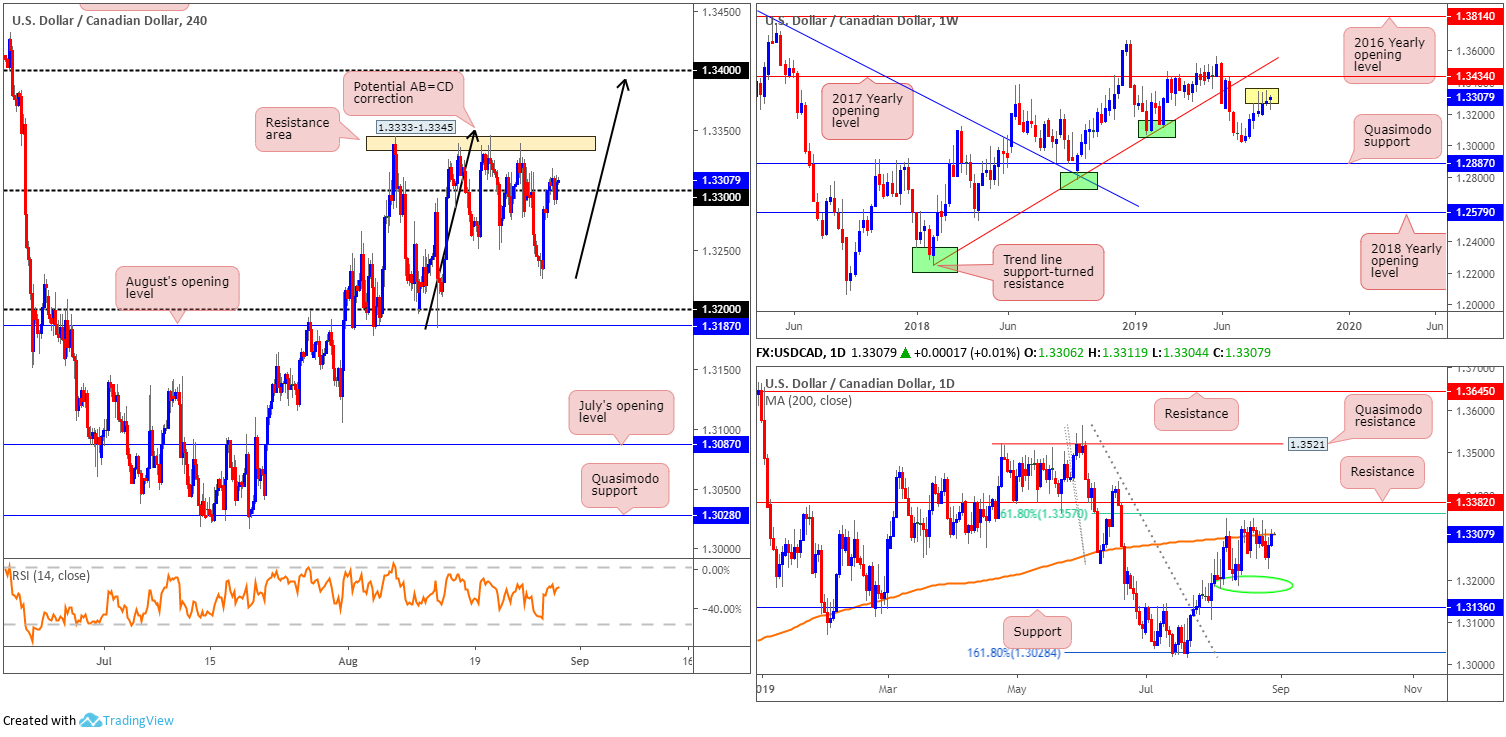
USD/CAD:
Wednesday had the US dollar a shade higher against its Canadian counterpart, as WTI prices settled sub $56/bbl and the US dollar index extended ground above 98.00. Technically, this lifted the H4 candles above 1.33 on the H4 timeframe, poised to potentially advance towards a resistance area coming in at 1.3333-1.3345. Beyond here, the research team notes limited resistance until crossing swords with 1.34, which, if we move this far north, may complete by way of an AB=CD approach (black arrows) at 1.3393.
Chart studies based on higher-timeframe structure has weekly price eyeing a test of resistance at 1.3434: the 2017 yearly opening level, followed by trend line support-turned resistance pencilled in from the low 1.2247, despite the prior three weeks chalking up visible selling wicks. In terms of where we stand on the daily timeframe, the unit is shaking hands with the underside of its 200-day SMA (currently circulating around 1.3309), thanks to recent buying. Overhead, nearby resistance resides at a 61.8% Fibonacci ratio drawn from 1.3357 and resistance coming in at 1.3382.
Areas of consideration:
Chartists focusing solely on the H4 timeframe likely remain in buy mode, particularly after conquering 1.33 to the upside. Caution is advised, however. Granted, we do have room to press for higher ground on the weekly timeframe until 1.3434, though in doing so we must overcome the 200-day SMA in motion, the H4 resistance area at 1.3333-1.3345 and the daily resistances plotted above the SMA at 1.3382 and 1.3357. Therefore, those considering longs above 1.33 may face drawdown.
Shorts from the 1.34 handle, although not likely to enter the fray today, are possibly of interest for some traders. Not only does it come with a H4 AB=CD approach, nearby resistance on the daily timeframe falls in at 1.3382. Despite this confluence, traders are urged to wait for additional candlestick confirmation before executing a trade, as a fakeout through 1.34 to weekly resistance at 1.3434 may be on the cards.
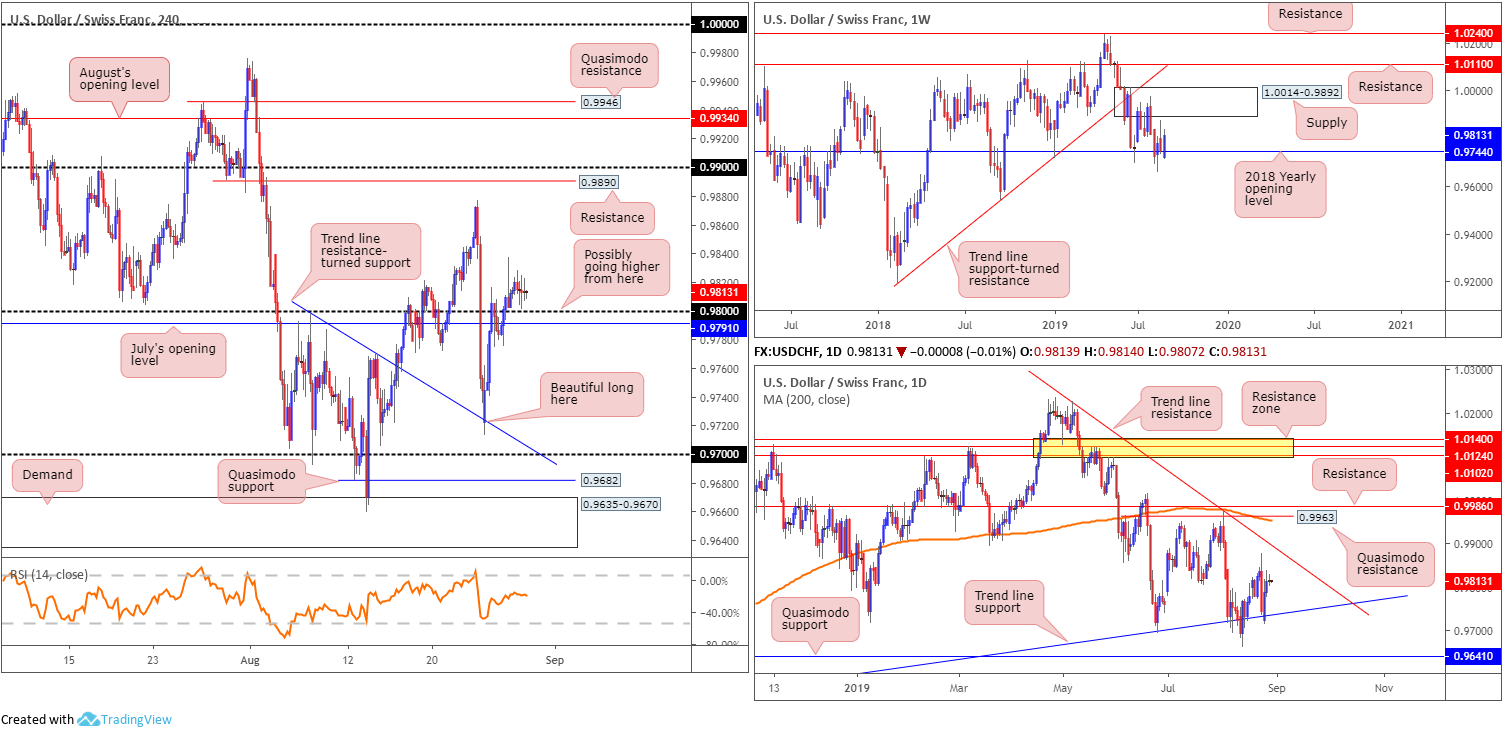
USD/CHF:
USD/CHF prices remain unchanged this morning as the market shifts into Asia Pac hours. By way of back-to-back H4 Doji candlestick formations, the unit is meandering a few points north of the 0.98 handle, closely shadowed by July’s opening level at 0.9791.
Considering yesterday’s lacklustre performance, much of the following report will echo thoughts put forward in Wednesday’s technical briefing.
The next upside targets on the H4 timeframe can be seen around the 0.9877 August 23 high, closely trailed by resistance plotted at 0.9890 and then the 0.99 handle.
Weekly impetus derived from the 2018 yearly opening level at 0.9744 (support), which has an upside target set at supply coming in from 1.0014-0.9892, and daily price finding its feet off trend line support taken from the low 0.9542, is likely to fuel upside above 0.98 on the H4 scale.
Areas of consideration:
For traders who remain long off H4 trend line resistance-turned support (extended from the high 0.9797) – a noted level to be aware of in Monday’s weekly briefing – partial profits should already be in the bag and risk reduced to at least breakeven.
In the event further buying emerges above 0.98, as the higher-timeframes suggest, a bullish scenario, targeting the daily trend line resistance highlighted above (1.0226), may occur. Conservative traders will likely look for a retest play at 0.98, preferably in the shape of a H4 bullish candlestick signal (entry and risk can be governed according to this structure). More aggressive traders who favour trading the breakout candle will already likely be long, with protective stop-loss orders tucked either beneath 0.98 or 0.9791.
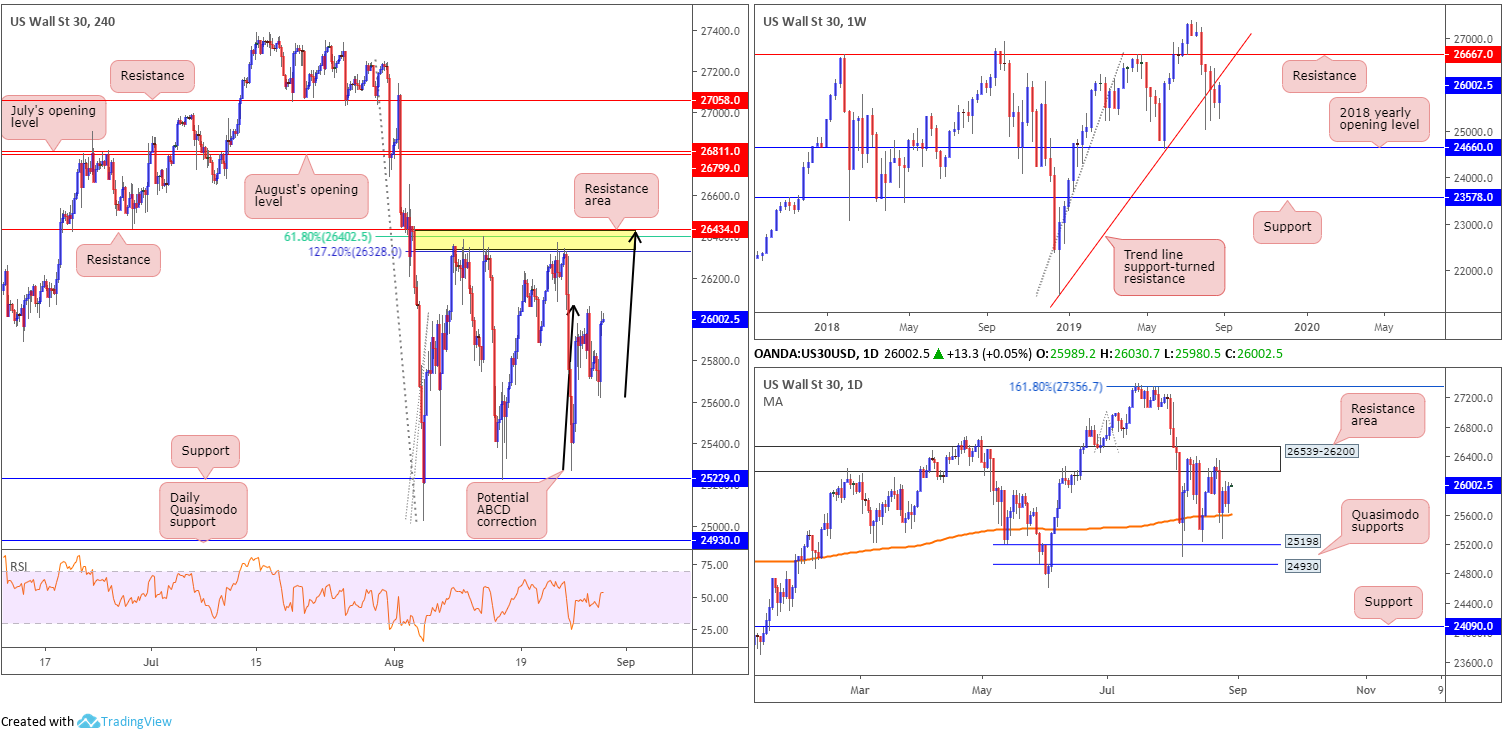
Dow Jones Industrial Average:
US stocks overcame an early blip Wednesday and closed broadly higher amid continued volatility induced by the inverted US Treasury yield curve, the US/China trade war and the threat of a no-deal Brexit. The Dow Jones Industrial Average added 258.20 points, or 1.00%; the S&P 500 also added 18.78 points, or 0.65% and the tech-heavy Nasdaq 100 climbed 21.87 points, or 0.29%.
Ultimately, limited change is visible in terms of technical structure on the H4 timeframe this morning.
Extracted from Wednesday’s technical briefing:
H4 flow remains capped by a familiar resistance zone at 26434/26328 (comprised of resistance at 26434, a 127.2% Fibonacci ext. point at 26328 and a 61.8% Fibonacci retracement value at 26402). This is the third time the index has responded from here this month, once more exposing support at 25229, the lower base of the current H4 range, closely followed by daily Quasimodo support at 24930.
The only discernible difference in terms of structure is the potential ABCD correction (black arrows) which terminates within the upper range of the said H4 resistance zone.
Higher-timeframe analysis reveals daily flow holding ground above the 200-day SMA function (orange – 25611), poised to shake hands with a nearby resistance area at 26539-26200. The story on the weekly timeframe is seen fast approaching the underside of a recently broken long-term trend line support (taken from the low 21452). A retest at this base could spark another wave of selling. Failing that, traders’ crosshairs will likely be fixed on resistance at 26667.
What’s also notable from a technical perspective is the said daily resistance zone is sited just south of weekly resistance at 26667 and merges with the current weekly trend line resistance.
Areas of consideration:
Longer term, the research team has eyes on the trend line support-turned resistance on the weekly timeframe. A rejection off this line could spell trouble for longs, with the next downside target on this scale coming in at the 2018 yearly opening level at 24660.
Medium term (H4), crosshairs remain on the H4 resistance area at 26434/26328 for additional reactions, owing to the zone being positioned within the limits of the daily resistance area, which as we already know has a connection to the weekly trend line resistance. Therefore, keep an eye open for a test of this zone, preferably in the form of a bearish candlestick pattern. Traders then have the option of setting entry/risk levels based on the H4 or daily resistance areas, or simply on the back of the bearish candlestick structure.
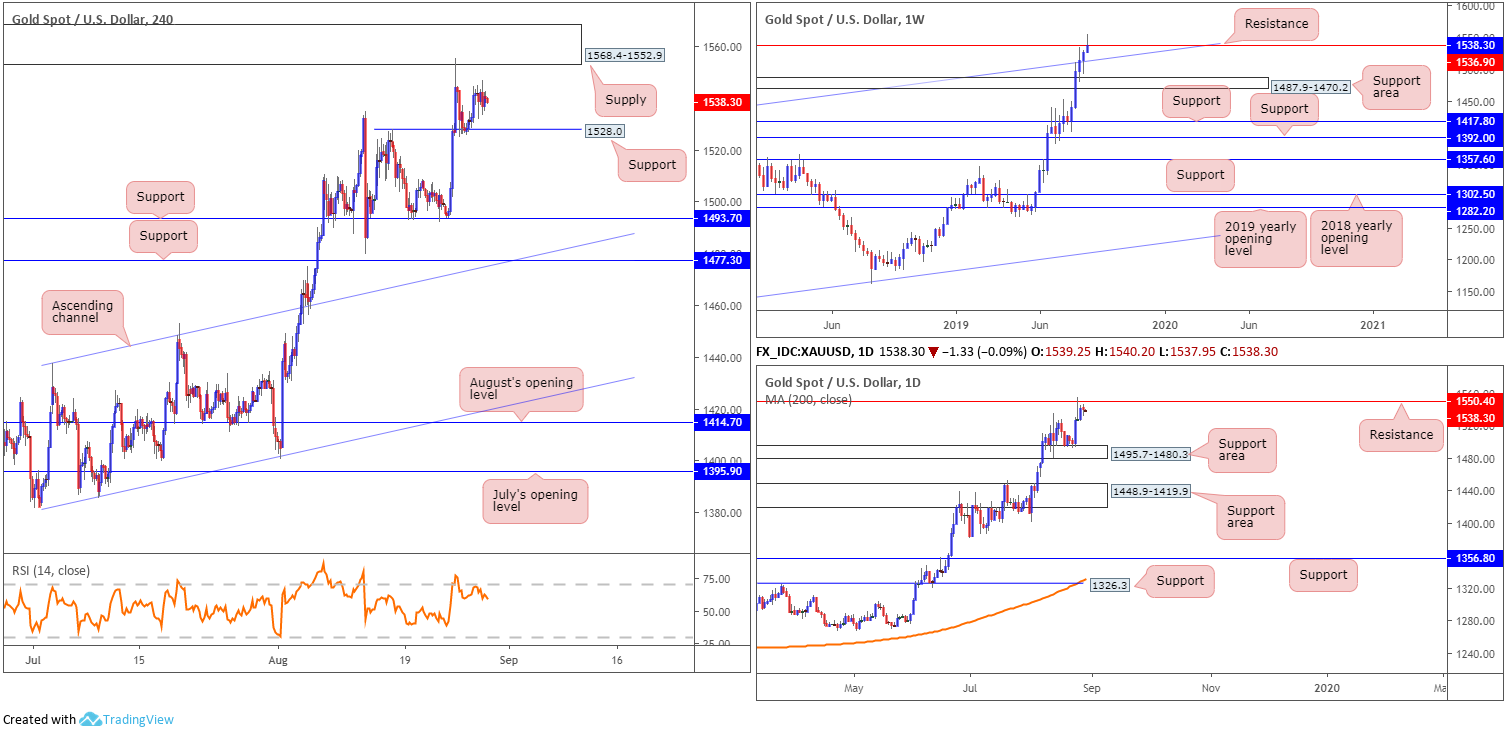
XAU/USD (GOLD):
Bullion remained pretty much unchanged vs. the greenback Wednesday (-0.15%), ranging no more than $14.5.
Monday witnessed the H4 candles shake hands with supply at 1568.4-1552.9, which remains in the fray despite support establishing from 1528.0. In the event we turn lower from here, support at 1493.7 remains a logical downside target.
Weekly movement is, once again, seen challenging resistance at 1536.9, with price action currently trading a touch beyond the level, as we write. By the same token, daily price tested resistance at 1550.4 and wrapped up Monday in the shape of a shooting star pattern. As is evident from the chart, limited follow-through selling has emerged so far, with the unit poised to retest the said resistance for a second time.
Areas of consideration:
With all three timeframes exhibiting scope to explore lower ground – weekly price trading above resistance is not considered a bullish signal UNTIL a decisive close is observed – a move lower could be on the cards. Given the current uptrend, traders may want to consider waiting for the H4 candles to close beneath 1528.0 and open the runway south to 1493.7. By doing so, traders have the option of either selling the breakout candle directly or waiting and seeing if a retest at 1528.0 materialises, preferably in the form of a bearish candlestick pattern (entry/risk can be determined according to this formation).
The accuracy, completeness and timeliness of the information contained on this site cannot be guaranteed. IC Markets does not warranty, guarantee or make any representations, or assume any liability regarding financial results based on the use of the information in the site.
News, views, opinions, recommendations and other information obtained from sources outside of www.icmarkets.com.au, used in this site are believed to be reliable, but we cannot guarantee their accuracy or completeness. All such information is subject to change at any time without notice. IC Markets assumes no responsibility for the content of any linked site.
The fact that such links may exist does not indicate approval or endorsement of any material contained on any linked site. IC Markets is not liable for any harm caused by the transmission, through accessing the services or information on this site, of a computer virus, or other computer code or programming device that might be used to access, delete, damage, disable, disrupt or otherwise impede in any manner, the operation of the site or of any user’s software, hardware, data or property.


