
Key risk events today:
New Zealand ANZ Business Confidence; Australia Private Capital Expenditure q/q; US Prelim GDP q/q; US Core Durable Goods Orders m/m; US Durable Goods Orders m/m; US Unemployment Claims; US Pending Home Sales m/m.
Previous analysis as well as outside sources is denoted by way of italics.
EUR/USD:
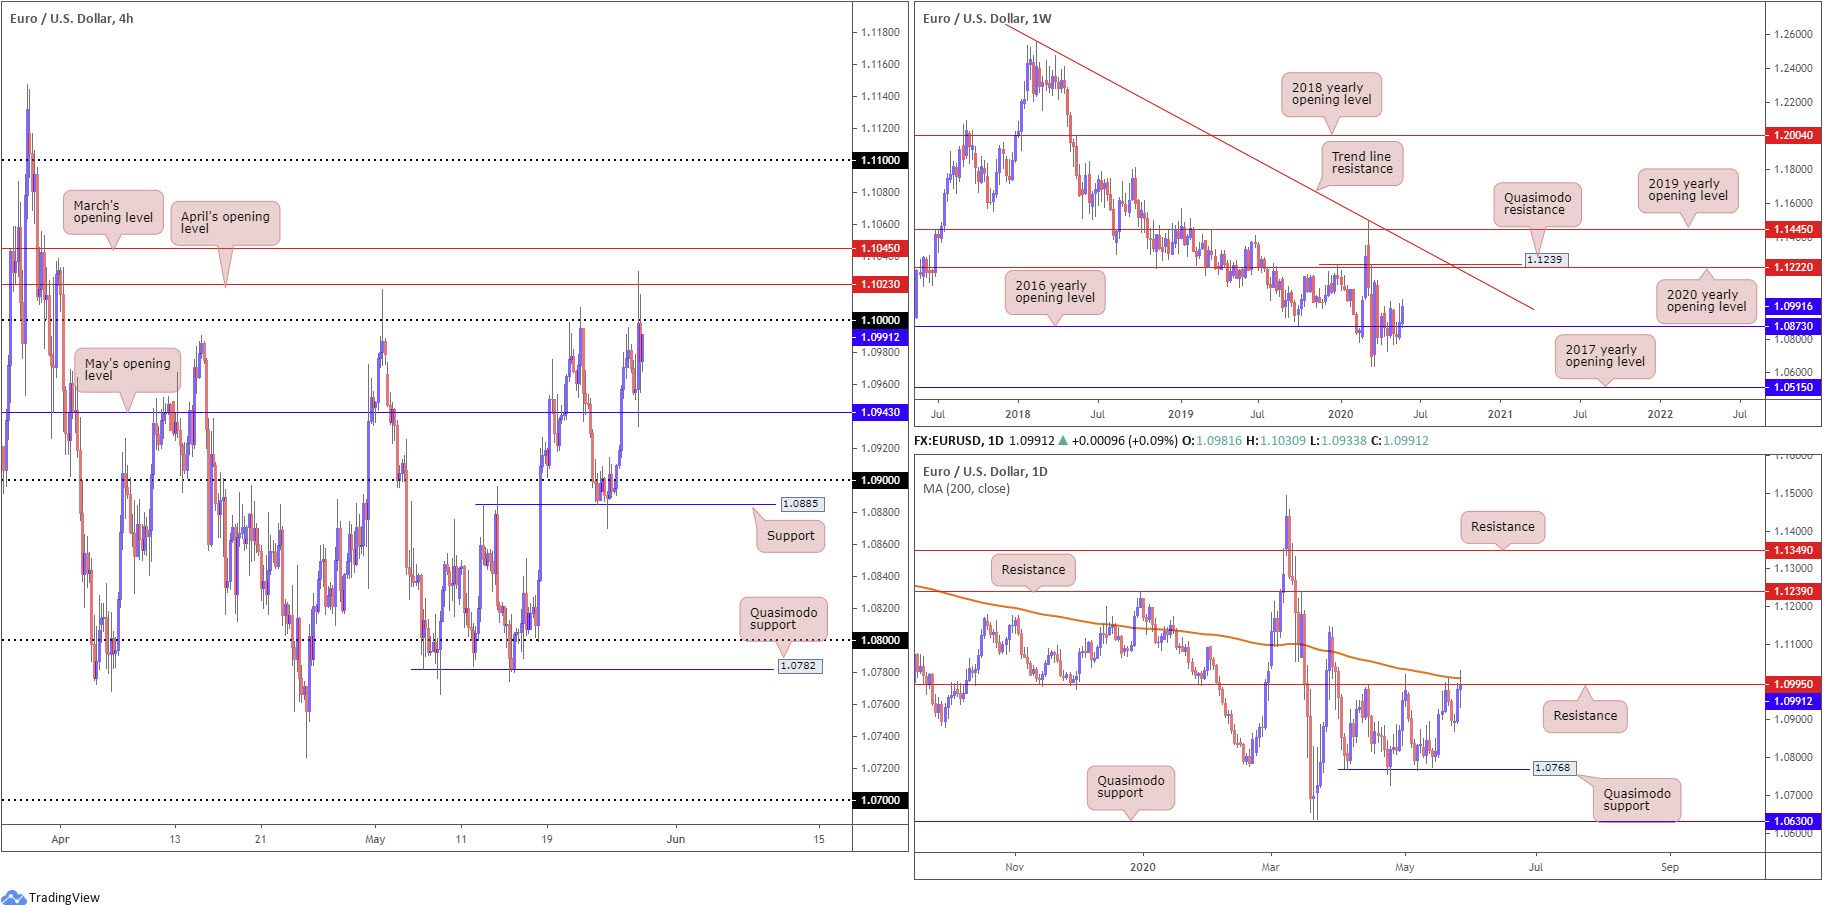
Wednesday had the shared currency rebound strongly against the US dollar, off May’s opening level at 1.0943. 1.10 came under threat shortly after, displaying a fakeout through the key figure to April’s opening level at 1.1023 on the H4 timeframe. The move likely tripped a truckload of buy-stops above 1.10, leaving some sellers and breakout buyers stranded.
Further afield, weekly price is showing some enthusiasm north of the 2016 yearly opening level at 1.0873. Major resistance is not expected to show itself until the 2020 yearly opening level at 1.1222, closely followed by Quasimodo resistance at 1.1239. A bump lower from here, on the other hand, could face multi-year lows at 1.0635. With respect to the long-term trend, the pair has remained under weight since topping in early 2018.
Daily resistance at 1.0995, placed nearby the 200-day SMA (orange – 1.1010), entered play Wednesday. The upper candle shadow formed clearly shows seller interest here. Above these areas, we do not really see much to get excited about until reaching resistance at 1.1239 (essentially the same base as weekly QM); downside, however, may eventually collide with Quasimodo support at 1.0768.
Areas of consideration:
For traders who read Wednesday’s technical briefing you may recall the following (italics):
Technical elements support a rejection from the 1.10 region; it joins with a H4 Quasimodo resistance level and comes with a daily resistance base at 1.0995, along with the 200-day SMA at 1.1010. Although sufficient to hamper upside, traders are urged to pencil in the possibility of a fakeout to April’s opening level at 1.1023 before sellers step in.
Conservative sellers from 1.10 may favour positioning protective stop-loss orders above March’s opening level at 1.1045, with an initial take-profit target fixed at May’s opening level from 1.0943.
Well done to any readers who managed to jump aboard yesterday’s movement. Although we’re meandering sub 1.10, as we write, there’s still a chance May’s opening level at 1.0943 could call for attention today as a support target. As such, short sellers may have already reduced risk to breakeven and banked a portion of the position, leaving some to run for 1.0943.
GBP/USD:
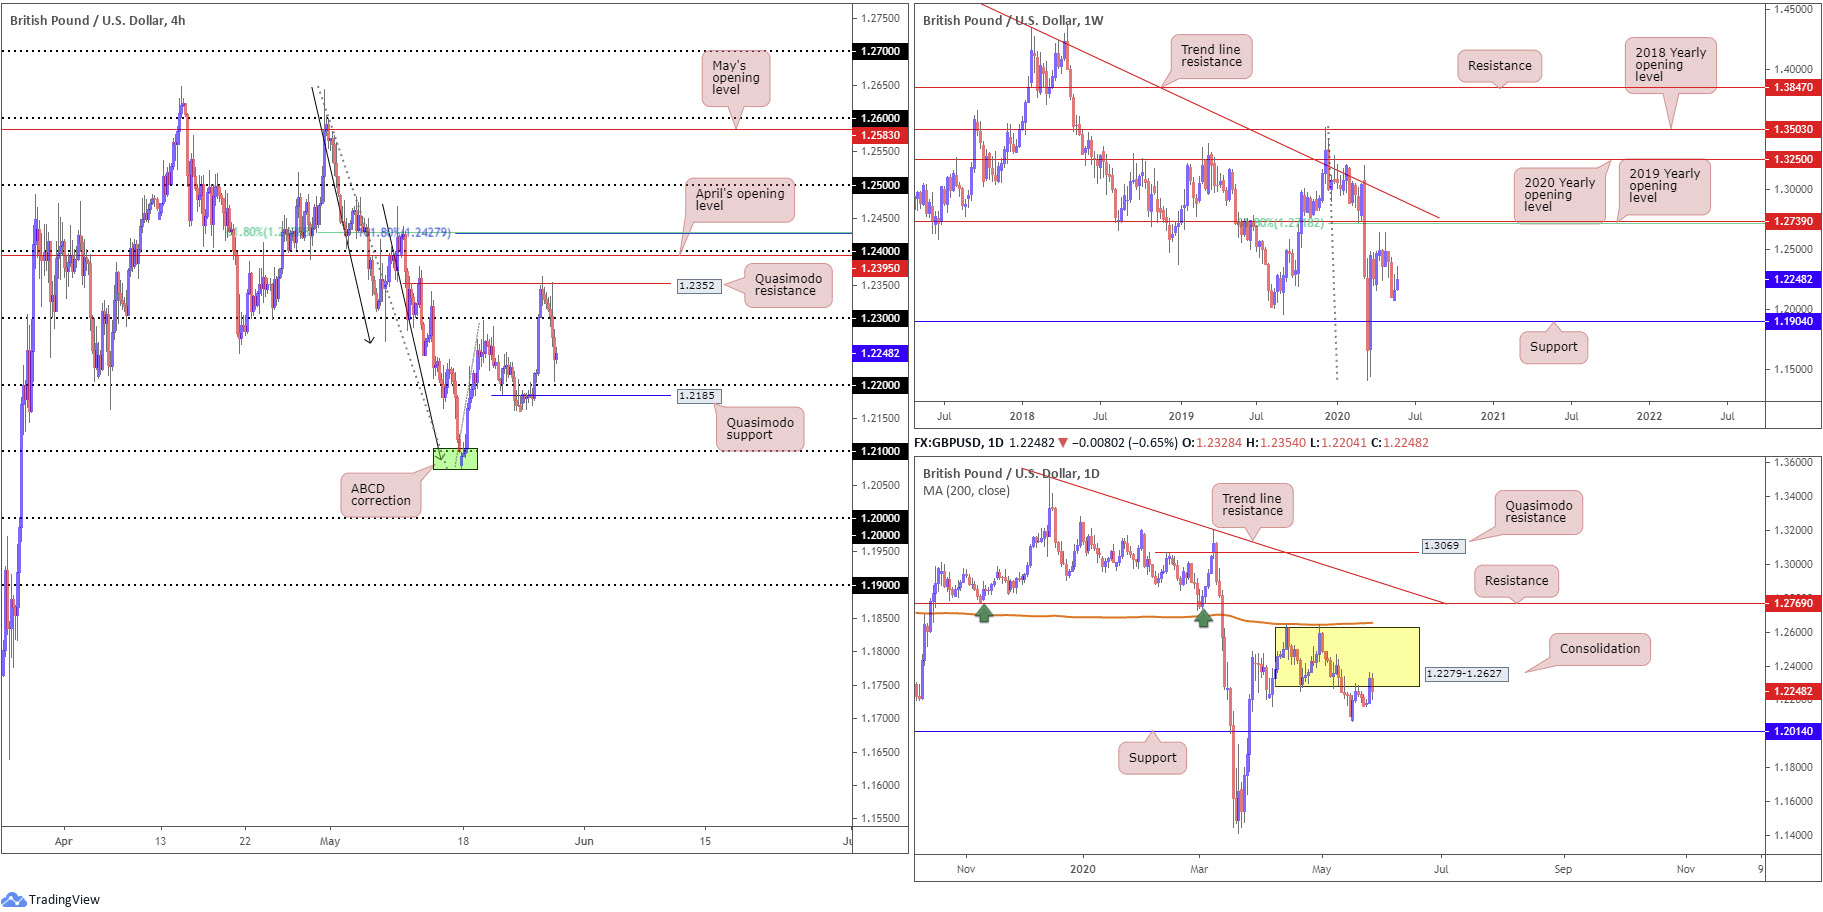
Sterling, as evident from the charts, was unable to extend Tuesday’s advance against the dollar on Wednesday, as gains were capped off 1.2352, a Quasimodo resistance level on the H4 timeframe. The H4 candles reclaimed 1.23 to the downside in strong fashion following the day’s top, eventually clocking lows just ahead of the 1.22 handle and nearby Quasimodo support coming in at 1.2185.
Support on the weekly timeframe positions itself at 1.1904. Resistance, on the other hand, falls in at 1.2739, the 2019 yearly opening level, and a 61.8% Fibonacci retracement ratio at 1.2718, sited close by a trend line resistance, extended from the high 1.5930.
The daily window has buyers and sellers battling for position off range lows at around 1.2279. Bidding from this point may lead to an attack at range tops around 1.2627, along with the 200-day SMA at 1.2655. Moves lower, assuming a breach of the 1.2075 May 18 low, could find support at 1.2014.
Areas of consideration:
Based on H4 chart studies, a fakeout through 1.22 to Quasimodo support positioned close by at 1.2185 could be on the menu today. Sell-stops under the round number may provide enough fuel to excite buyers into the market off 1.2185. A H4 close back above 1.22, therefore, may be taken as a buy signal, perhaps targeting 1.23.
AUD/USD:
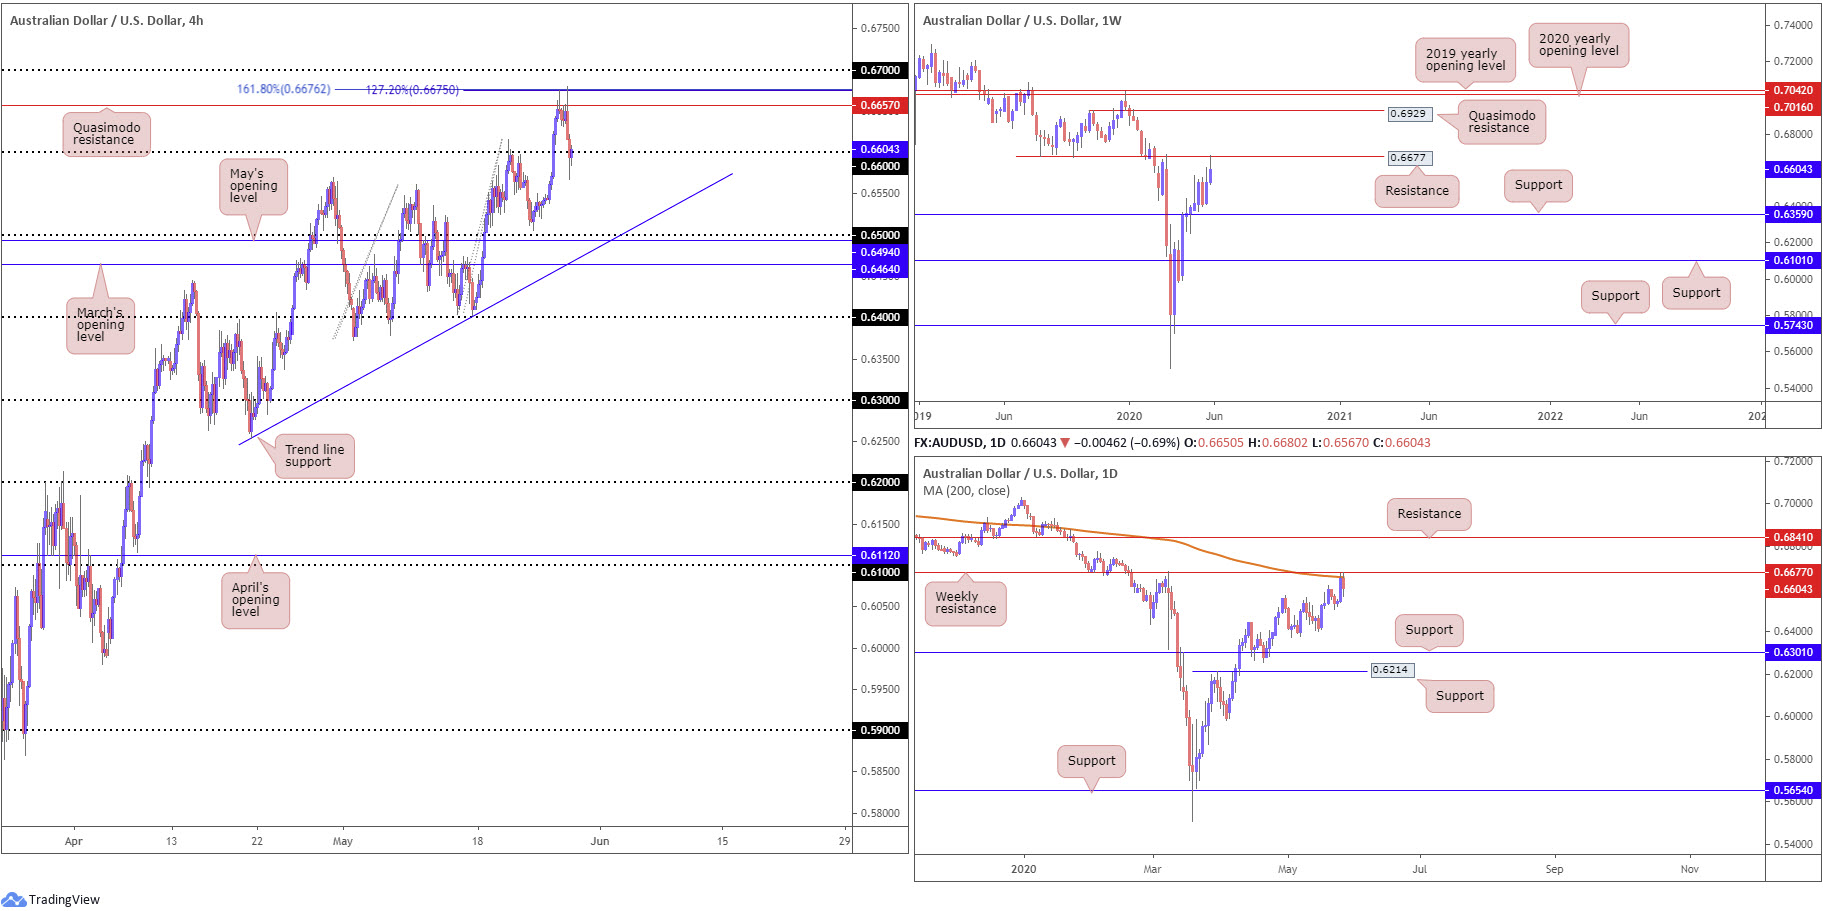
The Australian dollar saw demand taper off against its US counterpart Wednesday, down 0.6% by the close. A combination of a broad dollar recovery and concerns surrounding US/China relations weighed on AUD/USD.
From the weekly timeframe, AUD/USD came into contact with resistance at 0.6677 and has, as of writing, prompted a bout of selling. In conjunction with the weekly timeframe, daily price crossed swords with its 200-day SMA (orange – 0.6656) and turned lower, a value closely shadowed by the weekly resistance highlighted above at 0.6677.
After crossing Quasimodo resistance at 0.6657 on the H4 timeframe, intraday action found resistance comprised of a 161.8% Fibonacci extension point at 0.6676 and a 127.2% Fibonacci extension point at 0.6675.
Areas of consideration:
Wednesday’s technical briefing highlighted the following (italics):
Technically, with weekly resistance at 0.6677 close by, along with a tasty Fibonacci area of resistance on the H4 between 0.6676/75 and the 200-day SMA at 0.6656, a pullback could be on the cards today. However, do account for the possibility of a move to 0.67 before sellers make an appearance.
Well done to any readers who managed to jump aboard yesterday’s move lower. Three timeframes exhibiting strong resistance tends to produce a response.
Sellers short 0.6677ish have likely reduced risk to breakeven and banked partial profits at 0.66. Holding a portion of the position open is an option here, given sell-stops under the round number have likely been tripped, potentially setting the stage for further losses towards 0.65 today.
A decisive H4 close under 0.66, therefore, may offer current shorts the opportunity to pyramid their current position. Alternatively, fresh sellers will then be free to join the party.
USD/JPY:
Outlook unchanged due to lacklustre movement.
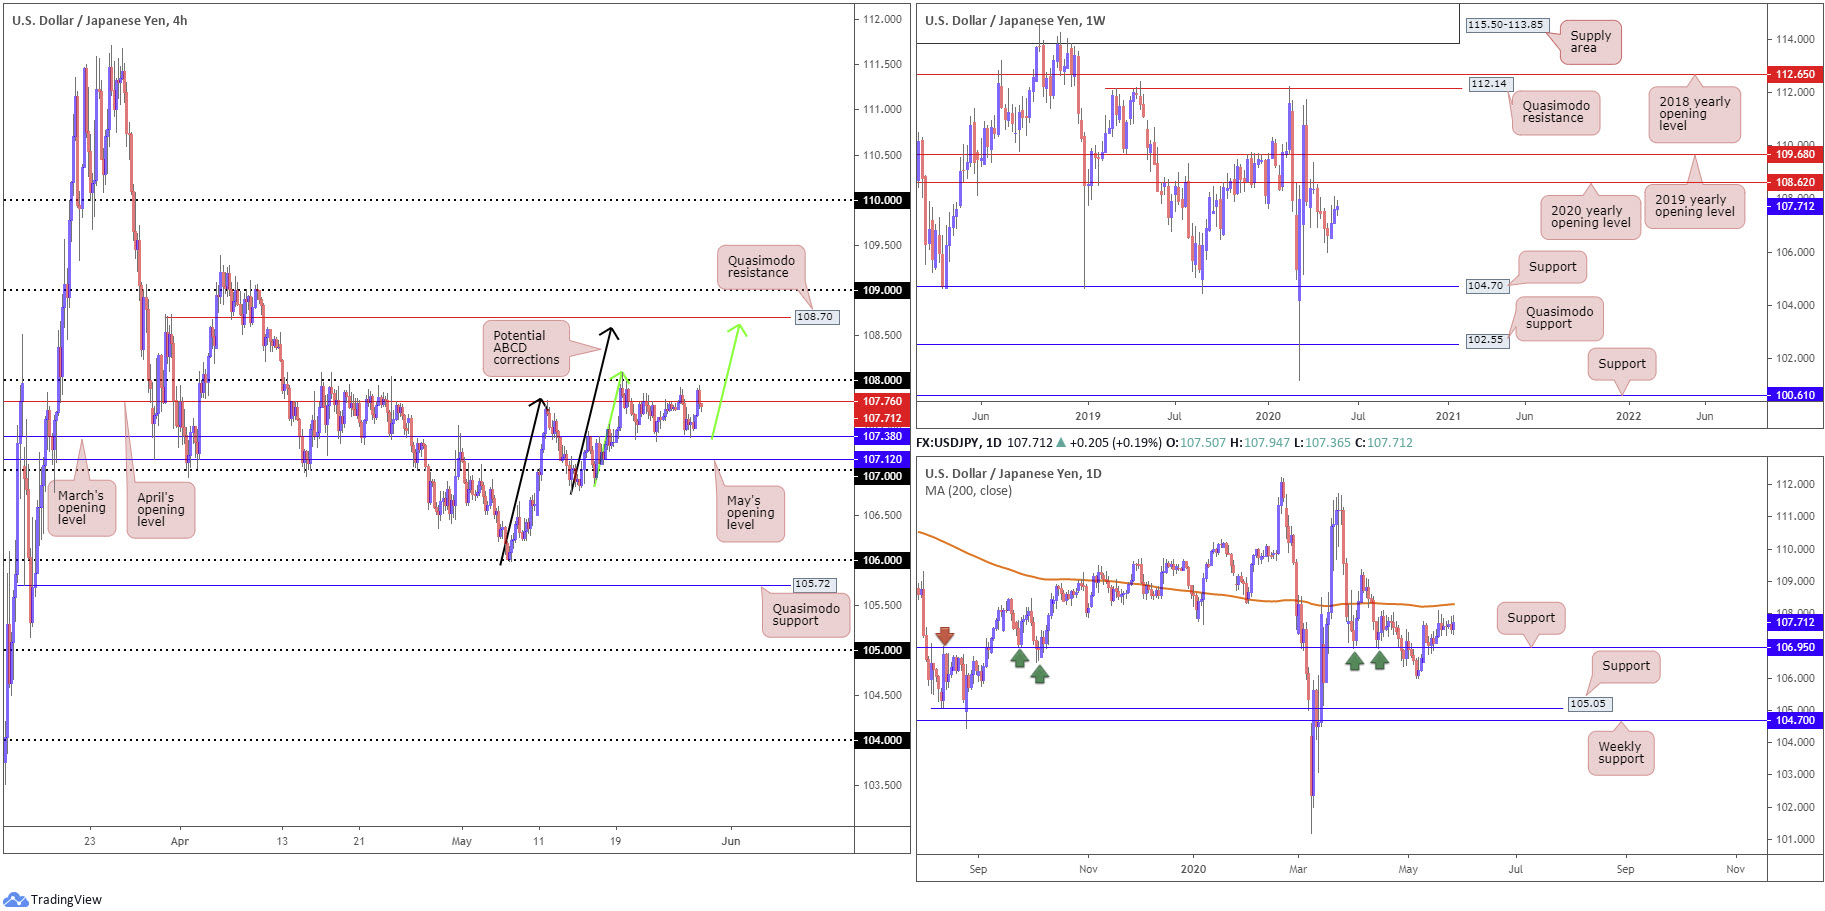
Since last Wednesday, the H4 candles have been enclosed, albeit not perfectly, inside March’s opening level at 107.38 and April’s opening level at 107.76. A break above the upper boundary of the aforementioned range exposes 108. Also of interest, above 1.08 we have two ABCD bearish patterns (black/green arrows) merging around 108.60ish, sited just south of Quasimodo resistance at 108.70. Space beneath the range, however, has May’s opening level at 107.12 to target.
Technical action on the weekly timeframe, following two consecutive weeks of gains, concluded within close proximity of the 2020 yearly opening level at 108.62. Continued bidding, moves that overthrow sellers at 108.62, nudges the 2019 yearly opening level at 109.68 into sight. A rotation to the downside from current price, nevertheless, has the 105.98 May 6 low in view, followed by support at 104.70.
On the daily timeframe, we can see price recently shook hands with support at 106.95, after dipping from three-week tops at 107.76. Since then, price has been kicking its heels within striking distance of the 200-day SMA (orange – 108.29), with a break exposing the 109.38 April 6 high.
Areas of consideration:
Lower-timeframe players may find use in noting the H4 range between 107.76/107.38 as potential levels to consider today.
A fakeout through 108 into the 200-day SMA at 108.29 is a potential scenario possibly interesting sellers. Buy-stops contained above 108 may provide enough fuel to sell. Conservative traders, however, may seek a H4 close beneath 108 before committing.
The H4 ABCD corrections at 108.60 also marks an interesting reversal zone, an area boasting a close relationship with H4 Quasimodo resistance at 108.70 and weekly resistance at 108.62 (the 2020 yearly opening level).
USD/CAD:
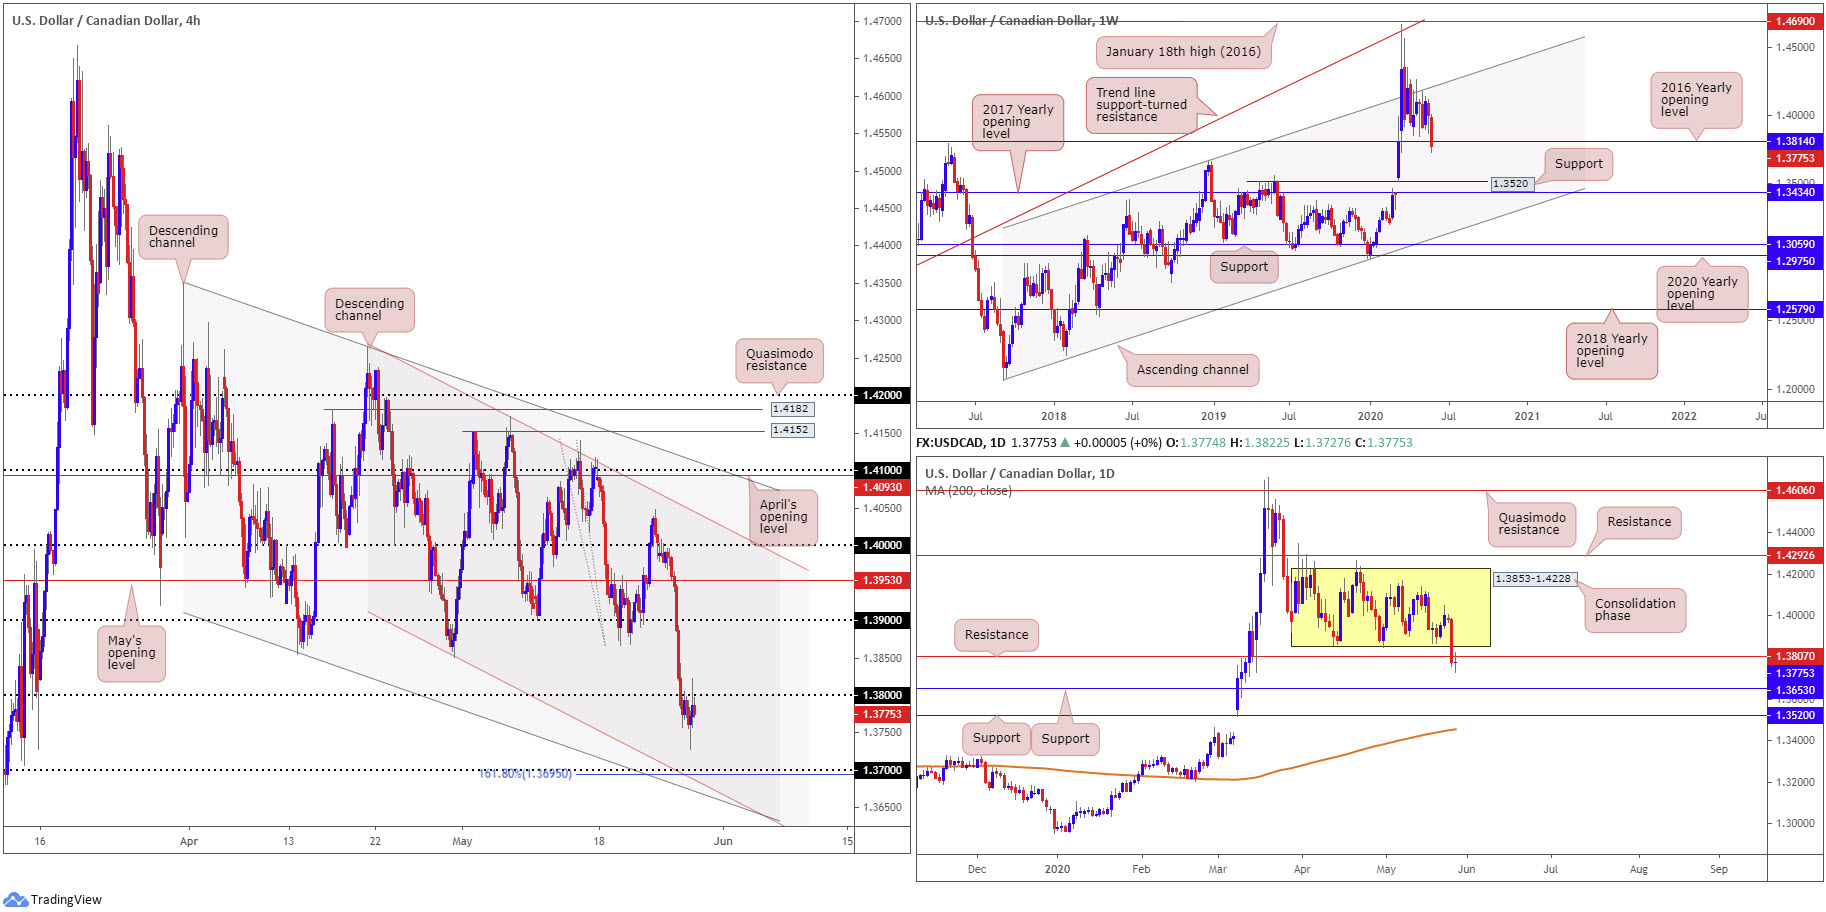
Following Tuesday’s precipitous 1.5% decline, downside momentum subsided Wednesday, hugging the lower edge of 1.38 on the H4 timeframe. This turns the spotlight to 1.37, and a 161.8% Fibonacci extension point at 1.3695 as well as two channel supports, taken from the low 1.3855 and 1.3850.
Further out on the weekly timeframe, support, in the shape of the 2016 yearly opening level, at 1.3814 is currently in motion. Further downside perhaps sets the stage for a run to support at 1.3520 (a prior Quasimodo resistance level).
Since April, price action on the daily timeframe has been carving out a consolidation between 1.3853-1.4228. In the form of a near-full-bodied bearish candle, Tuesday tunnelled through the lower edge of the current range and also took on nearby support coming in at 1.3807. Wednesday held the underside of the noted support as resistance, albeit closing in the shape of an indecision candle. The next port of call on the daily chart can be found at support from 1.3653.
Areas of consideration:
Assuming buyers take a back seat at the 2016 yearly opening level at 1.3814, sellers likely have the upper hand going forward. As a result, the retest at 1.38 as resistance will likely tempt sellers into the market today, targeting 1.37 as an initial downside target, followed by daily support at 1.3653.
USD/CHF:
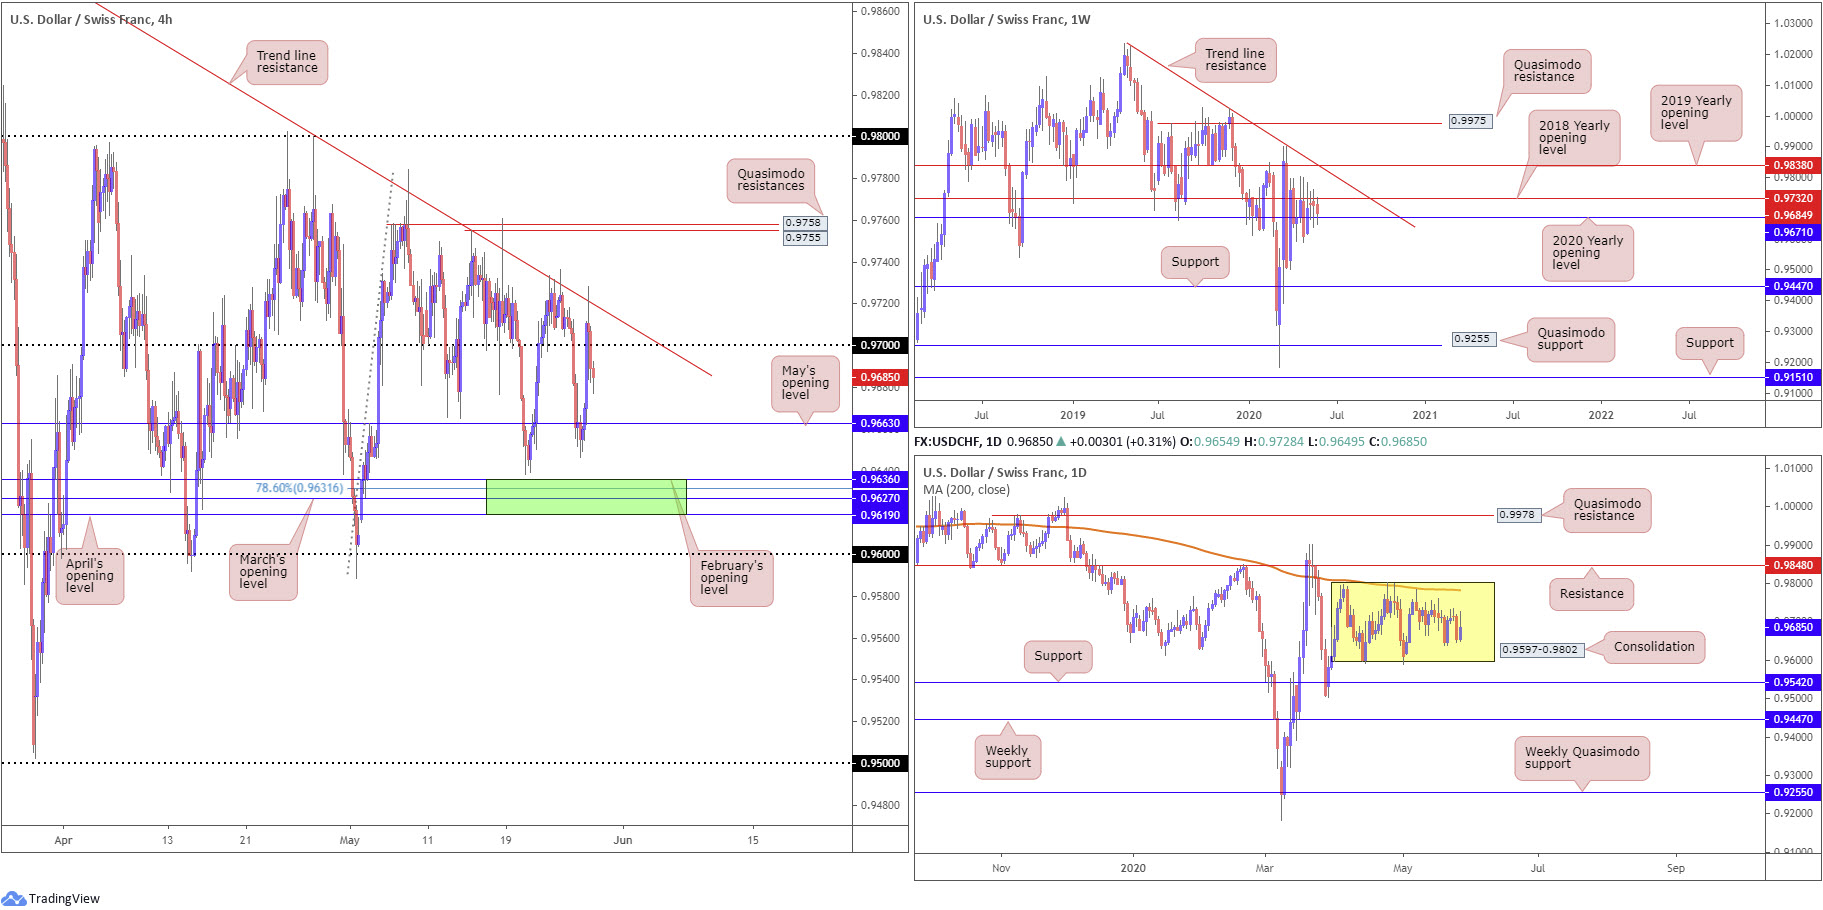
Despite Wednesday latching onto a healthy bid, USD/CHF continues to echo a defensive tone under H4 trend line resistance, taken from the high 0.99. Moves off the noted trend line delivered H4 candles beneath 0.97, throwing May’s opening level at 0.9663 back into the frame as feasible support today. As a reminder, beneath the said base, chart studies has 0.9619/0.9636 (green) in view, an area made up of April, March and February’s opening levels. Above the trend line, nevertheless, two Quasimodo resistance levels are seen at 0.9758 and 0.9755.
Higher up on the curve, longer-term flow based on the weekly timeframe continues to range between the 2020 yearly opening level at 0.9671 and familiar resistance at 0.9732, the 2018 yearly opening level. Technical structure above 0.9732 is seen at the 2019 yearly opening level drawn from 0.9838 and trend line resistance, taken from the high 1.0226. Moves south of 0.9671 shifts focus to support at 0.9447.
Since early April, price action on the daily timeframe has seesawed between 0.9802/0.9597, with current price circling mid-range levels. Traders may also want to acknowledge the 200-day SMA (orange – 0.9782), joining the upper border of the aforementioned range. Outside of the base, traders will note resistance rests at 0.9848 and support from 0.9542.
Areas of consideration:
Retesting the underside of 0.97 is a potential idea worth keeping an eye out for today. A retest in the shape of a H4 bearish candlestick pattern would be particularly appealing to intraday traders, targeting 0.9663 as an initial take-profit zone.
0.9619/0.9636 (green) on the H4 timeframe is also likely to appeal to buyers, owing to the number of technical supports this area attracts.
Alternatively, buyers may find interest in 0.96, knowing the round number intersects with the lower edge of the daily range at 0.9597.
Dow Jones Industrial Average:
US major benchmarks advanced for a fourth consecutive session Wednesday amid increased optimism concerning the COVID-19 pandemic’s possible peak. The Dow Jones Industrial Average climbed 553.16 points, or 2.21%; the S&P 500 gained 44.36 points, or 1.48%, and the tech-heavy Nasdaq 100 concluded higher by 52.07 points, or 0.55%.
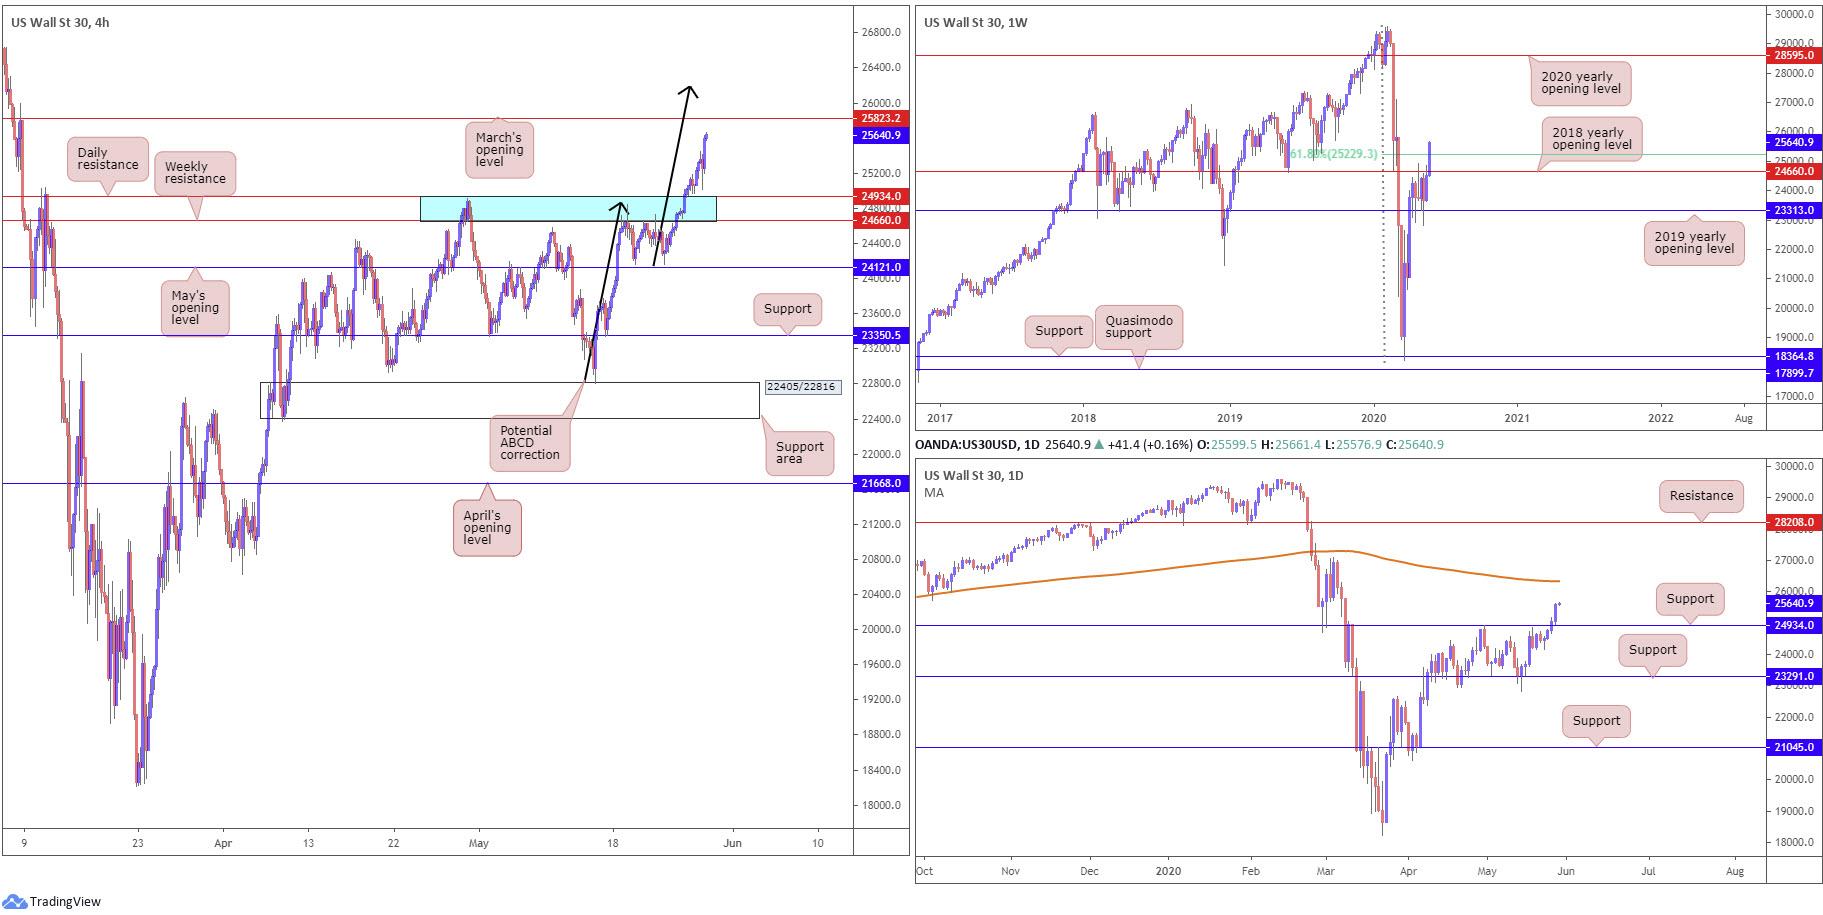
In terms of the technical landscape on the weekly timeframe, demand lifted price action through a 61.8% Fibonacci retracement ratio at 25229. Sustained upside here could have the 2020 yearly opening level at 28595 make an appearance.
A closer reading on the daily timeframe saw movement rush resistance at 24934 (now a serving support) on Tuesday, a level capping downside since early March. The extension to the upside Wednesday has laid the foundation for an approach to the 200-day SMA (orange – 26338).
As for the H4 timeframe, after breaching resistance, a zone comprised of a daily resistance level at 24934 and weekly resistance, by way of the 2018 yearly opening level, at 24660 (blue), March’s opening level at 25823 is in sight today, followed by a possible ABCD (black arrows) bearish completion at 26185.
Areas of consideration:
According to our chart studies, buyers have the upper hand right now.
Limited support exists on the H4 timeframe to base a position, however. As a result, buyers will likely be waiting for a H4 close above March’s opening level at 25823 before pulling the trigger. Although H4 ABCD resistance lurks close by at 26185, the likelihood of at least a pop to the 200-day SMA on the daily timeframe at 26338 is high, therefore providing some room to play with for breakout buyers.
XAU/USD (GOLD):
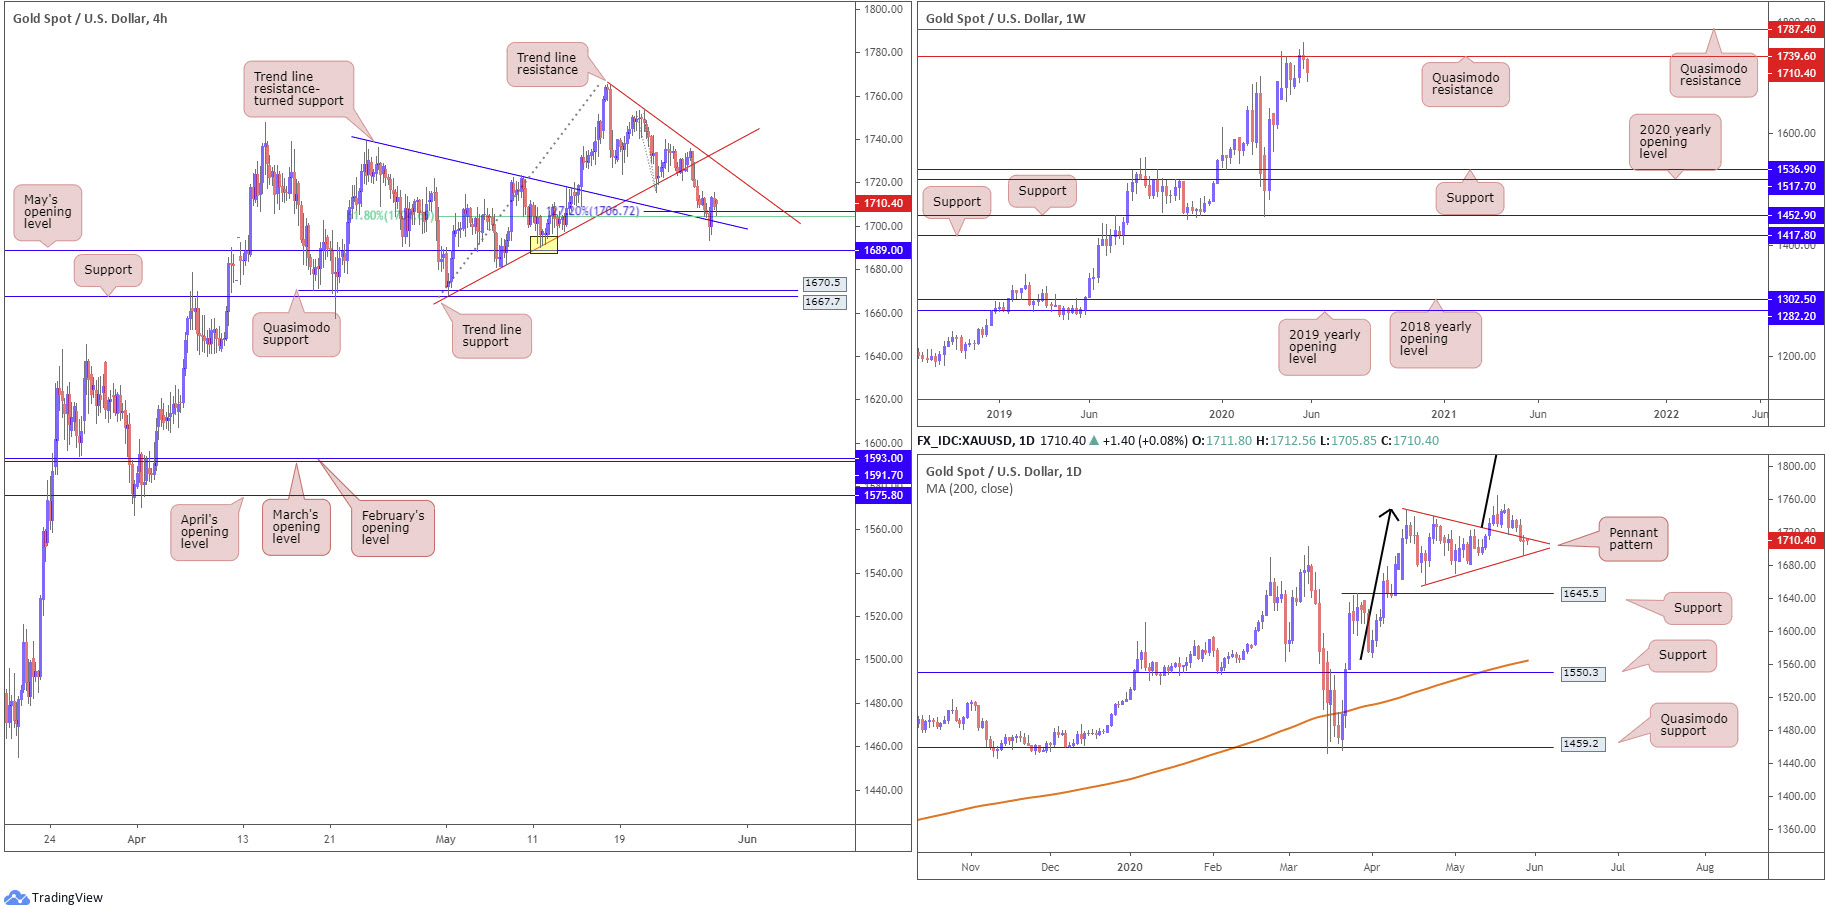
Bullion extended downside Wednesday, scoring session lows of 1693.9 against the buck. Upbeat risk sentiment and a modest USD recovery collectively led H4 candles into a noted area of support: trend line resistance-turned support, taken from the high 1739.1, which comes with a 61.8% Fibonacci retracement ratio at 1704.7 and a 127.2% Fibonacci extension point at 1706.7. As evident from the chart this morning, the said levels contained downside, despite probing to 1693.9. The next upside target from this point can be seen in the shape of a trend line resistance, taken from the high 1765.1.
The technical landscape on the weekly timeframe has, from mid-April, seen buyers and sellers battle for position around the underside of Quasimodo resistance at 1739.6. Clearance of this base places another layer of Quasimodo resistance on the hit list at 1787.4. It may also interest some traders to note the trend on gold has faced a northerly trajectory since 2016.
The daily timeframe offers chart pattern enthusiasts a bullish pennant configuration, established from a high of 1747.7 and a low coming in from 1658.1. Recent selling, nonetheless, positions the noted pattern under pressure, with its lower edge likely sheltering protective stop-loss orders from those long the pattern’s breakout. In the event buyers recover from this point, take-profit targets out of pennant patterns are measured by taking the preceding move (black arrows) and adding the value to the breakout point. This offers a sizeable take-profit, coming in at 1909.4.
Areas of consideration:
A combination of H4 trend line resistance-turned support, taken from the high 1739.1, the H4 61.8% Fibonacci retracement ratio at 1704.7, a H4 127.2% Fibonacci extension point at 1706.7 and the daily pennant pattern may be enough to turn things around in this market today. Ultimately, buyers would want to at least see H4 trend line resistance (1765.1) taken out before reducing risk to break even or taking partial profits.
Conservative buyers, on the other hand, will likely wait until we close above the aforementioned H4 trend line resistance before pulling the trigger.
The accuracy, completeness and timeliness of the information contained on this site cannot be guaranteed. IC Markets does not warranty, guarantee or make any representations, or assume any liability regarding financial results based on the use of the information in the site.
News, views, opinions, recommendations and other information obtained from sources outside of www.icmarkets.com.au, used in this site are believed to be reliable, but we cannot guarantee their accuracy or completeness. All such information is subject to change at any time without notice. IC Markets assumes no responsibility for the content of any linked site.
The fact that such links may exist does not indicate approval or endorsement of any material contained on any linked site. IC Markets is not liable for any harm caused by the transmission, through accessing the services or information on this site, of a computer virus, or other computer code or programming device that might be used to access, delete, damage, disable, disrupt or otherwise impede in any manner, the operation of the site or of any user’s software, hardware, data or property.


