
Key risk events today:
Canada Current Account; US Core Durable Goods Orders and Durable Goods Orders m/m; US Prelim GDP q/q; US Pending Home Sales m/m.
(Previous analysis as well as outside sources – italics).
EUR/USD:
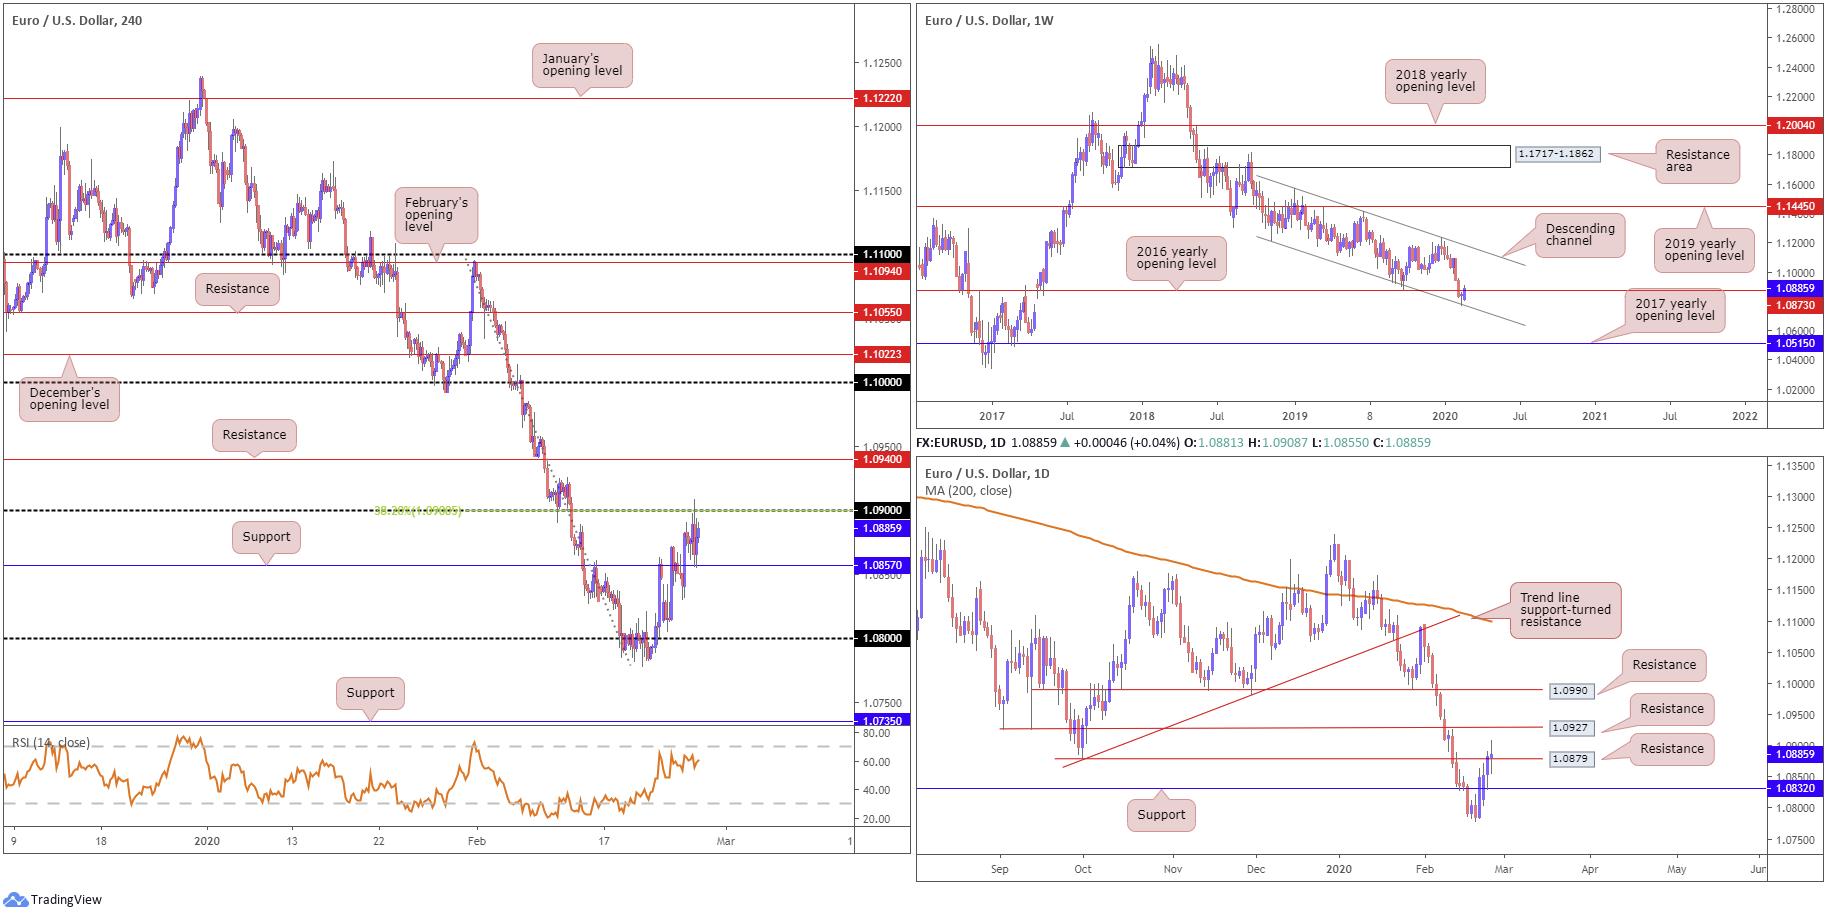
Wednesday had the EUR/USD unchanged at the close of trade in London. A fleeting move north of the 1.09 handle emerged, yet 1.0908 proved challenging to overcome, sending the pair to H4 support at 1.0857. Note 1.09 links with a 38.2% Fibonacci retracement ratio. Beyond 1.09 we can see H4 resistance plotted at 1.0940, while beneath 1.0857, the 1.08 handle is in sight. Indicator-based traders also have the relative strength index (RSI) languishing beneath overbought waters, unable to breach 68.00. The US dollar index attempted to regain a foothold on the 99.00 handle amidst a rebound in US Treasury yields.
Further out, weekly price is testing resistance at 1.0873, formed by way of the 2016 yearly opening level. This follows last week’s rejection off channel support, taken from the low 1.1109, shaped in the form of a bullish hammer candlestick pattern. A move above 1.0873 could eventually see an approach emerge towards channel resistance, extended from the high 1.1569.
The response from the weekly channel support has so far generated relatively enthusiastic upside, reclaiming daily resistance at 1.0832 (now a serving support) and, in recent sessions, testing daily resistance at 1.0879, the October 1st low. A break highlights resistance at 1.0927, followed by another layer of resistance coming in at 1.0990. Yesterday’s action wrapped up somewhat hesitant, chalking up a modest doji indecision candle.
Areas of consideration:
Well done to any readers who remain long north of 1.08; this was a noted setup to watch for last week. Reducing risk to breakeven and banking partial profits remains a priority, given the test at weekly resistance from 1.0873 and daily resistance at 1.0879.
Wednesday’s report noted the following:
A retest at 1.09, knowing it aligns with the 38.2% H4 Fibonacci retracement, could be a layer of resistance worthy of shorts today. Though owing to round numbers being prone to whipsaws, conservative traders will likely pursue additional confirmation before pulling the trigger.
Confirmation to the downside can be found on a H4 close south of support at 1.0857. This could also be considered a trigger to liquidate current long positions.
GBP/USD:
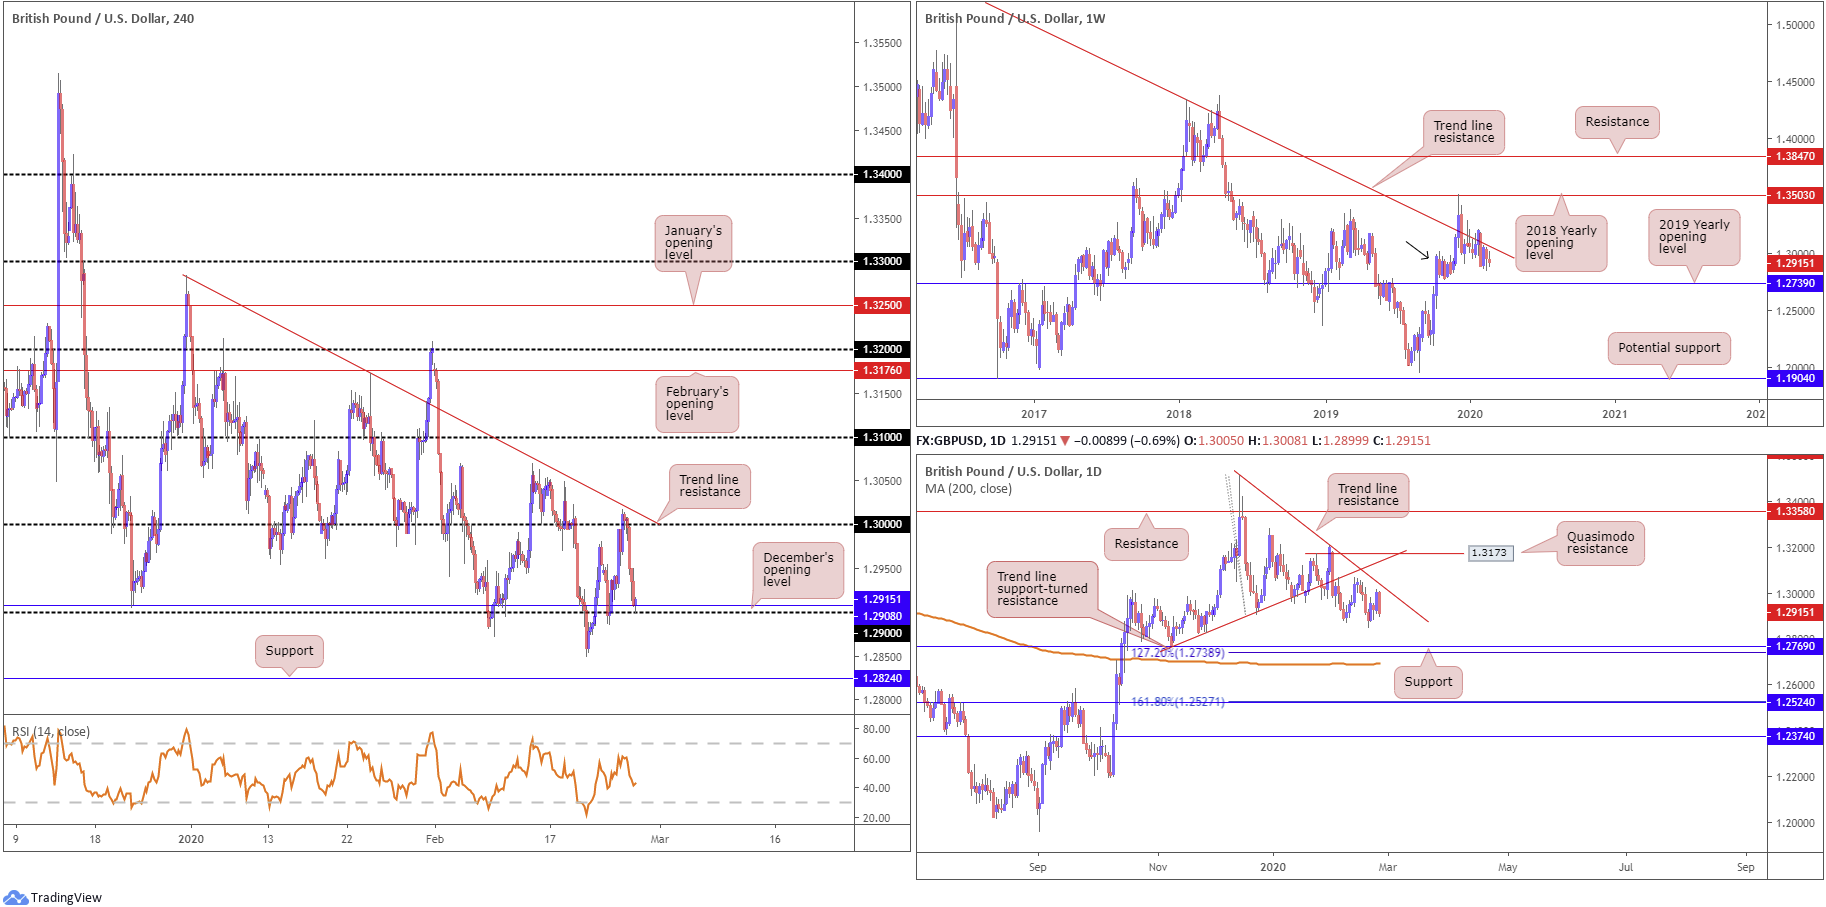
Broad-based dollar upside, along with a rebound in US Treasury yields and uncertainty surrounding the UK’s budget, weighed on sterling Wednesday. Despite dipping a toe in waters north of the key figure 1.30, the H4 candles, leaving trend line resistance, taken from the high 1.3284, unchallenged, fell close to 100 points. December’s opening level at 1.2908 entered view, located a few points ahead of the 1.29 handle. The relative strength index (RSI) reports values beneath 50.0, with the possibility of a run to oversold territory forming.
Weekly price is seen languishing beneath long-standing trend line resistance, pencilled in from the high 1.5930, though demand around the 1.2939 region is also still in motion (black arrow). Continued downside may imply a break of the said demand, tripping sell stops and testing the 2019 yearly opening level at 1.2739. A break higher, on the other hand, could see the 2018 yearly opening level enter the fight at 1.3503.
From the daily timeframe, we can see price turned lower a touch below trend line resistance, taken from the high 1.3514. Further downside from here has support fixed at 1.2769, a 127.2% Fibonacci extension at 1.2738 and the 200-day SMA. Note the said SMA has been flattening since mid-October 2019.
Areas of consideration:
Traders who read Wednesday’s report may recall the following:
Although H4 price invites a possible approach to 1.31, chart studies indicate some reasonably heavyweight resistances before we connect with the said round number: weekly and daily trend line resistances. So, while a break above 1.30 is considered a bullish indication, trade with caution as higher-timeframe sellers may lie in wait. With this being the case, and assuming selling does indeed take over, a H4 close beneath 1.30 could reopen the door for bearish scenarios back to at least the 1.29 region. A retest at the underside of 1.30 would be particularly attractive for sellers, especially if formed by way of a H4 bearish candlestick signal, a shooting star pattern, for example.
Those who sold the break back beneath 1.30 ended Wednesday in healthy profits. A retest to the underside of 1.30 did not materialise unfortunately, seen clearer on the H1 timeframe.
The 1.29 region could prompt a recovery today, yet further selling could also be in store through 1.29 to the 1.2849 February 20th low and H4 support at 1.2824. As such, a H4 close below 1.29 may reopen the door to additional bearish themes.
AUD/USD:
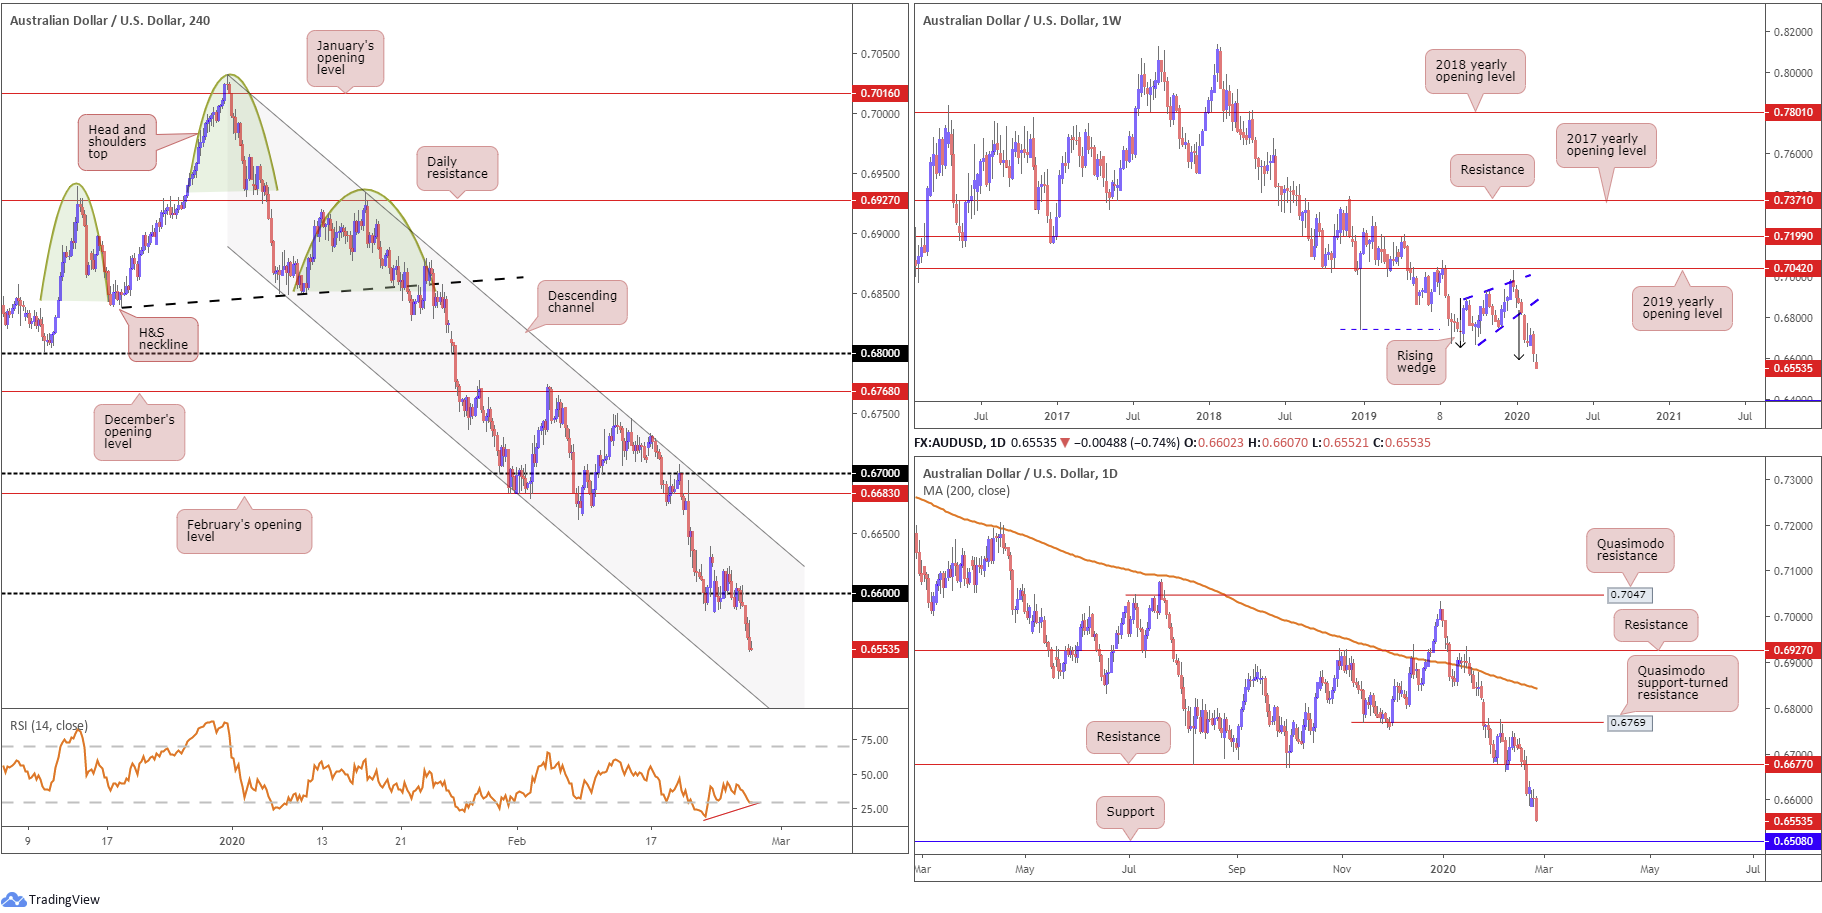
AUD/USD failed to capitalise on broad-based USD weakness Wednesday, drilling to a multi-year low at 0.6552 amid latest coronavirus headlines. Technically, 0.66 on the H4 gave way and underlined a possible test today at channel support, extended from the low 0.6850, shadowed by the 0.65 handle. Note the relative strength index (RSI) is also testing oversold territory, threatening possible bullish divergence (red line).
On a wider perspective, longer-term movement on the weekly timeframe shook hands with a rising wedge take-profit target at 0.6599 (black arrows – calculated by taking the height of the base and adding it to the breakout point) in the later stages of last week. This pattern took five months to complete; well done to any readers who took part. With price nudging marginally beyond this barrier in recent trade, continued downside on this scale has support at 0.6359 (not visible on the screen) to target.
The key observation on the daily timeframe is the taking of support at 0.6677 last week, now a serving resistance level. The next support target beyond 0.6677 falls in around 0.6508.
Areas of consideration:
Those who read Wednesday’s piece may recall the following (italics):
Should 0.66 fall through today, which going by the current state of the H4 candles looks to be the case, breakout sellers likely have eyes for H4 channel support (highlighted above), and the 0.65 handle, which happens to merge with the next daily support target mentioned above at 0.6508.
As such, a decisive H4 close beneath 0.66 will likely entice selling, given the surrounding technical factors. A retest at 0.66 as resistance offers additional confirmation, more so if the H4 rejection candle closes by way of a bearish candlestick signal (entry and risk can then be set according to its structure).
Well done to traders who managed a sell south of 0.66, preferably on the retest seen in early trade yesterday. As highlighted above, H4 channel support is likely next on tap, as is the 0.65 handle and daily support from 0.6508.
USD/JPY:
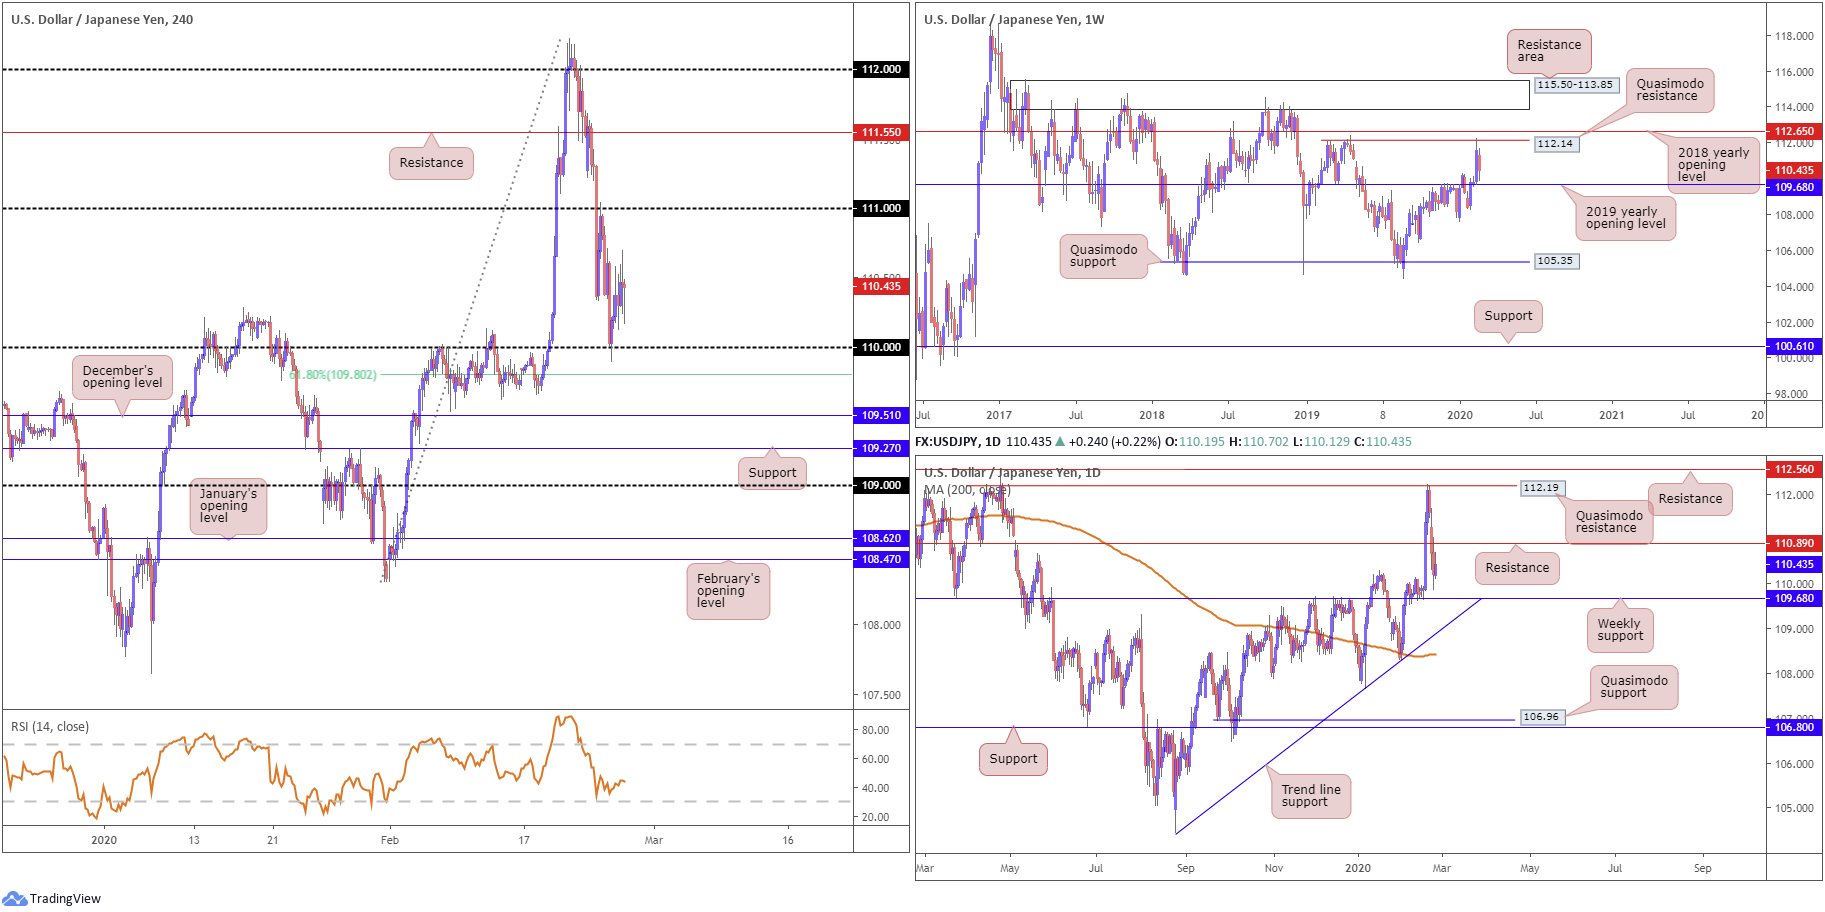
The US dollar finished Wednesday higher against the Japanese yen, snapping a three-day losing streak. The pair caught fresh bids off the 110 handle, lifted by modest bidding in US equities and a rebound in US Treasury yields. The H4 candles, however, struggled to gain much headway past 110.50, possibly threatening another revisit at 110 today.
A 61.8% H4 Fibonacci retracement lurks a few points at the back side of 110 at 109.80, with a violation potentially setting the stage to December’s opening level at 109.51 and support coming in at 109.27. Beyond here, aside from 1.09, limited support is visible until reaching January’s opening level at 108.62.
The weekly timeframe shows the pair delivered a near-full-bodied bullish candle north of the 2019 yearly opening level at 109.68 last week, but encountered resistance off a Quasimodo formation at 112.14, sited just south of the 2018 yearly opening level at 112.65. Recent selling has brought the current weekly candle to within touching distance of the 2019 yearly opening level at 109.68.
In similar fashion to weekly structure, the daily timeframe had price fade Quasimodo resistance at 112.19 at the tail end of the week, located a few points beneath resistance at 112.56. Follow-through selling from this region has been seen this week, rupturing support at 110.89 (now a serving resistance). Despite yesterday’s recovery, the pair is still seen closing in on the weekly support level mentioned above at 109.68.
Areas of consideration:
Well done to any readers who took advantage of bearish themes beneath 112 on Friday; this was a noted move to be aware of. The risk/reward from here is just mouth-watering.
Going forward, 110 is likely to give way, knowing weekly support resides just beneath at 109.68. A test of this weekly base, followed up with a close back above 110 could prompt a recovery in this market, fuelled on the back of sell-stop liquidity taken from beneath 110.
Should we continue pressing higher, though, the combination of the 111 handle on the H4 timeframe and daily support (now serving as resistance) at 110.89 could, once again, provide a ceiling for possible bearish themes.
Dow Jones Industrial Average:
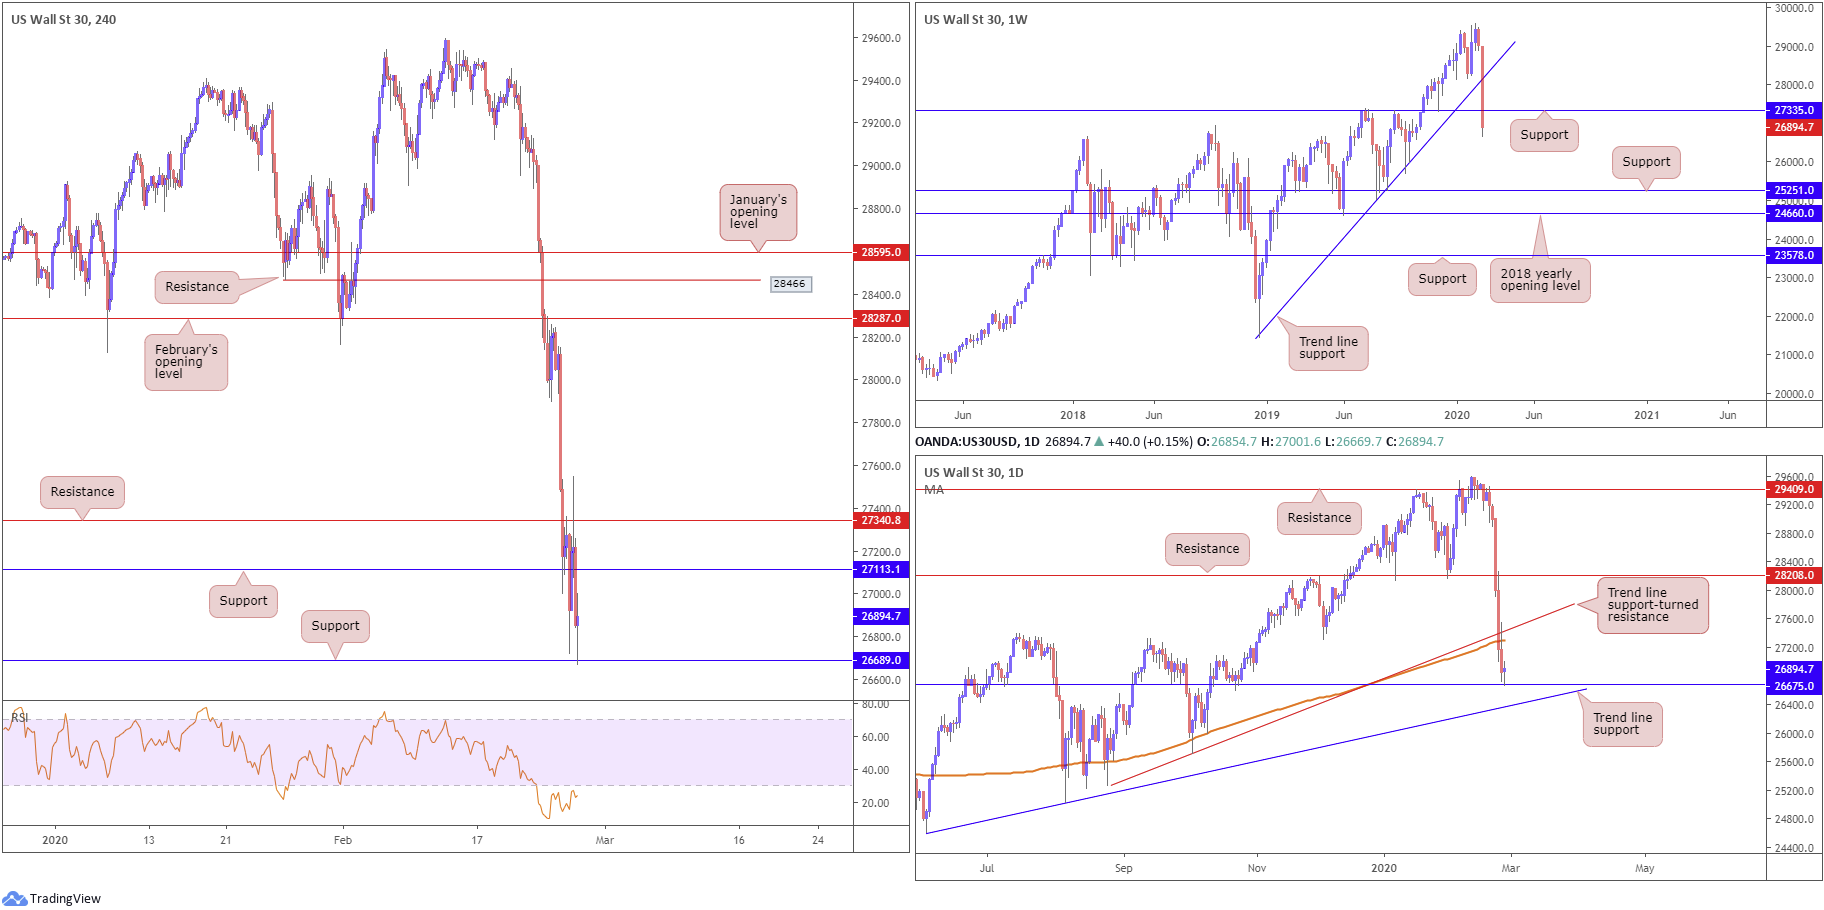
US stocks concluded Wednesday’s session lower as markets digested reports on the spread of China’s coronavirus. The Dow Jones Industrial Average lost 123.77 points, or 0.46%; the S&P 500 declined 11.79 points, or 0.38% and the tech-heavy Nasdaq 100 ended higher by 38.89 points, or 0.44%.
Technically, weekly price is seen navigating ground south of support at 27335. Further downside could be heading for support priced in at 25251, which also represents a Quasimodo formation (left shoulder taken from 25215 March 11th, 2019).
The story on the daily timeframe shows price dethroned both trend line support, taken from the low 25264, and the 200-day SMA (orange – 27292) in recent movement. As of current price, after registering its fifth losing session, the index is seen crossing swords with support at 26675.
Price failed to extend gains off H4 support at 27113, capped by resistance seen close by at 27340. Support at 26689 entered the fight, which as of current price, is holding. Further downside today could bring in support drawn from 26398 (not visible on the screen).
Areas of consideration:
H4 support at 26689 combined with daily support at 26675 could offer the market brief respite today; however, not many traders will likely have conviction in any support level right now, even more so after weekly support at 27335 gave way.
A H4 close below 26689 today could spark another wave of selling in this market. Bearish themes south of this level, therefore, are an option, targeting H4 support at 26398. Conservative traders may consider waiting and seeing if a retest occurs before committing.
XAU/USD (GOLD):
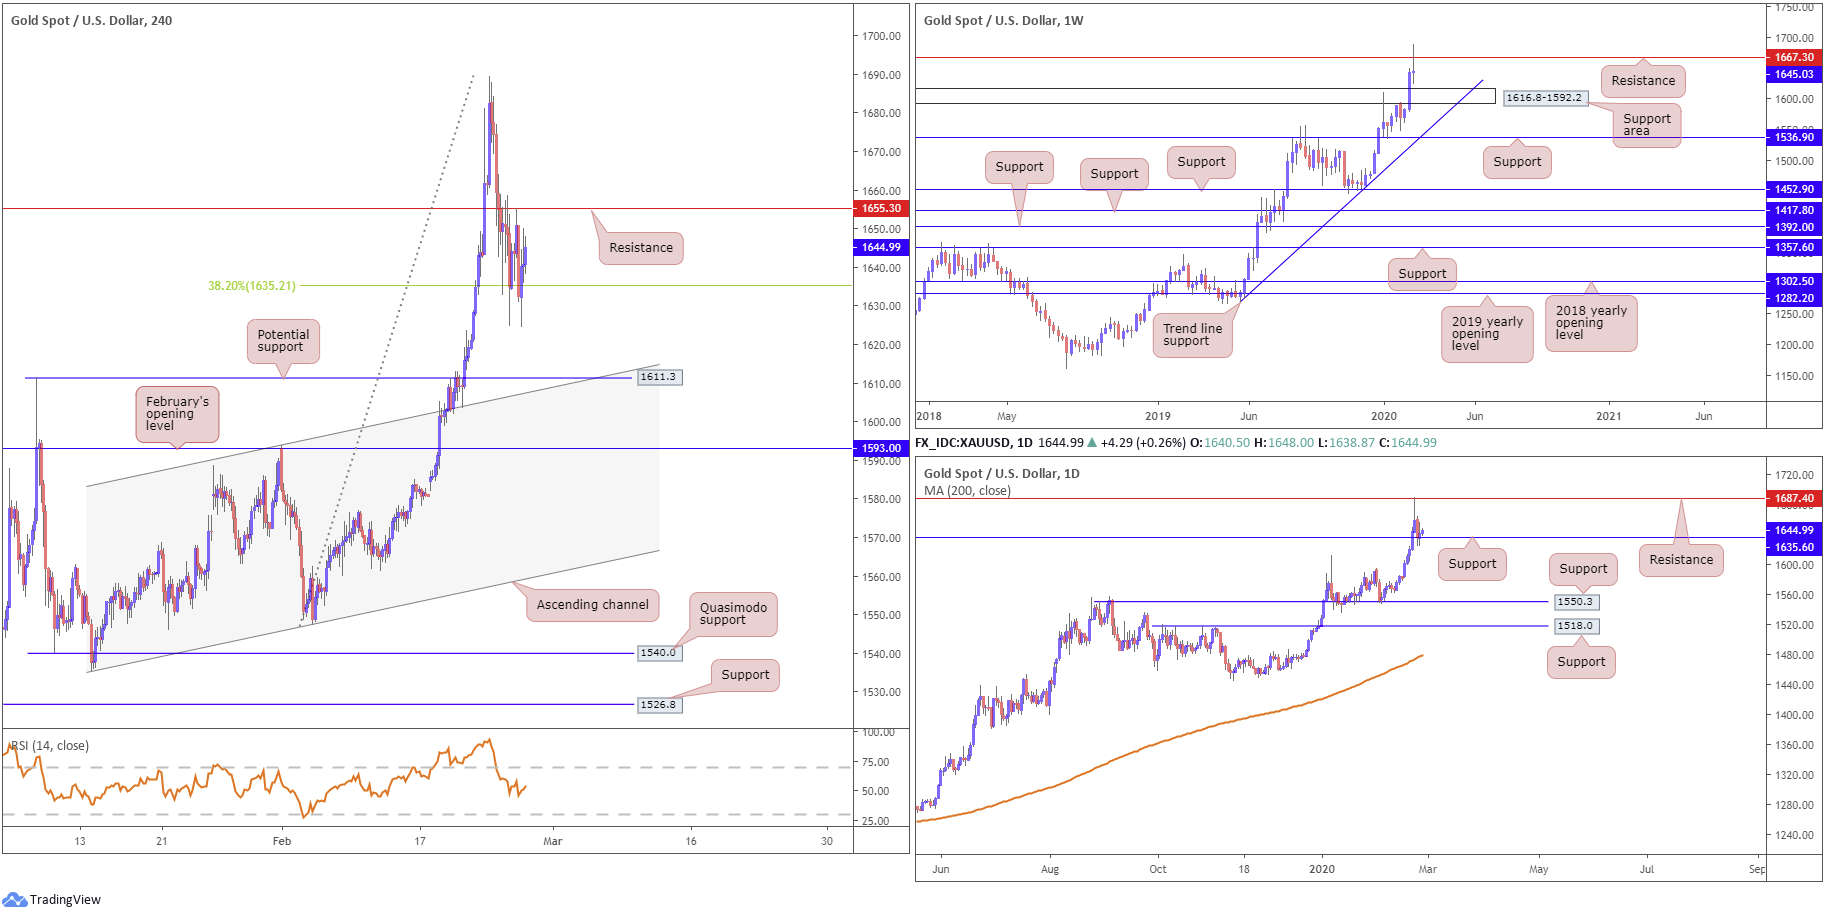
A modest recovery in risk sentiment Wednesday likely helped contain the safe-haven metal south of H4 resistance at 1655.3. Given the lacklustre movement yesterday, however, much of the following points aired here today will echo a similar vibe to Wednesday’s technical briefing.
H4 action continues to find some respite off the 38.2% Fibonacci retracement level at 1635.2. Interestingly, the Fibonacci level aligns with daily support at 1635.6.
H4 Support at 1611.3, which happens to merge with channel resistance-turned support, taken from the high 1593.9, remains a point of interest on this scale. Meanwhile, indicator-based traders may also wish to acknowledge the relative strength index (RSI) is attempting to bottom around the 50.0 value, following a downward move out of overbought territory.
Higher-timeframe action has weekly price fading resistance at 1667.3. Continued selling from here could draw in a support area at 1616.8-1592.2. On the daily timeframe, resistance entered the fold at 1687.4, with support recently making a show at 1635.6.
Areas of consideration:
Daily support at 1635.6 could continue to hold price action higher today. However, the top edge of the weekly support area is also of interest at 1616.8, given it converges closely with H4 support at 1611.3. Both represent valid reversal zones.
Whether additional confirmation, such as candlestick patterns, is needed before pulling the trigger off either of the aforementioned supports is, of course, trader dependent. Traders are, however, urged to recognise we do have weekly resistance in play at 1667.3, despite the primary trend facing north.
The accuracy, completeness and timeliness of the information contained on this site cannot be guaranteed. IC Markets does not warranty, guarantee or make any representations, or assume any liability regarding financial results based on the use of the information in the site.
News, views, opinions, recommendations and other information obtained from sources outside of www.icmarkets.com.au, used in this site are believed to be reliable, but we cannot guarantee their accuracy or completeness. All such information is subject to change at any time without notice. IC Markets assumes no responsibility for the content of any linked site.
The fact that such links may exist does not indicate approval or endorsement of any material contained on any linked site. IC Markets is not liable for any harm caused by the transmission, through accessing the services or information on this site, of a computer virus, or other computer code or programming device that might be used to access, delete, damage, disable, disrupt or otherwise impede in any manner, the operation of the site or of any user’s software, hardware, data or property.


