
Key risk events today:
ECB President Draghi Speaks; BoE Governor Carney Speaks; FOMC Members Bullard and Clarida Speak.
EUR/USD:
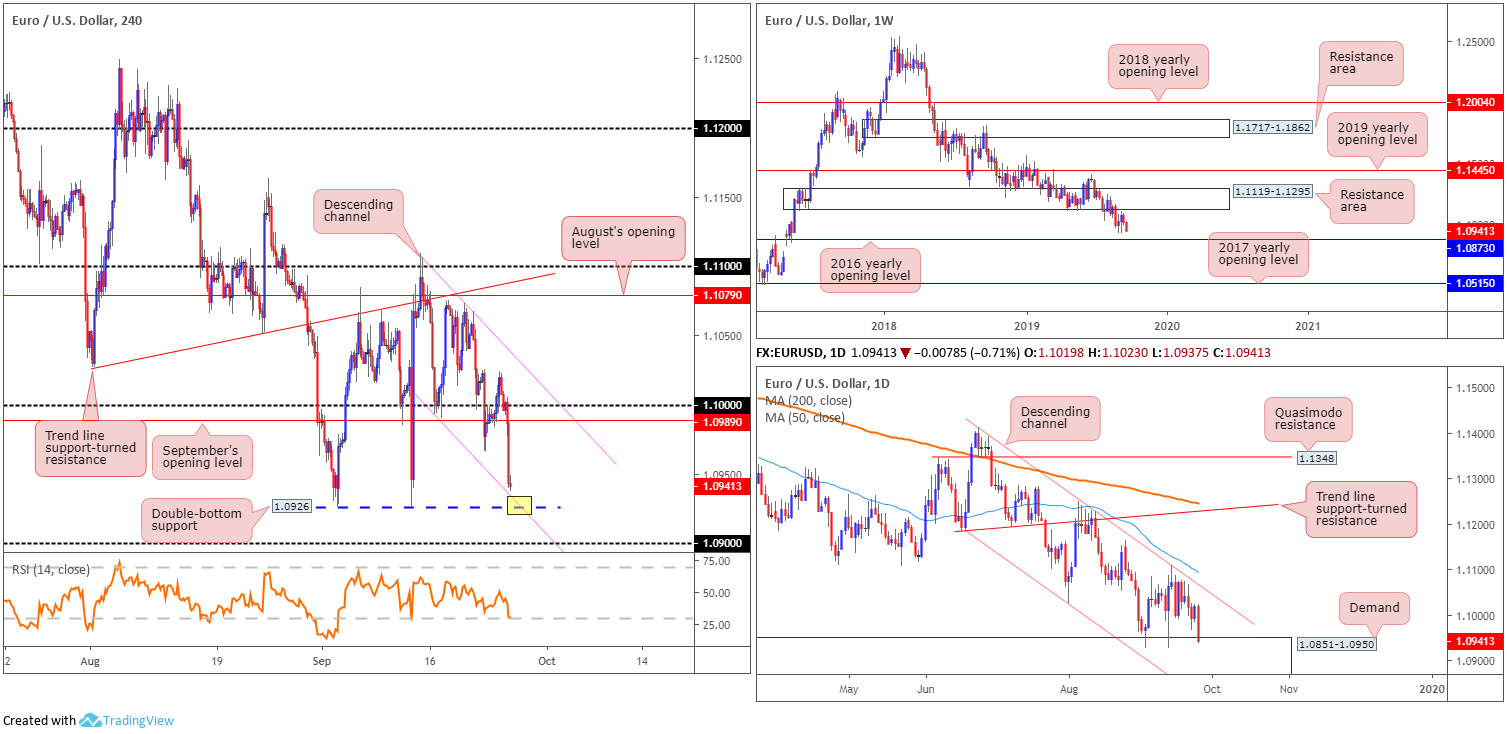
Europe’s single currency curved lower vs. the buck Wednesday, notching losses in excess of 70 points, or 0.68%. The US dollar index rebounded with a vengeance yesterday, enthused by comments from Fed-voter Evans, who took a somewhat more neutral stance as he noted the US economy is ‘quite solid and is posting good growth’. Adding to the EUR/USD’s downbeat tone, US Treasury yields went on the offensive, with the 10-year note snapping a seven-day losing streak in strong fashion.
Traders long north of 1.10 yesterday were wiped out, with limited opportunity to recover. In the space of two back-to-back H4 bearish candles, price engulfed 1.10 and September’s opening level at 1.0989, consequently concluding the session closing a few points north of channel support (extended from the low 1.0993), closely followed by a double-bottom support at 1.0926.
Against the backdrop of medium-term flow, higher-timeframe structure remains poised to approach support on the weekly timeframe, priced in the form of the 2016 yearly opening level at 1.0873. Closer analysis on the daily timeframe has price action pecking at the top edge of demand drawn from 1.0851-1.0950, which happens to house the said 2016 yearly opening level within its lower limits. Also worthy of note is the daily candles have remained compressing within a descending channel formation since late June (1.1412/1.1026).
Areas of consideration:
The point H4 double-bottom support at 1.0926 and channel support merge is potentially of interest for a bounce today (yellow), having seen the configuration bolstered by daily demand highlighted above at 1.0851-1.0950. Traders, however, are urged to consider waiting for additional confirmation to form off 1.0926 before pulling the trigger, since a fakeout through the level to 1.09 may occur, and weekly price suggests we may head for deeper terrain within the said daily demand.
GBP/USD:
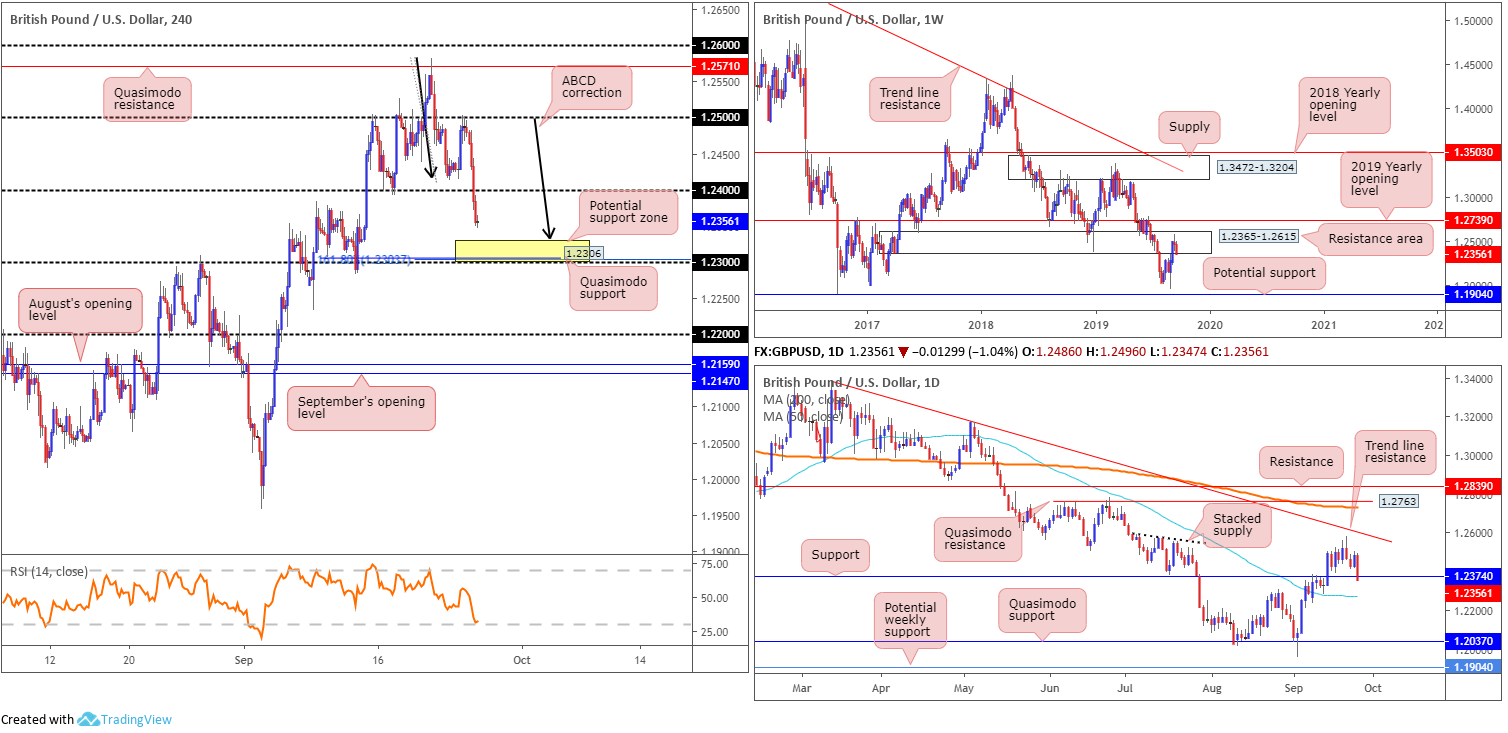
A clear underperformer in the G10 space Wednesday, the British pound fell sharply as Parliament returned to business, following the UK Supreme Court ruling PM Johnson’s prorogation of Parliament as unlawful on Tuesday. The firmer greenback also weighed on the pound, nudging the H4 candles sub 1.24 and just north of a particularly interesting area of support (yellow – 1.23/1.2331) combined of an ABCD correction point at 1.2331, the round number 1.23, a Quasimodo support at 1.2306 and a 161.8% Fibonacci ext. point at 1.2303.
In terms of where we stand on the bigger picture, however, weekly activity is visibly responding from a resistance area coming in at 1.2365-1.2615. Support from this angle is not expected until reaching the 1.1904 neighbourhood – held price strongly higher in October 2016, while a move above the area has the 2019 yearly opening level at 1.2739 in sight. Price action on the daily timeframe has price marginally sub support at 1.2374, possibly clearing the pathway to the 50-day SMA (1.2271).
Areas of consideration:
Entering long from the H4 support area marked at 1.23/1.2331 is likely appealing to many shorter-term traders this morning. Though for those who include higher-timeframe structure within their analysis will likely feel somewhat threatened by a possible fakeout through 1.23 to the 50-day SMA at (1.2271) on the daily timeframe, and the fact we’re coming from a weekly resistance area. This is not to say a long from 1.23/1.2331 is not valid, it’s merely a cautionary metric to consider before committing funds.
Waiting for additional confirmation to form out of 1.23/1.2331 may be worthy of consideration; a hammer candlestick formation, for example. In the event H4 action turns higher from the said support area, 1.24 is considered a logical resistance target.
AUD/USD:
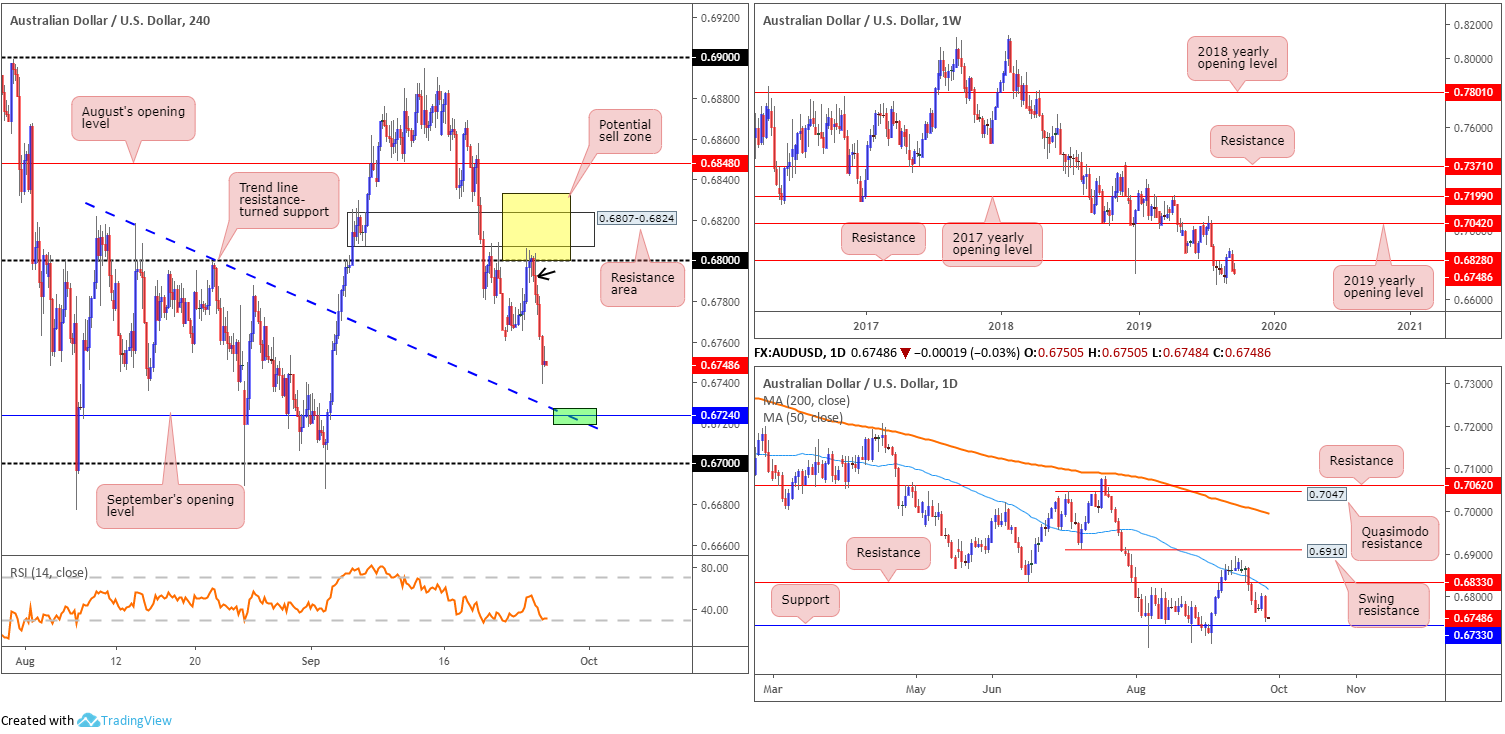
Despite Tuesday’s reasonably firm close, the Australian dollar ceded ground to its US counterpart Wednesday, slumping to its lowest level in three weeks and down more than 50 points, or 0.77%. The primary driver behind the selloff was a resurgence in dollar bidding, with the buck gathering steam on surging US Treasury yields.
For traders who read Wednesday’s technical briefing you may recall the piece highlighted the following:
Lowe’s remarks prompted a run higher in AUD/USD prices, whipsawing through 0.68 on the H4 timeframe, though missed the nearby resistance area at 0.6807-0.6824. Beyond this zone, we have weekly resistance nearby at 0.6828, then daily resistance plotted at 0.6833 and the 50-day SMA (blue at 0.6824), followed by August’s opening level at 0.6848 on the H4. As you can see, several layers of resistance reside close by.
With a range spanning between daily resistance at 0.6833 and the 0.68 handle on the H4, this area is comprised of a reasonably formidable combination of resistances. Therefore, the yellow H4 zone, labelled ‘potential sell zone’, is an area sellers are expected to enter the mix. Watching for a H4 bearish candlestick signal to form is a potential entry trigger, though traders are urged to follow their trading plan in terms of confirmation entry techniques.
As evident from the H4 timeframe, yesterday’s flow chalked up a bearish outside candle formation (black arrow) and proceeded to discover lower ground. Well done to any of our readers who managed to catch this move.
Areas of consideration:
Traders short this market likely have their radar fixed on 0.6733 as the initial downside target: daily support. This falls in closely with a H4 trend line resistance-turned support and September’s opening level at 0.6724. Beyond here, the 0.67 handle enters the fold.
Should the H4 candles test the point 0.6724 converges with the trend line resistance-turned support (green), not only will this likely be considered a take-profit zone, active buyers will potentially look to long this market from here. Therefore, keep eyes on this area today for signs of buying, preferably in the form of a bullish candlestick formation (traders then have the option of calculating entry and risk based on this structure).
USD/JPY:
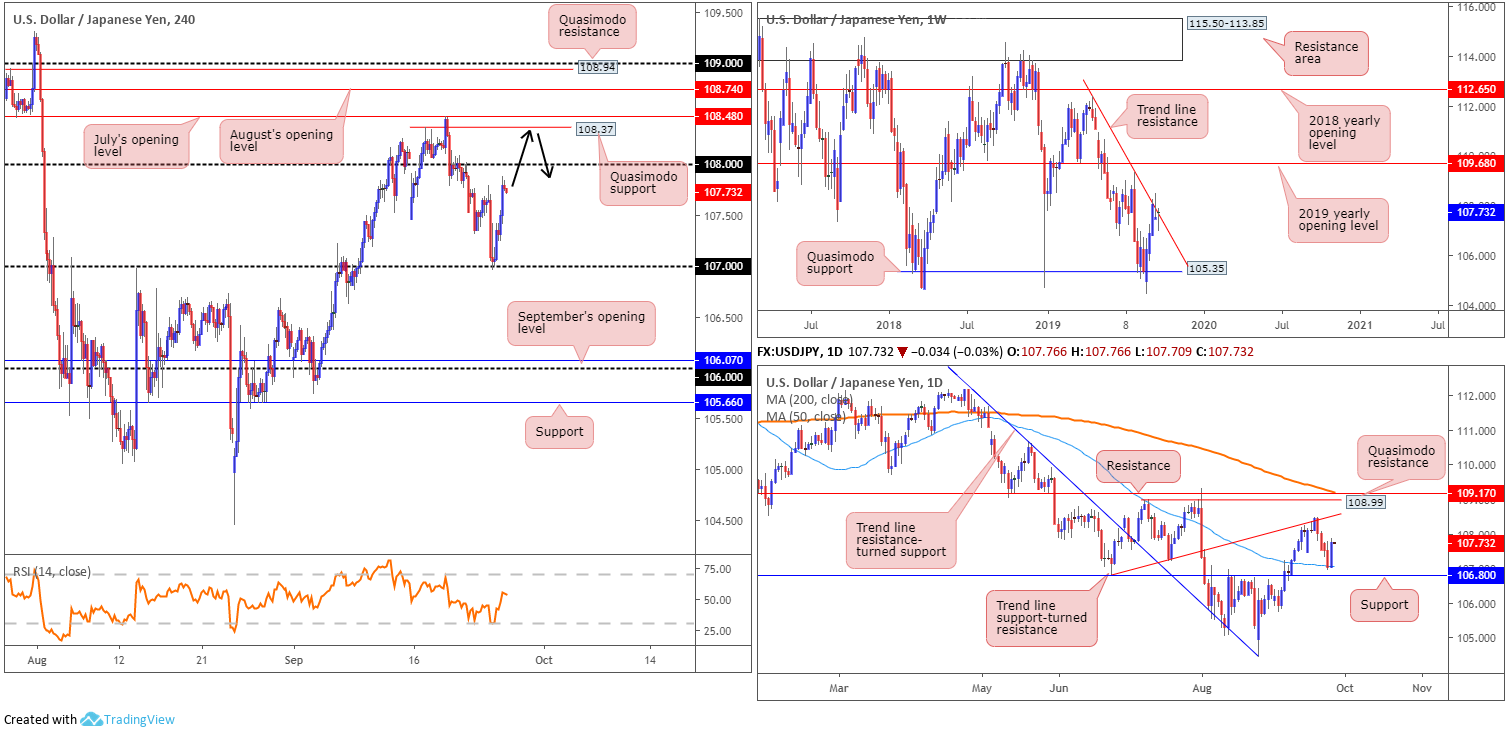
The safe-haven Japanese yen wrapped up Wednesday on the ropes against the US dollar, with USD/JPY movement establishing firm support off the 107 handle. Bolstered by upbeat market sentiment and rising US Treasury yields, the pair enters Asia Pac hours facing a potential test of 108.
Higher-timeframe flow shows additional support came in the form of the 50-day SMA (blue – 107.04) yesterday, which, on the daily scale, could mean a run back up to trend line support-turned resistance (taken from the low 106.78). The interesting thing is weekly price remains trading around trend line resistance extended from the high 112.40.
Areas of consideration:
Despite the stronger-than-expected recovery off 107, buy stops above 108 are likely of interest this morning for a possible short off H4 Quasimodo resistance at 108.37. This is also based on the fact the market remains toying with trend line resistance on the weekly timeframe. Entry at 108.37 is an option, with a protective stop-loss order positioned above either July or August’s opening levels at 108.48 and 108.74, respectively, dependent on risk appetite. Downside expectation falls on a break back beneath 108. This would be a good time to think of reducing risk to breakeven and liquidating a portion of the position.
USD/CAD:
Rising US Treasury yields as well as waning oil prices undermining the Canadian dollar saw USD/CAD movement gravitate higher and reclaim Tuesday’s losses.
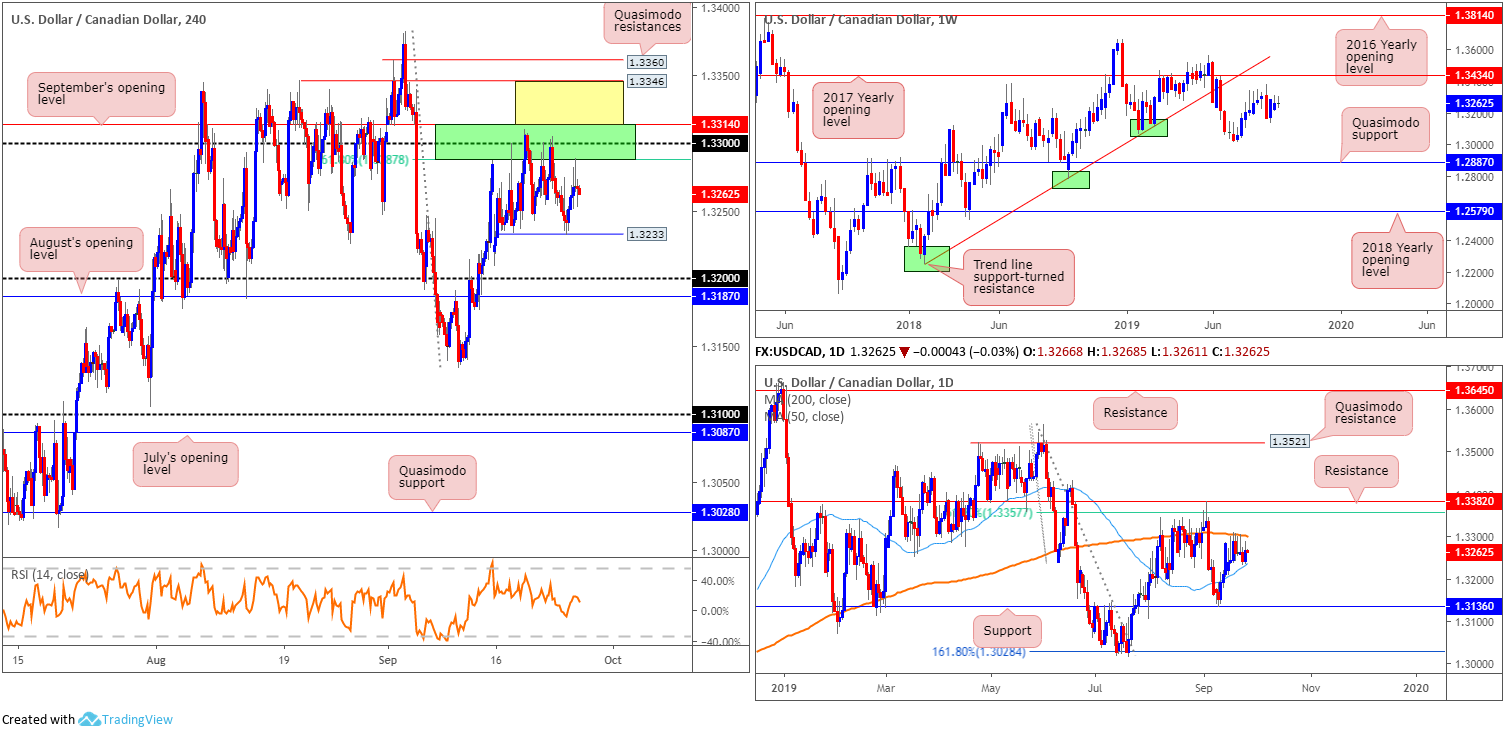
Kicking things off from the top this morning, technical research has weekly price languishing south of resistance priced in at 1.3434: the 2017 yearly opening level. Daily action, on the other hand, is tightly confined between the 200-day SMA (orange – 1.3301) and the 50-day SMA (blue – 1.3236). Outside of this range, traders likely have their crosshairs fixed on support coming in at 1.3136 and resistance drawn from 1.3382, sited just north of a 61.8% Fibonacci ratio at 1.3357.
Across the page on the H4 timeframe, the pair remains entrenched within a consolidation formed from a resistance area comprised of September’s opening level at 1.3314, the round number 1.33 and the 61.8% Fibonacci ratio at 1.3287 (1.3314/1.3287), supported further by the 200-day SMA highlighted on the daily timeframe, and local support at 1.3233.
Areas of consideration:
Seeing both weekly and daily timeframes trade directionless at the moment casts a difficult line over medium-term direction, even more so when H4 price is also entrenched within a consolidation.
The area marked yellow on the H4 timeframe between H4 Quasimodo resistance at 1.3346 and September’s opening level at 1.3314 is considered a ‘fakeout zone’. A run through 1.3314 will likely fill a huge number of buy stops and provide liquidity for a potential sell off either 1.3346, or another layer of Quasimodo resistance at 1.3360 (merges with the 61.8% Fibonacci ratio on the daily timeframe at 1.3357). Stop-loss placement is likely eyed above the high set at 1.3382.
USD/CHF:
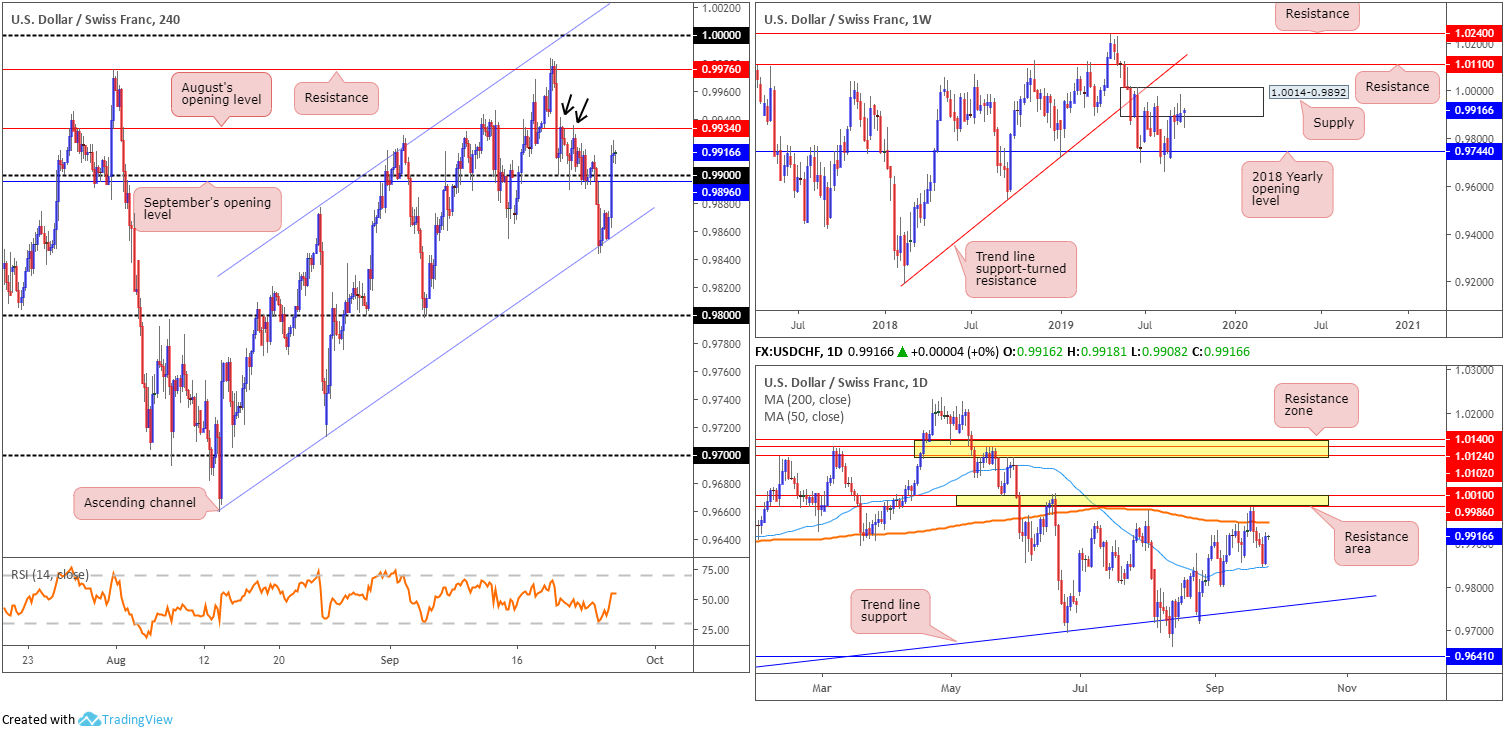
Recovering US Treasury yields together with healthy dollar bidding across the board, Wednesday saw the USD/CHF rebound strongly off H4 channel support (extended from the low 0.9659) and climb north of the 0.99 mark. Overhead, traders face immediate resistance in the shape of August’s opening level at 0.9934 – note how well it served as resistance last week (black arrows) – with a break of this level likely exposing H4 resistance priced in at 0.9976.
With respect to higher-timeframe movement, weekly price has action engaging with familiar supply coming in at 1.0014-0.9892. This is the second time back to the area; therefore, its strength may be compromised and force a move to resistance at 1.0110/trend line support-turned resistance (etched from the low 0.9187). A rotation lower from here, nevertheless, has the 2018 yearly opening level at 0.9744 in view.
Closer examination of price action on the daily timeframe reveals the pair rebounding from a 50-day SMA (blue – 0.9848), with Wednesday closing a short walking distance from the 200-day SMA (orange – 0.9948), followed closely by a resistance area coming in at 1.0010/0.9986.
Areas of consideration:
This morning likely has shorter-term traders eyeing a retest play off 0.99, with August’s opening level at 0.9934 set as the initial upside target, followed by the 200-day SMA. While this is certainly a possibility, weekly price residing within supply, albeit yet to produce anything meaningful to the downside, is concerning.
Should the retest of 0.99 form by way of a lower-timeframe bullish candlestick signal, entry and risk can be set according to this structure. Traders are urged to consider risk/reward before committing to a position, targeting at least a 1:1 ratio to the first upside target.
Dow Jones Industrial Average:
US equities firmed Wednesday after US President Donald Trump voiced optimism concerning a trade deal with China, injecting risk-on into trading conditions. The Dow Jones Industrial Average added 162.94 points, or 0.61%; the S&P 500 advanced 18.27 points, or 0.62% and the tech-heavy Nasdaq 100 climbed 93.50 points, or 1.39%.
Traders who read Wednesday’s technical research, the following piece may be familiar:
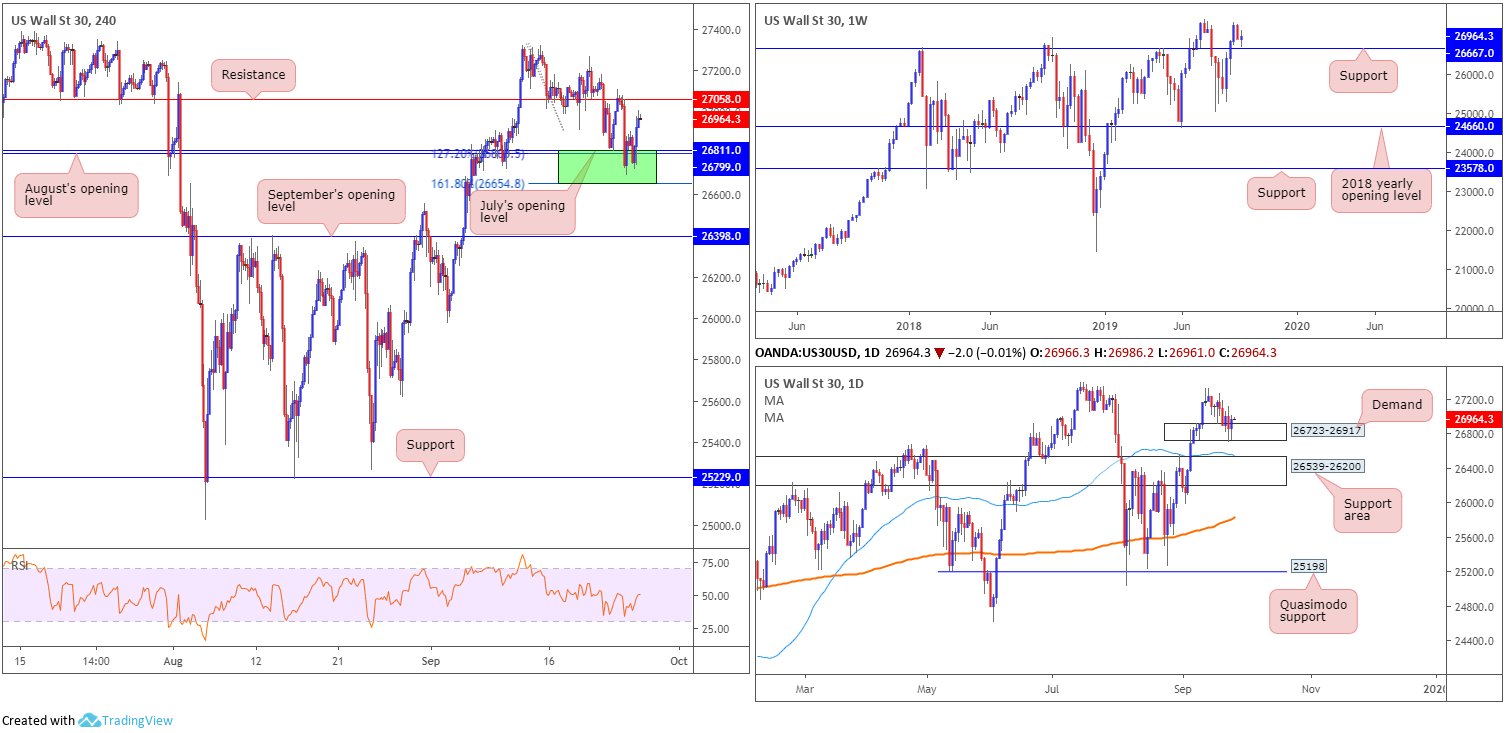
The recent pullback, which from a technical perspective came about off the underside of a H4 resistance level at 27058, landed the H4 candles back within a familiar area of support at 26654/26811, comprised of August and July’s opening levels at 26799 and 26811, respectively, the 127.2% Fibonacci extension value at 26800 and the 161.8% Fibonacci extension at 26654 (green area). This is a particularly appealing area of support having seen it boast a connection to weekly support nearby at 26667 and the current daily demand at 26723-26917.
Longs out of 26654/26811 on the H4 timeframe are certainly a possibility today, in view of the surrounding higher-timeframe confluence and H4 bullish candle recently printed. Entry at current price is an option, with a protective stop-loss order plotted beneath the H4 support zone. The first take-profit target falls in at the said H4 resistance, followed by the all-time high of 27388.
As you can see on the H4 chart this morning, price did indeed advance out of 26654/26811 and concluded the session closing within striking distance of H4 resistance mentioned above at 27058.
Areas of consideration:
Aside from current longs out of 26654/26811, there’s very little to hang our hat on at this point in time.
A test of the H4 resistance is likely to be seen as a cue to reduce risk to breakeven and liquidate a portion of the position for traders long this market. A H4 close above this angle will likely place the index in good stead to reach all time highs set at 27388.
XAU/USD (GOLD):
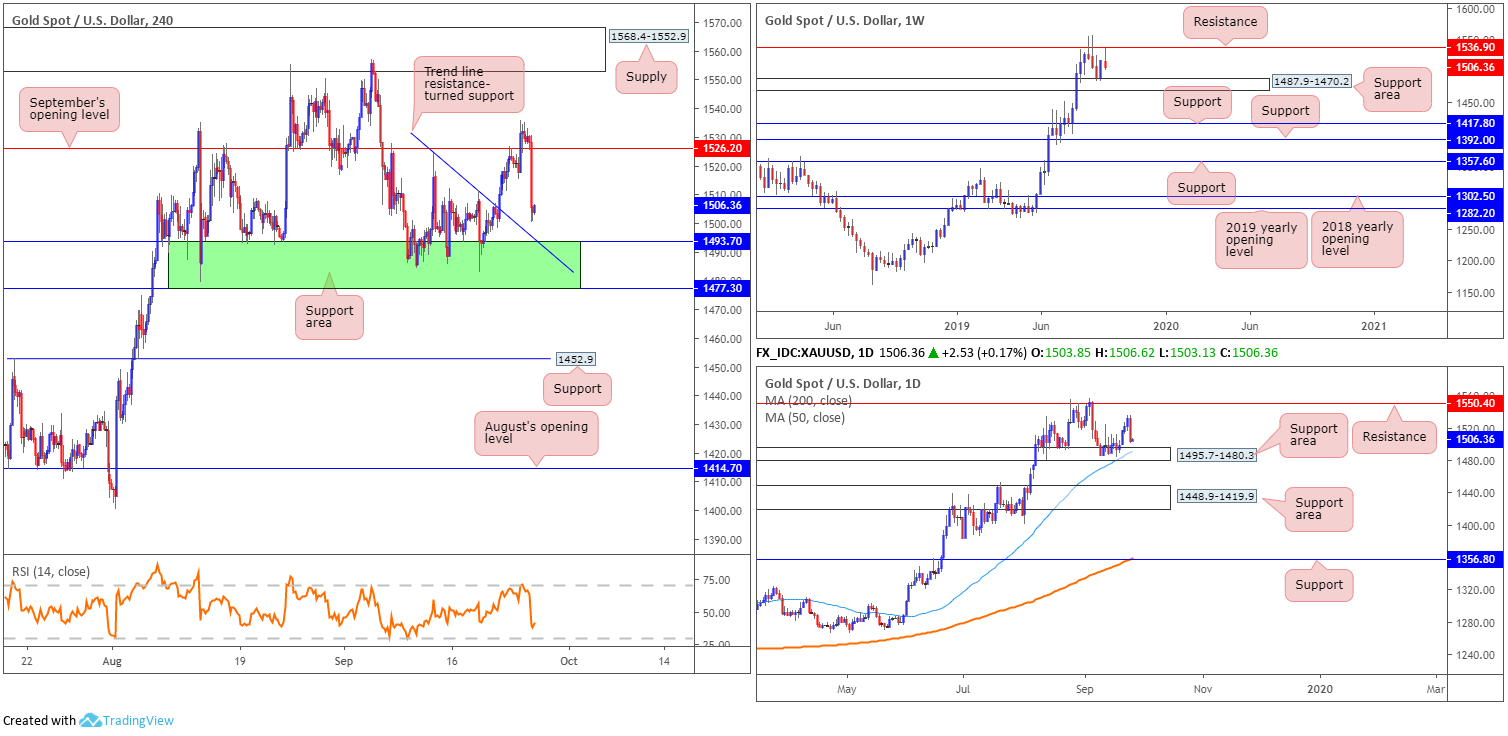
Optimism surrounding a possible US/China trade deal hurled the market into a risk-on environment Wednesday, weighing on the precious metal, down 1.84% against the US dollar. H4 action reclaimed September’s opening level at 1526.2 in robust fashion, clearing out buyers and positioning the unit within touching distance of a familiar support area (green) at 1477.3/1493.7, and local trend line resistance-turned support (pencilled from the high 1524.2).
Recent selling came about a few points south of weekly resistance at 1536.9, consequently guiding price action towards another possible test of a support area coming in at 1487.9-1470.2. By the same token, daily price is seen nearing the top edge of a support area at 1495.7-1480.3 (glued to the upper limit of the said weekly support zone), which happens to intersect with a 50-day SMA (blue –1491.4).
Areas of consideration:
With everything taken into account, another retest of the H4 support zone mentioned above at 1477.3/1493.7 is likely on the cards today. The confluence visible not only from the H4 trend line support, but also the higher-timeframe support areas, really underpins the H4 base.
Entry and risk parameters are, of course, trader dependent. Some will simply enter long at 1493.7 and position stops below the H4 support zone accordingly, while others may prefer to wait and see how the H4 candles behave before pulling the trigger. A strong bullish candlestick configuration formed, or an entry based on lower-timeframe structure – a trend line break for instance – are just some of the options available to conservative traders.
The accuracy, completeness and timeliness of the information contained on this site cannot be guaranteed. IC Markets does not warranty, guarantee or make any representations, or assume any liability regarding financial results based on the use of the information in the site.
News, views, opinions, recommendations and other information obtained from sources outside of www.icmarkets.com.au, used in this site are believed to be reliable, but we cannot guarantee their accuracy or completeness. All such information is subject to change at any time without notice. IC Markets assumes no responsibility for the content of any linked site.
The fact that such links may exist does not indicate approval or endorsement of any material contained on any linked site. IC Markets is not liable for any harm caused by the transmission, through accessing the services or information on this site, of a computer virus, or other computer code or programming device that might be used to access, delete, damage, disable, disrupt or otherwise impede in any manner, the operation of the site or of any user’s software, hardware, data or property.


