DXY:
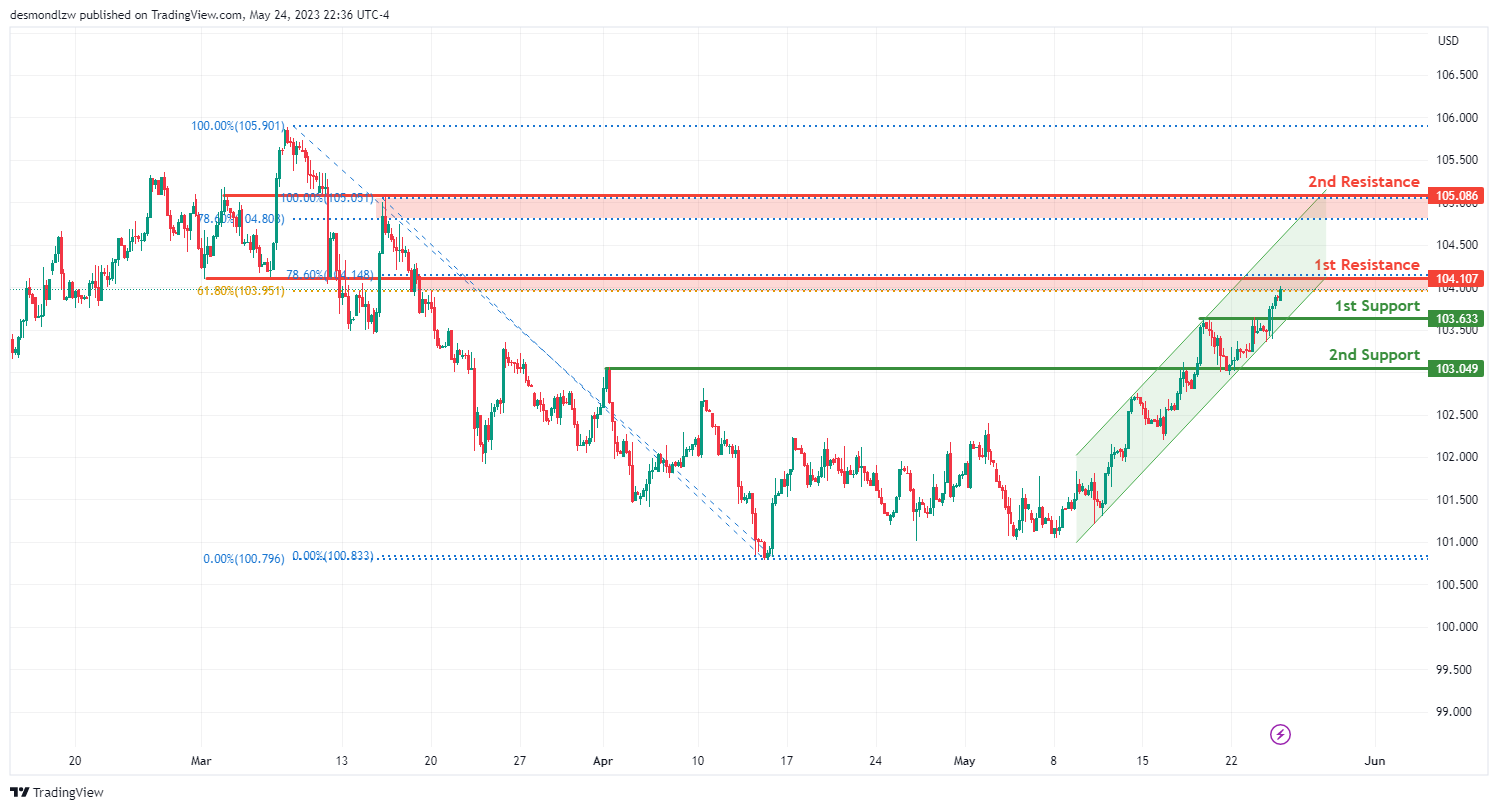
The DXY chart is currently demonstrating bullish momentum. This trend is backed by the price movement, which is in a bullish ascending channel.
In the near term, the price could potentially decline further to the first support level at 103.63 before bouncing back and ascending towards the first resistance level. The first support level, identified as a multi-swing low support, may offer a strong base to prevent further price decline.
There is also a second support level at 103.04. This level, recognized as an overlap support, could also act as a floor to stop any further drop in price.
On the resistance side, the first resistance level at 104.10, which also serves as a pullback resistance, could challenge any upward price movement. This level is further reinforced by the presence of Fibonacci confluence, coinciding with the 61.80% and 78.60% Fibonacci retracement levels.
The second resistance level is at 105.08. Recognized as an overlap resistance and also aligning with the 78.60% Fibonacci retracement level, this could offer a significant barrier to any price increase.
EUR/USD:
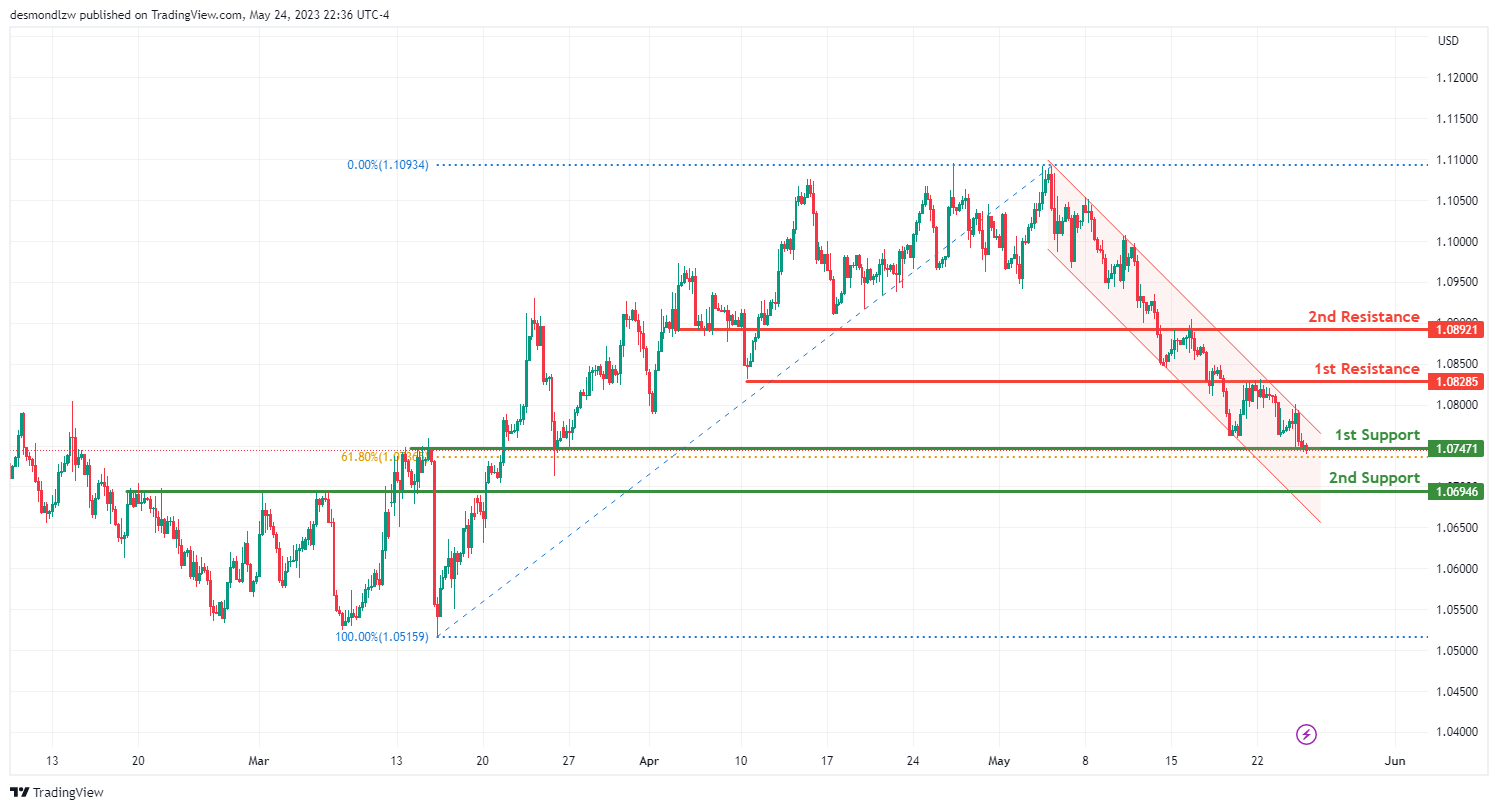
The EUR/USD chart is currently showing a bearish momentum, with the price being in a bearish descending channel. This suggests the possibility of a bearish reaction from the first support level, potentially leading to a drop towards the second support level.
The first support level is at 1.0747, which is an overlap support and aligns with the 61.80% Fibonacci retracement level. This suggests that it’s a significant level where the price could potentially halt or reverse its downward trajectory.
The second support level is situated at 1.0694, also identified as an overlap support. This could provide a further barrier to prevent any additional downward price movement.
Conversely, should the price attempt to reverse its bearish momentum, it could encounter resistance at 1.0828. This level acts as an overlap resistance and could potentially halt an upward price movement.
The second resistance level is at 1.0892, serving as another overlap resistance. This could present a significant hurdle for the price in the event of an upward swing.
GBP/USD:
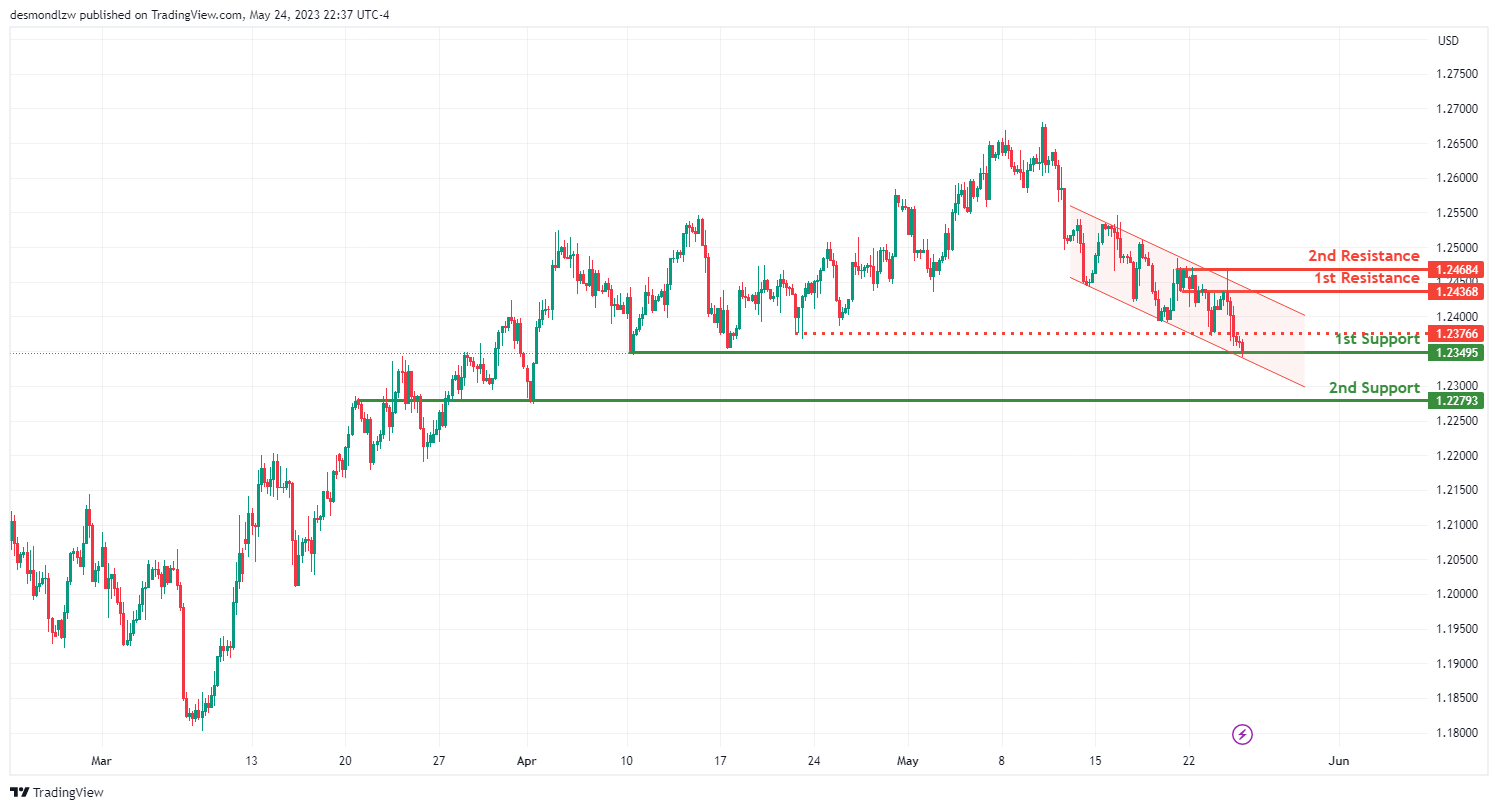
The GBP/USD pair currently shows a bearish trend, reflected by the price descending within a bearish channel. This hints at the likelihood of a bearish break from the first support level, which may subsequently lead to a drop towards the second support level.
The primary support level is positioned at 1.2747, which is recognized as a multi-swing low support. This denotes it as a level where the price has bottomed out multiple times in the past, providing a potentially robust level to halt further declines.
The secondary support level lies at 1.2279, which is known as an overlap support. This offers an additional potential floor to counter further downward movement in the price.
On the flip side, if the price attempts to reverse its current bearish direction, it could encounter resistance at 1.2436. This level is known as an overlap resistance, which could potentially curb any upward price movement.
The second resistance level is situated at 1.2468, which is recognized as a multi-swing high resistance. This indicates it as a level where the price has reached a peak multiple times in the past, thereby acting as a potential barrier against further increases in price.
Additionally, there is an intermediate resistance level at 1.2376, which serves as a pullback resistance. This could offer another potential barrier to upward movement in the price.
USD/CHF:
The USD/CHF chart is currently exhibiting bullish momentum, suggesting potential for continued upward movement as the price is above a significant ascending trend line.
In the short term, there’s a potential for a bullish break through the first resistance level at 0.9062, subsequently leading to a rise towards the second resistance level at 0.9097. The first resistance level is considered a multi-swing high resistance, indicating its significance as a potential price ceiling.
Additionally, the second resistance level is recognized as a pullback resistance, coinciding with a 127.20% Fibonacci Extension. This level further reinforces the potential for resistance in the event of a price increase.
On the support side, the first support level at 0.9005 is an overlap support, coinciding with a 50% Fibonacci Retracement, which may provide a solid base to halt any potential price pullbacks.
Furthermore, there’s a second support level at 0.8984, identified as an overlap support, contributing to the potential for support in case of a price decline.
Moreover, there’s an intermediate support level at 0.9028, acting as a pullback support, providing another potential base to halt any price declines.
USD/JPY:
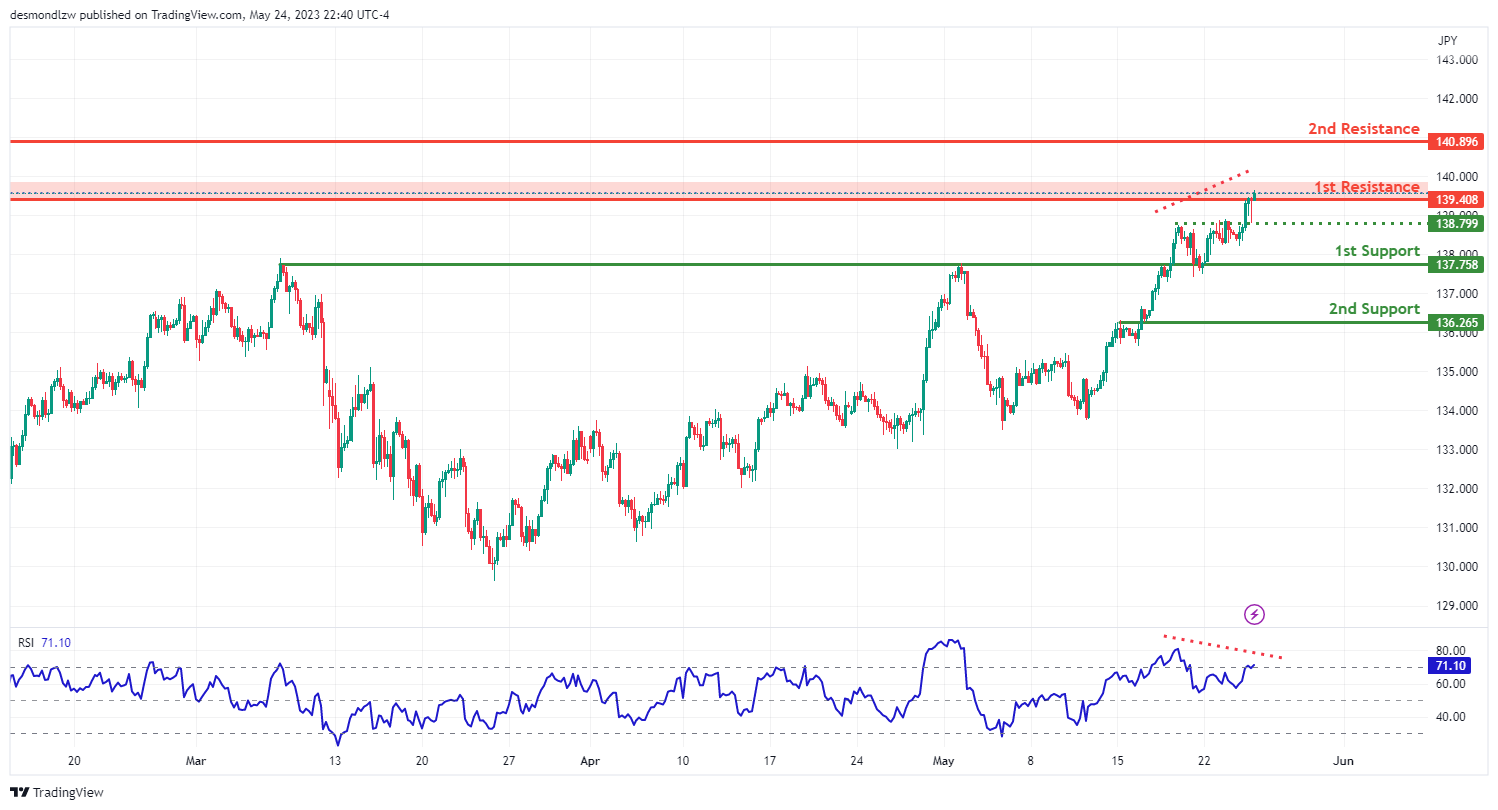
The USD/JPY chart is currently demonstrating a bearish trend, implying potential for continued downward movement.
In the short term, there’s a likelihood for a bearish reaction off the first resistance level at 139.40, leading to a drop towards the first support level at 137.75. The first resistance level is considered a multi-swing high resistance, indicating its significance as a potential price ceiling, and it coincides with a 50% Fibonacci retracement.
Additionally, there’s a second resistance level at 0.91, recognized as a pullback resistance. This level could further halt an upward price movement.
On the support side, the first support level at 137.75 is an overlap support, which might provide a solid base to prevent further price drops.
Furthermore, there’s a second support level at 136.26, also identified as an overlap support, contributing to the potential for support in case of a price decline.
Moreover, there’s an intermediate support level at 138.79, acting as a pullback support, providing another potential base to halt any price drops. The Relative Strength Index (RSI) is also displaying bearish divergence versus price, suggesting that a reversal might occur soon.
AUD/USD:
The AUD/USD chart is currently reflecting a bearish trend, indicating the likelihood of a further downward movement.
In the immediate future, there’s potential for a bearish continuation towards the first support level at 0.6508. This support level is identified as a pullback support and coincides with a 127.20% Fibonacci extension, suggesting its strength as a possible price floor.
Moreover, there’s a second support level at 0.6403, known as an overlap support. This level aligns with a 161.80% Fibonacci extension, providing another potential base in case of a downward price movement.
On the other hand, if the price attempts to reverse its bearish trend, it could encounter resistance at 0.6578, which is identified as a multi-swing high resistance. This level could potentially halt an upward price movement.
There’s a second resistance level at 0.6608, recognized as a pullback resistance. This level might further obstruct an upward price movement, should the trend reversal occur.
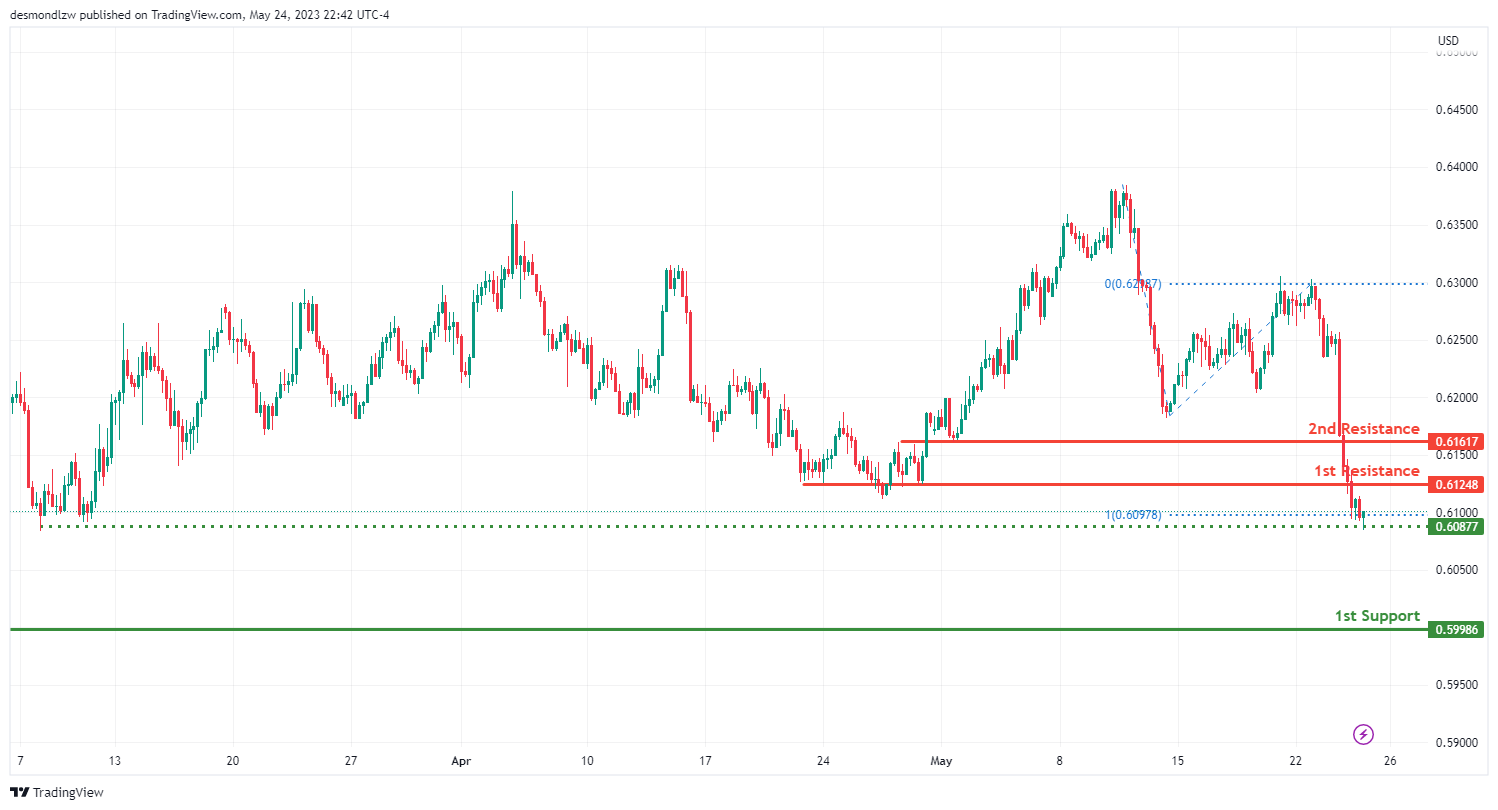
NZD/USD
The NZD/USD chart currently exhibits a bearish trend, suggesting a potential continuation of the downward movement.
The price may potentially make a bearish continuation towards the first support level at 0.5998, known as a pullback support. This level might provide a potential floor for price, slowing or reversing any further declines.
There’s an intermediate support level identified at 0.6087, termed as a swing low support. This level might provide additional stability to the price, should it continue to drop.
Conversely, if the price attempts to counter its bearish trajectory, it could encounter the first resistance at 0.6128. Identified as a pullback resistance, this level might obstruct the upward movement of the price.
Additionally, there’s a second resistance level at 0.6161, also recognized as a pullback resistance. This level might further challenge any attempts by the price to rise, potentially causing a halt or reversal.
.
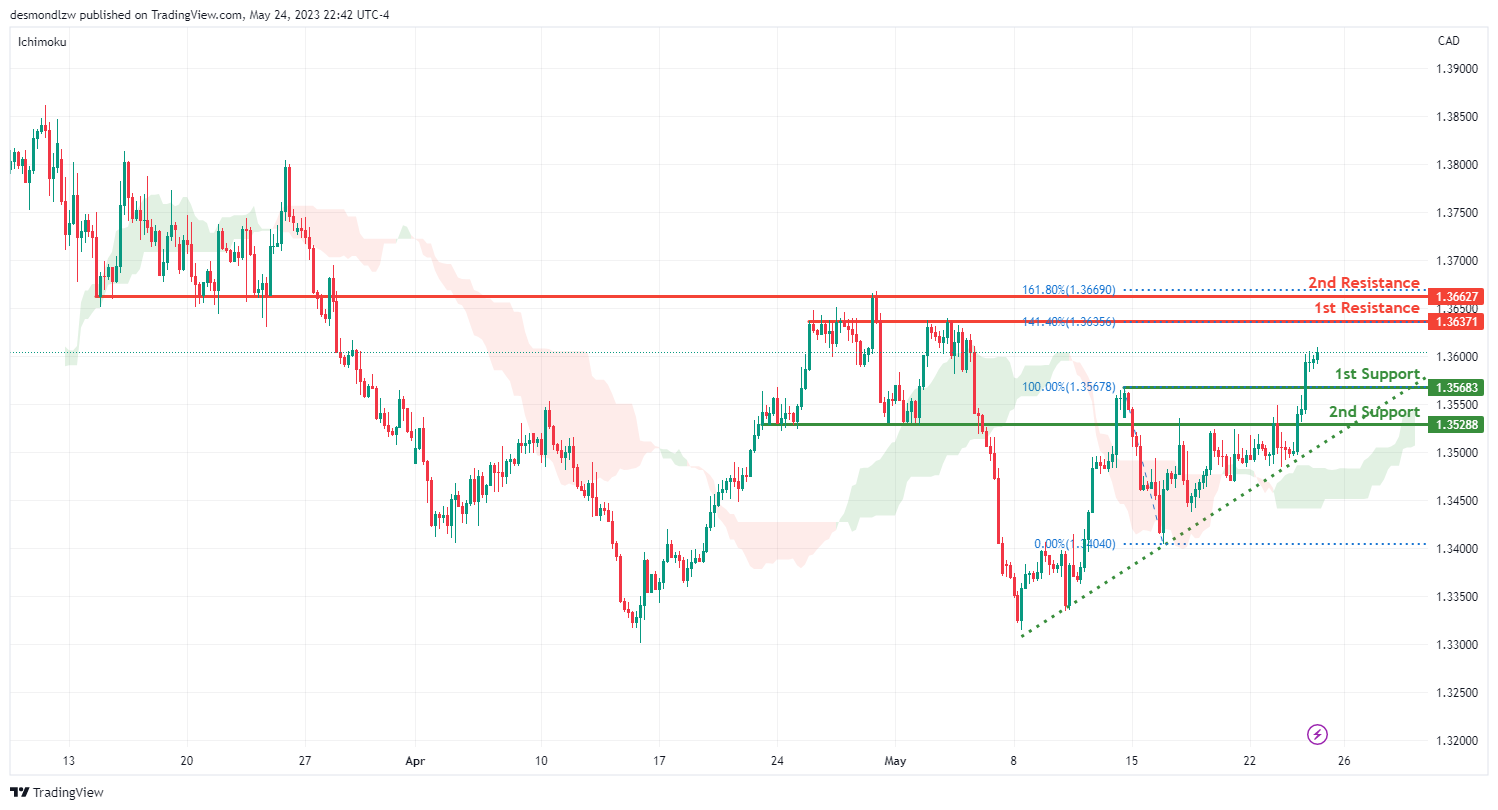
USD/CAD:
The USD/CAD t is currently showing a bullish trend. This can be attributed to the price being above a major ascending trend line and above the bullish Ichimoku cloud, indicating that further bullish momentum may be on the cards.
In the short term, it is expected that the price may continue its bullish movement towards the first resistance level at 1.3637. This level is identified as an overlap resistance, suggesting it could serve as a potential barrier to price increases.
Furthermore, there’s a second resistance level at 1.3662. This overlap resistance, combined with its alignment with the 161.80% Fibonacci Extension, strengthens the possibility of it acting as a significant obstacle to further price rise.
In terms of support, the first support level is situated at 1.3568, functioning as a pullback support. This could potentially provide a base to stop or reverse any price declines.
Additionally, a second support level is located at 1.3528, also acting as a pullback support. This further reinforces the potential for support in case of a downward price movement.
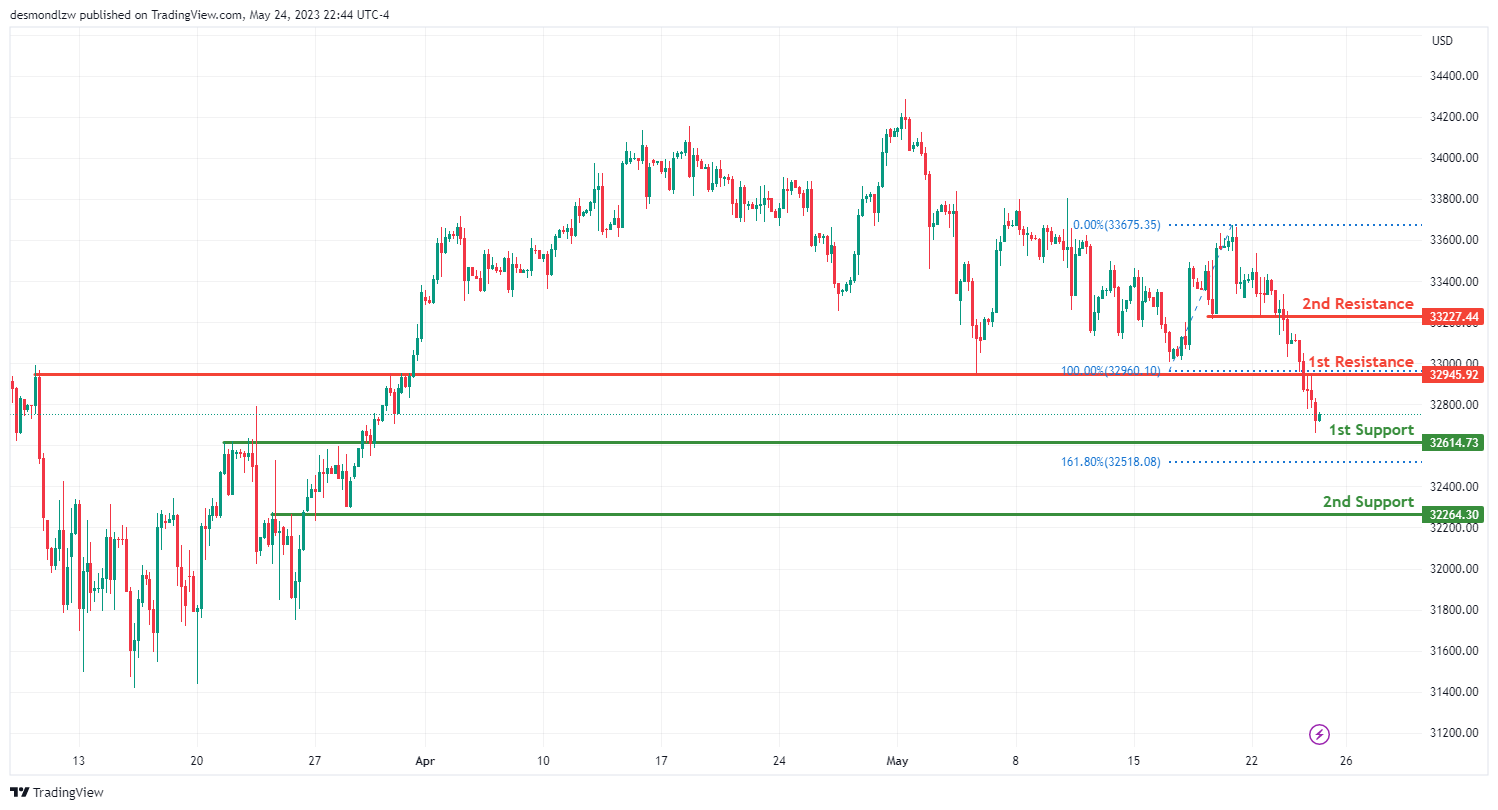
DJ30:
The DJ30 index is currently exhibiting a bearish trajectory. It is expected that the price may continue its bearish trend towards the first support level.
The first support level is at 32614.73 and serves as a pullback support, potentially providing a solid foundation to stop or reverse any further price declines.
A second support level can be found at 32264.30, which is identified as an overlap support, bolstering its potential as a buffer against additional price drops.
Conversely, if the price attempts to reverse its bearish trend, it will face the first resistance at 32945.92, which acts as a pullback resistance. This could potentially halt an upward price movement.
The second resistance level is at 33227.44, serving as an overlap resistance. If the price reaches this level, it might find it challenging to continue its upward trajectory and may instead reverse back towards its support levels.
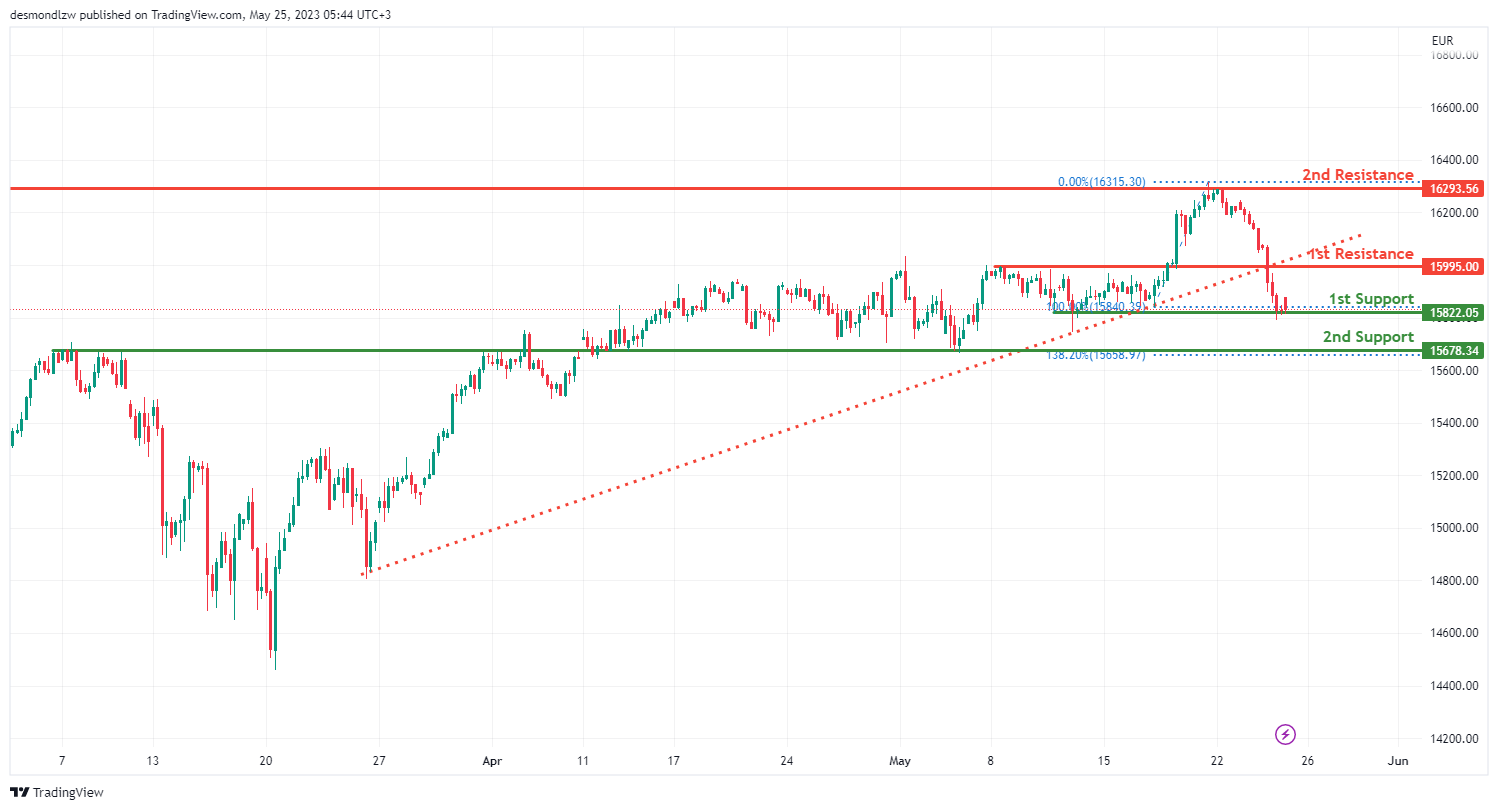
GER30:
The GER30 index is currently on a bearish trend, prompted by the breaking below an ascending support line, indicating the potential for a continued bearish shift.
The price might potentially follow a bearish path, breaking off from the first support and heading towards the second support level.
The first support level is marked at 15822.05, acting as a multi-swing low support. This point, where the price has bottomed out multiple times in the past, could potentially provide a strong base to prevent further declines.
The second support level is at 15678.34, recognized as an overlap support, providing another potential floor for the price in case of a downward shift.
On the flip side, if the price attempts to counter its bearish trend, it could face resistance at 15995.00, identified as a pullback resistance. This level could potentially interrupt an upward price movement.
The second resistance level is at 16293.56, acting as a swing high resistance. Should the price reach this level, it might face difficulty continuing its upward trajectory, possibly leading to a reversal towards the support levels.
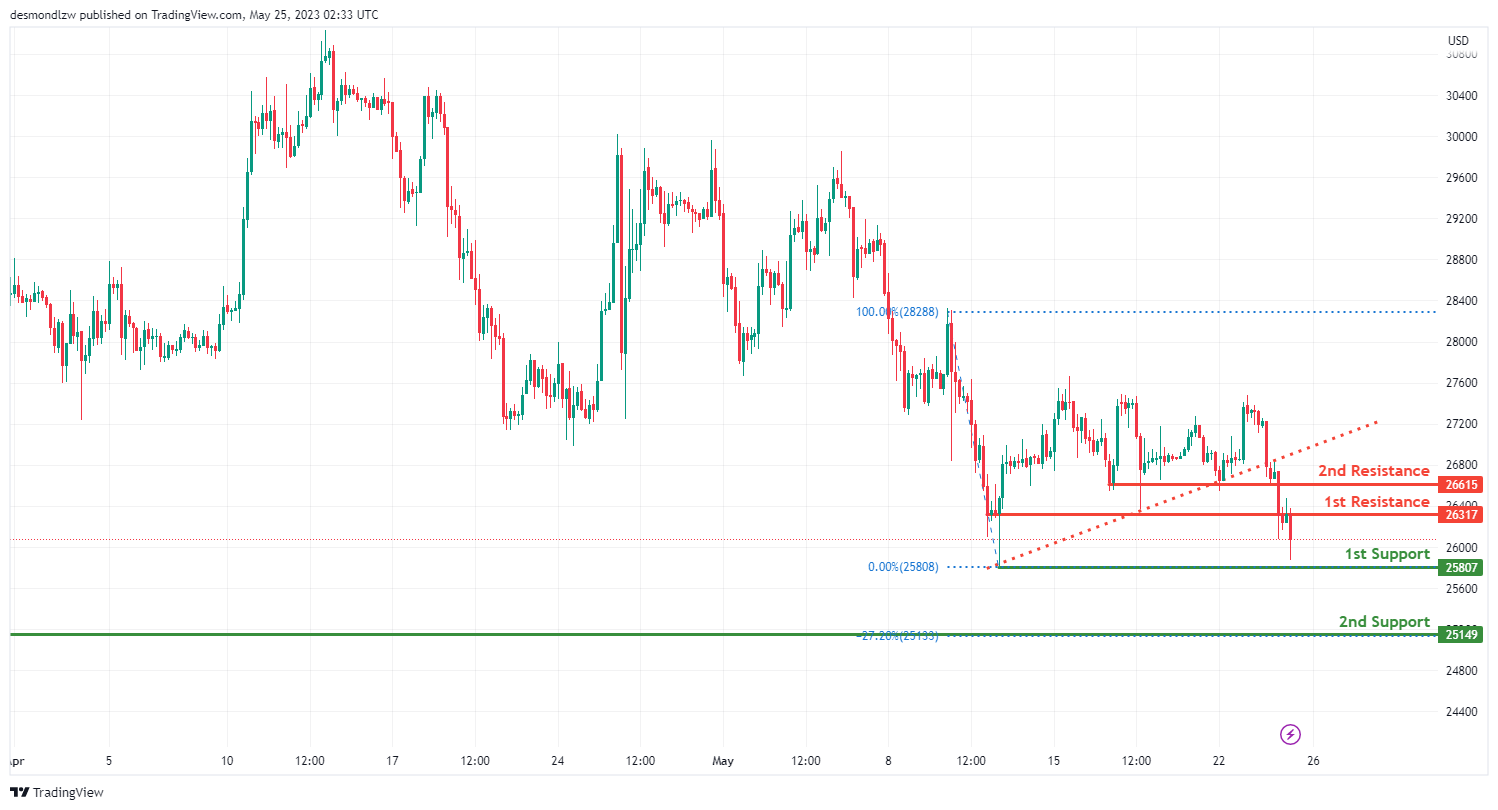
BTC/USD:
The BTC/USD pair is currently displaying a bearish momentum, prompted by the price breaking below an ascending support line, indicating potential for a bearish shift.
The price might potentially react bearishly off the first resistance and decline towards the first support level.
The first support level is situated at 25807, acting as a swing low support. This level, where the price has hit a low point in the past, could potentially provide a strong barrier to further declines.
The second support level is at 25149, which serves as a pullback support, providing another potential floor for the price in case of a downward movement.
Conversely, if the price attempts to counter its bearish trend, it could face resistance at 26317, identified as a pullback resistance. This level could potentially interrupt an upward price movement.
The second resistance level is at 26615, acting as another pullback resistance. If the price reaches this level, it might find it challenging to maintain its upward momentum and could possibly reverse back towards the support levels.
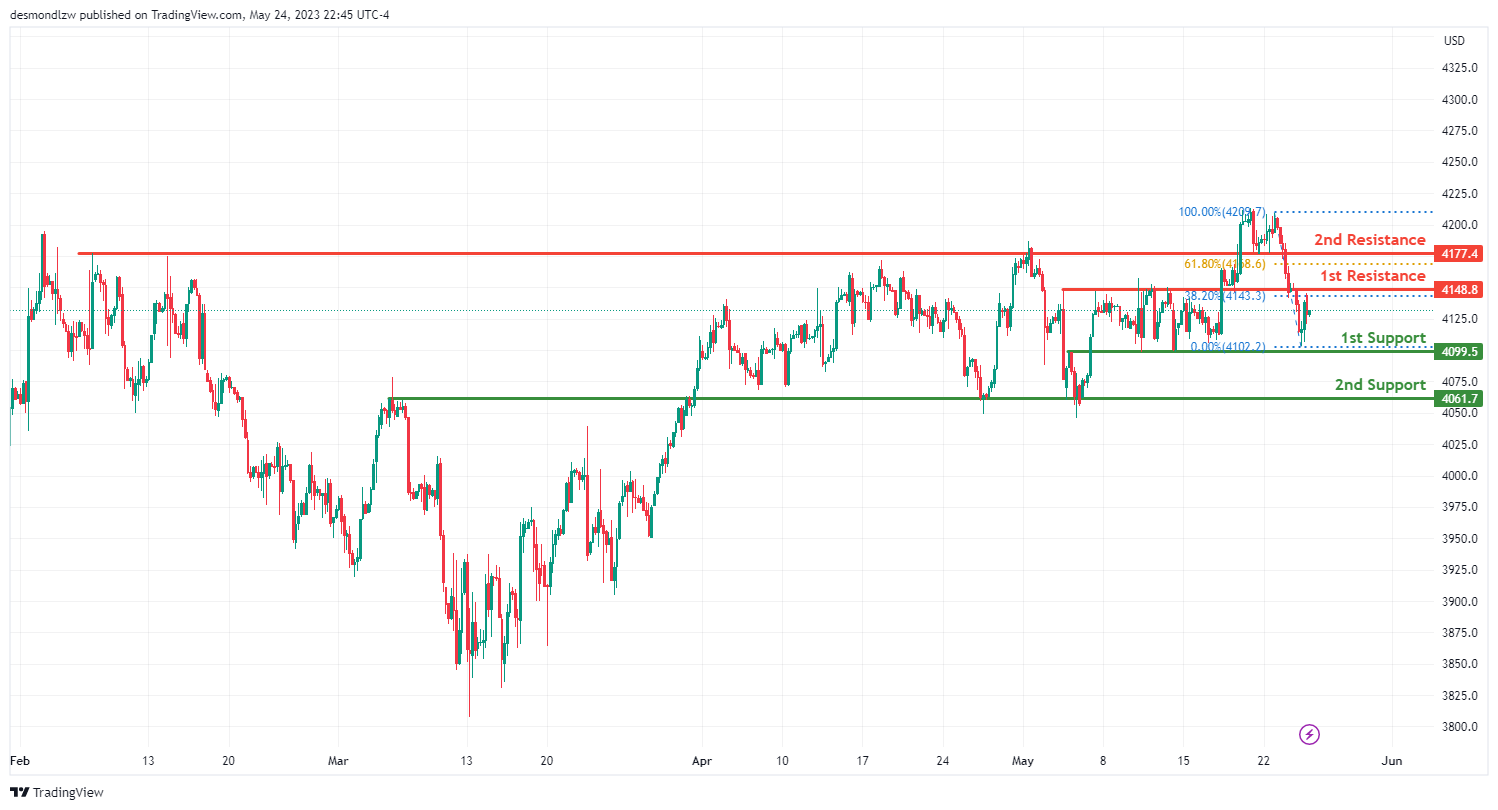
US500
The US500 instrument currently displays a bearish momentum, with the potential for a continued bearish shift towards the first support level.
The initial support level is located at 4099.5, functioning as a swing low support. This level represents a point where the price has previously bottomed out, providing a potential floor to prevent further price drops.
The secondary support level is at 4061.7, identified as an overlap support. This level could potentially halt further declines, acting as another base for the price.
Conversely, if the price tries to reverse its bearish trend, it may face resistance at 4148.8. This level, identified as an overlap resistance, might obstruct an upward price trajectory, particularly as it represents the 38.20% Fibonacci retracement level.
The following resistance level is at 4177.4, acting as a pullback resistance. This level, corresponding to the 61.80% Fibonacci retracement, may make it difficult for the price to maintain an upward trajectory and could potentially result in a reversal towards the support levels.
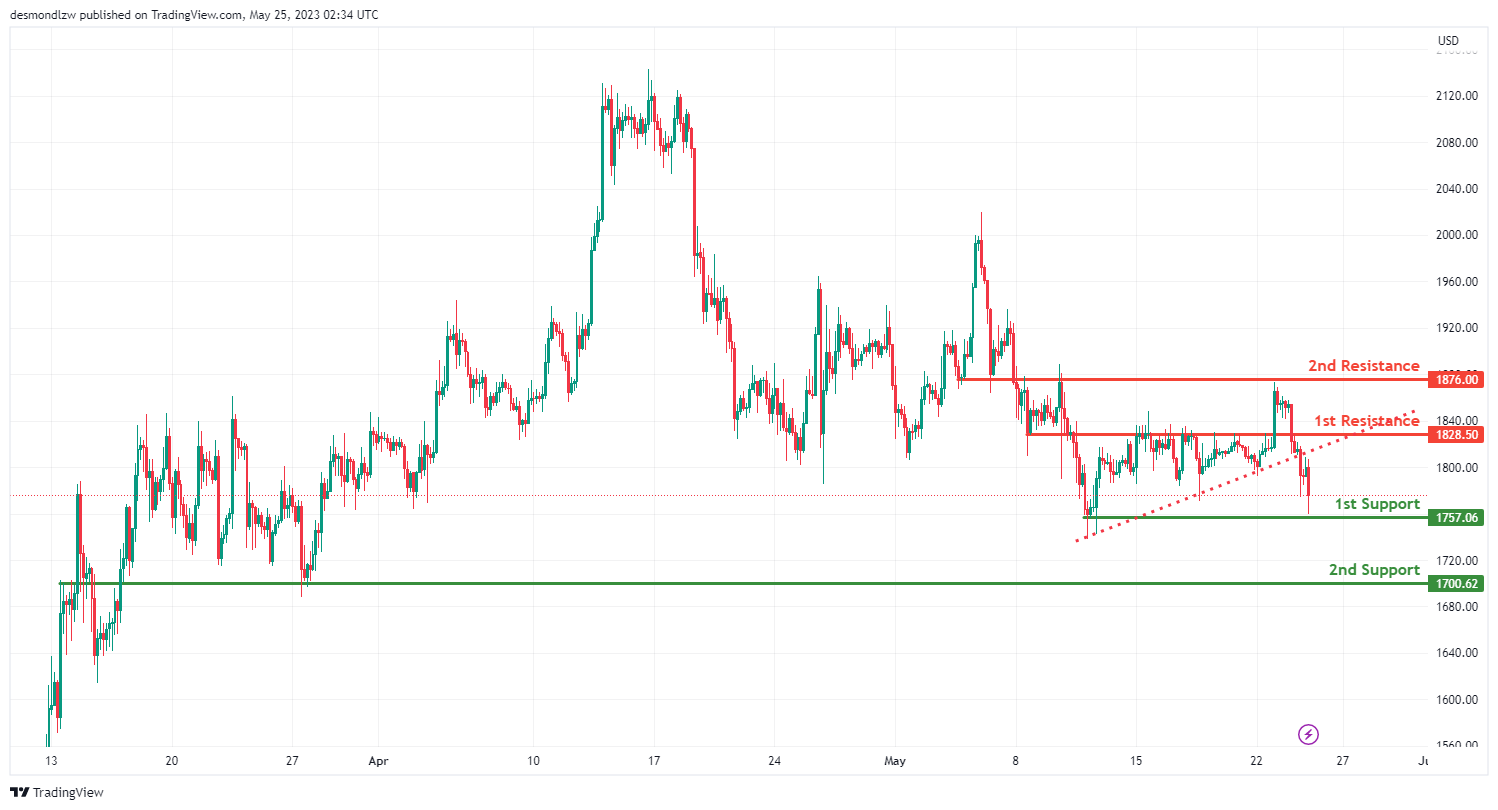
ETH/USD:
The ETH/USD instrument is currently demonstrating a bearish trend, largely driven by the price breaking below an ascending support line, which indicates a potential for further bearish moves.
The primary support level is found at 1757.06 and is recognized as a multi-swing low support, a point where the price has reached a low multiple times in the past. This could potentially provide a strong barrier against further declines.
The second support level is located at 1700.62. Identified as an overlap support, this level may serve as another floor to halt further price decreases.
In the event of a potential price reversal, the first resistance level at 1828.50 could obstruct the price from rising. This overlap resistance level represents a potential ceiling that could curb any bullish momentum.
The second resistance level is found at 1876.00 and is also recognized as an overlap resistance. This means that it’s a point where the price has previously topped out, reinforcing its potential to act as a barrier against price increases.
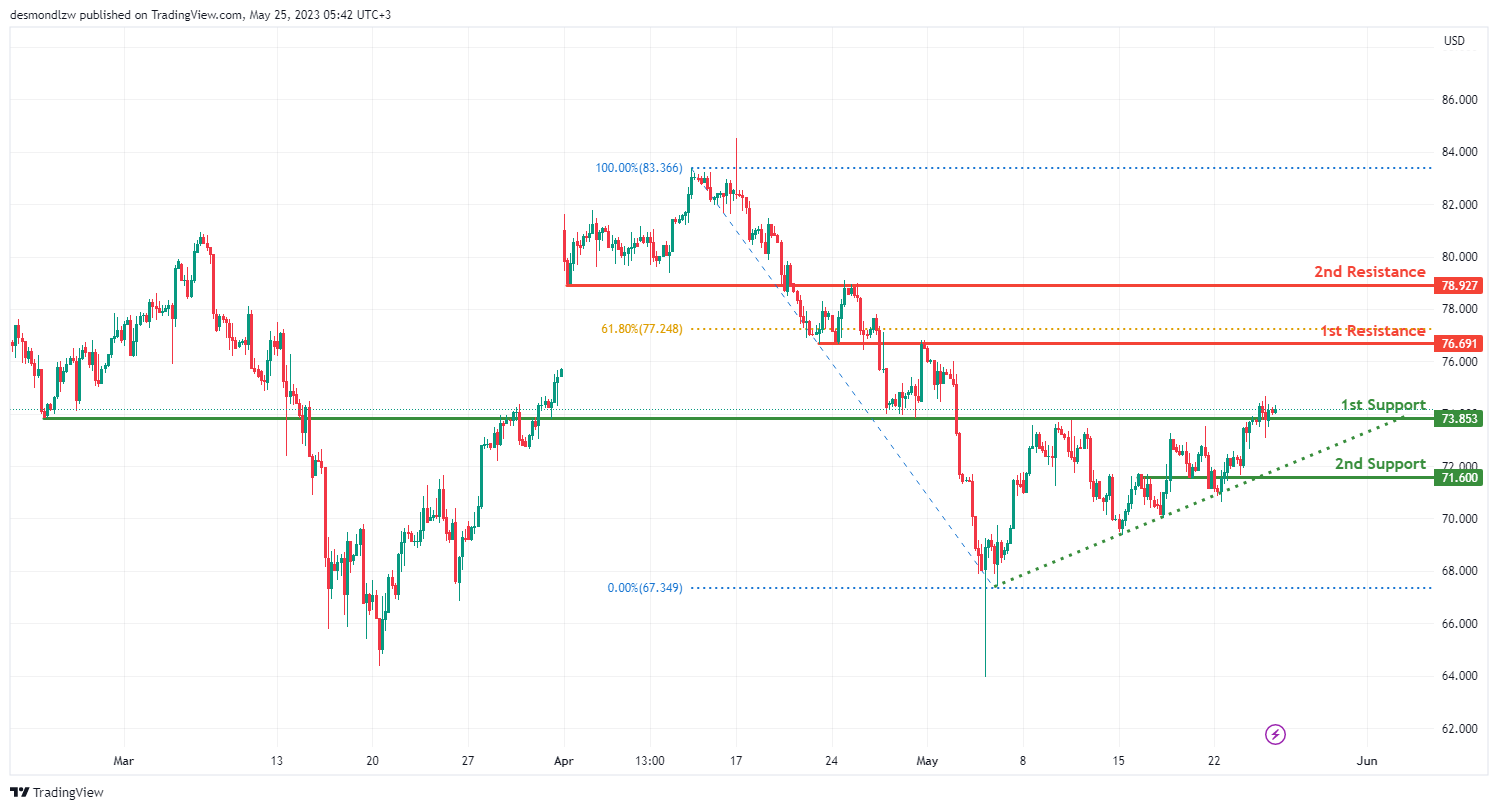
WTI/USD:
The WIT instrument is currently exhibiting a bullish trend, largely due to the price being above a significant ascending trend line, which suggests the likelihood of continued bullish momentum.
The first level of support is at 1757.06 and is identified as an overlap support. This indicates that it’s a point where the price has historically bottomed out, suggesting its potential to stop further price declines.
The second support level is located at 71.60 and is also recognized as an overlap support, further reinforcing its potential to halt further price decreases.
On the other hand, if the price attempts to continue its bullish trend, it could encounter resistance at 76.69. This overlap resistance level is also at the 61.80% Fibonacci retracement level, and it could potentially obstruct upward price movements.
The second resistance level is at 78.92 and is recognized as an overlap resistance, suggesting its potential to act as a ceiling for any price increases.
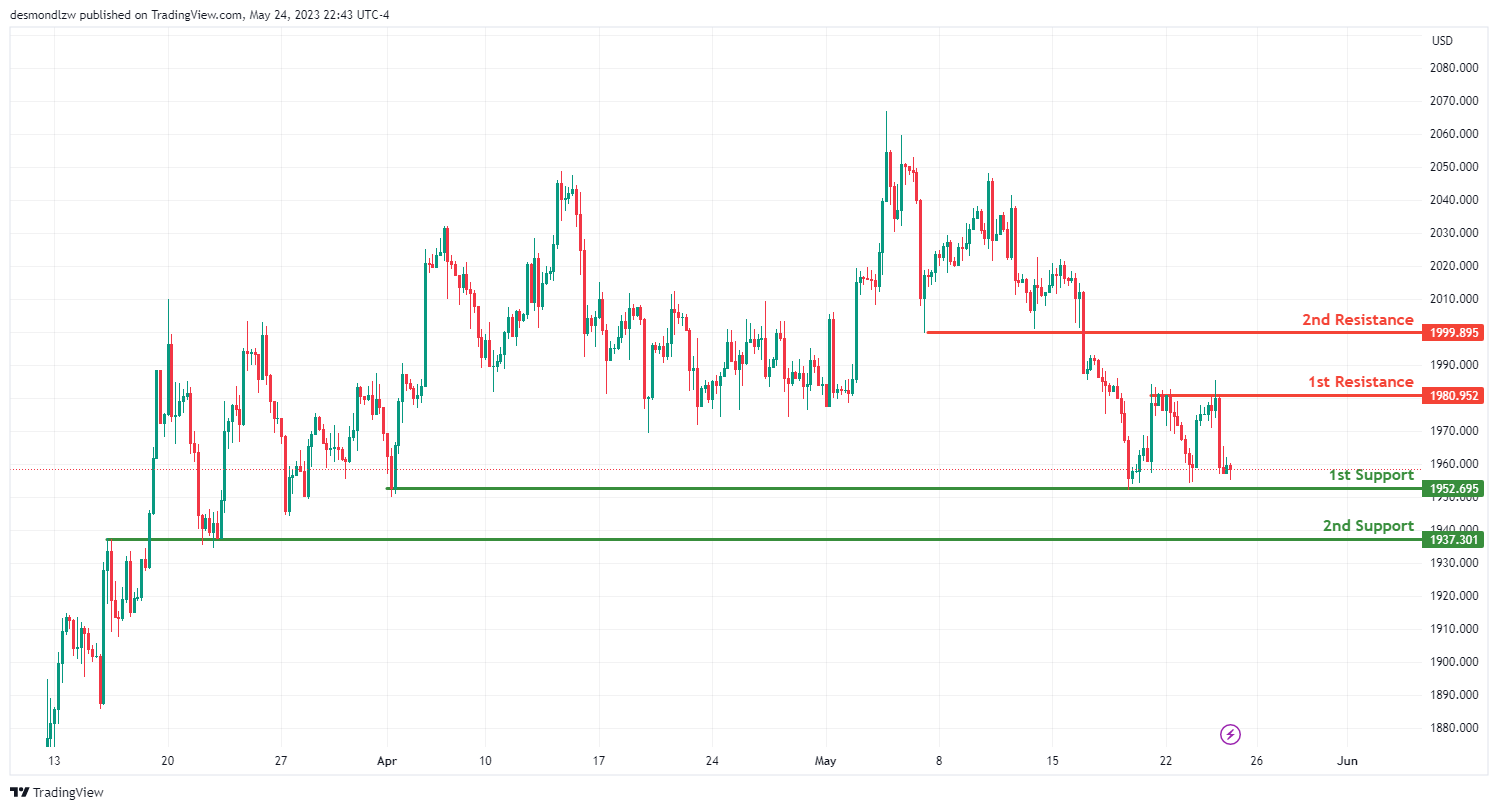
XAU/USD (GOLD):
The XAU/USD instrument is currently displaying a neutral trend, meaning the price is likely to fluctuate between certain levels.
The initial support level is located at 1952.69 and is classified as a multi-swing low support. This means it’s a point where the price has reached a low multiple times in the past, potentially providing a strong barrier against further price decreases.
The second support level is found at 1937.30, known as an overlap support, which suggests it’s a level where the price has historically bottomed out, hence it could halt further price declines.
On the flip side, if the price seeks to increase, it could encounter resistance at 1980.95. This level is acknowledged as a multi-swing high resistance, indicating that it’s a point where the price has peaked multiple times in the past, and may potentially obstruct upward price movements.
The next resistance level is at 1999.89, known as a pullback resistance. This level might act as a ceiling for any price increases.
The accuracy, completeness and timeliness of the information contained on this site cannot be guaranteed. IC Markets does not warranty, guarantee or make any representations, or assume any liability regarding financial results based on the use of the information in the site.
News, views, opinions, recommendations and other information obtained from sources outside of www.icmarkets.com, used in this site are believed to be reliable, but we cannot guarantee their accuracy or completeness. All such information is subject to change at any time without notice. IC Markets assumes no responsibility for the content of any linked site.
The fact that such links may exist does not indicate approval or endorsement of any material contained on any linked site. IC Markets is not liable for any harm caused by the transmission, through accessing the services or information on this site, of a computer virus, or other computer code or programming device that might be used to access, delete, damage, disable, disrupt or otherwise impede in any manner, the operation of the site or of any user’s software, hardware, data or property.