
Key risk events today:
SNB Monetary Policy Assessment and Policy Rate; US Unemployment Claims; BoE Governor Bailey Speaks; Fed Chair Powell Testifies; US Treasury Secretary Mnuchin Speaks.
(Previous analysis as well as outside sources – italics).
EUR/USD:
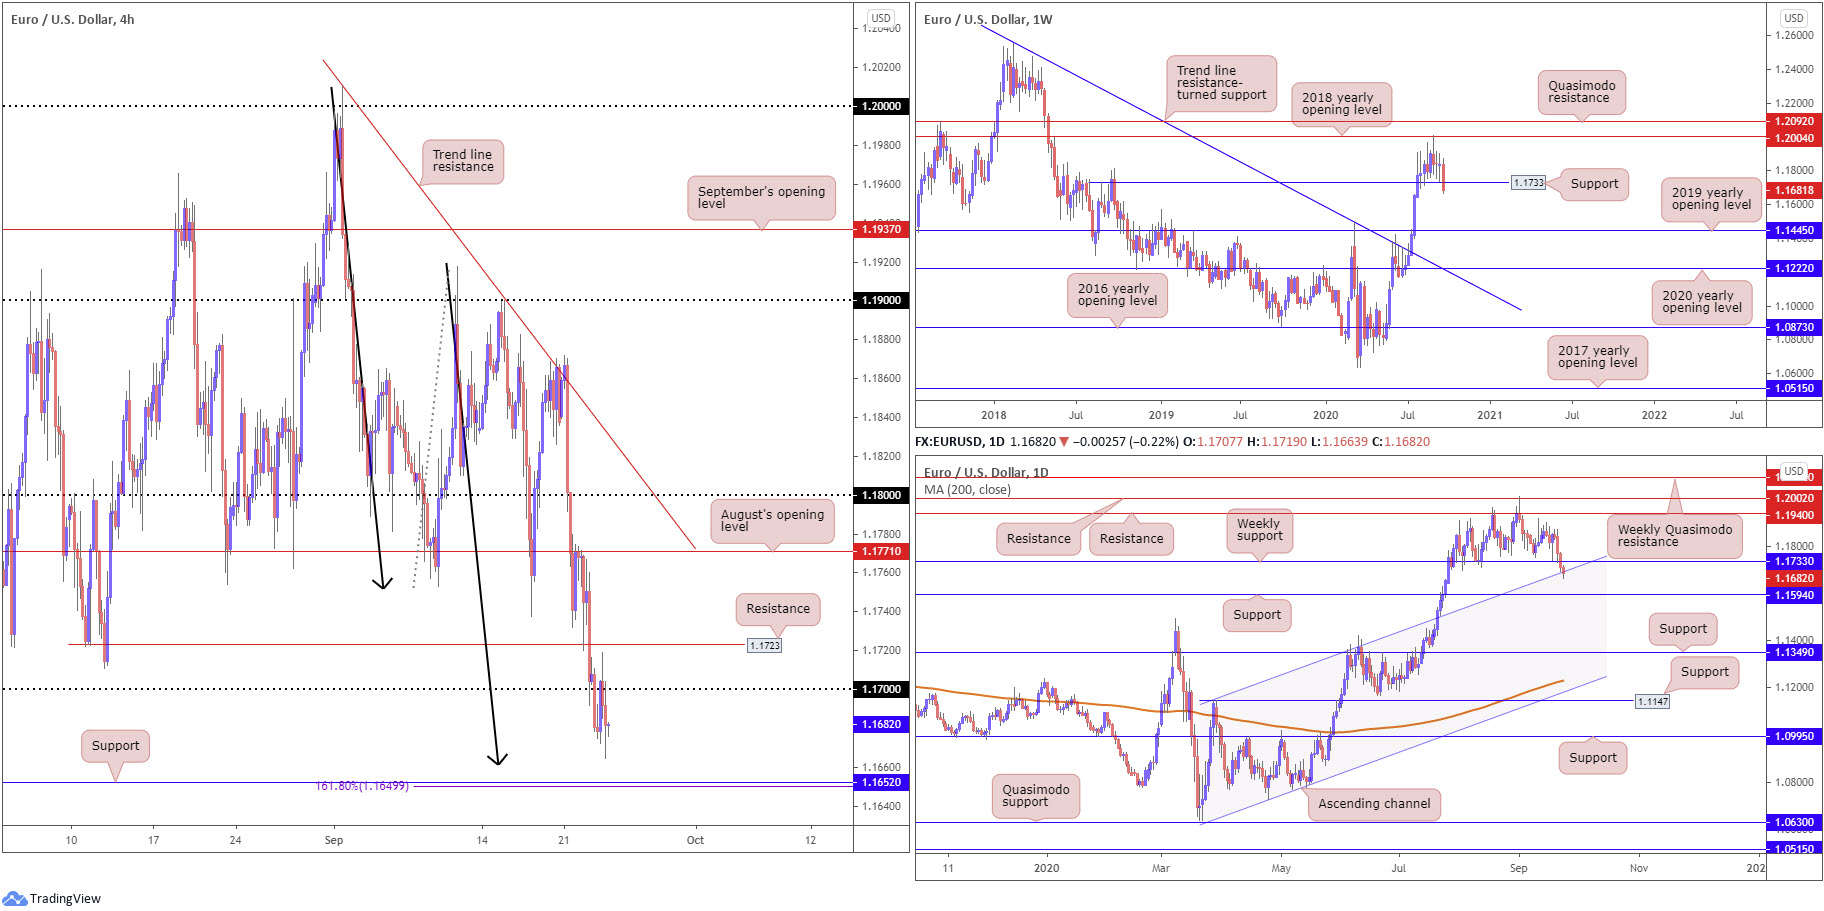
The euro held the bulk of its losses against the greenback Wednesday, recording a fourth consecutive daily decline.
H4 relinquished the 1.17 handle in wake of feeble sub-50 Eurozone services PMIs and the DXY crossing above 94.00. Support at 1.1652 on the H4 timeframe is next on tap should further selling develop, closely joined by AB=CD structure (black arrows) at 1.1660 and 1.618 BC projection at 1.1649. Popping above 1.17, however, leads price back to H4 resistance at 1.1723, a previous Quasimodo support.
On the weekly timeframe, support at 1.1733, a prior Quasimodo resistance level, remains under attack. A notable close beyond the aforementioned level shines the spotlight on the 2019 yearly opening level at 1.1445. Interestingly, on the daily timeframe, dipping sub 1.1733 has seen the unit shake hands with channel resistance-turned support, extended from the high 1.1147.
Areas of consideration:
Short term, the H4 AB=CD correction around 1.1660 is likely to interest buyers, particularly as the area converges with support priced in at 1.1652. The H4 zone may draw in additional impetus from daily channel support, though there is also a chance upside could find resistance around 1.17 on the H4 if weekly sellers hold below 1.1733.
GBP/USD:
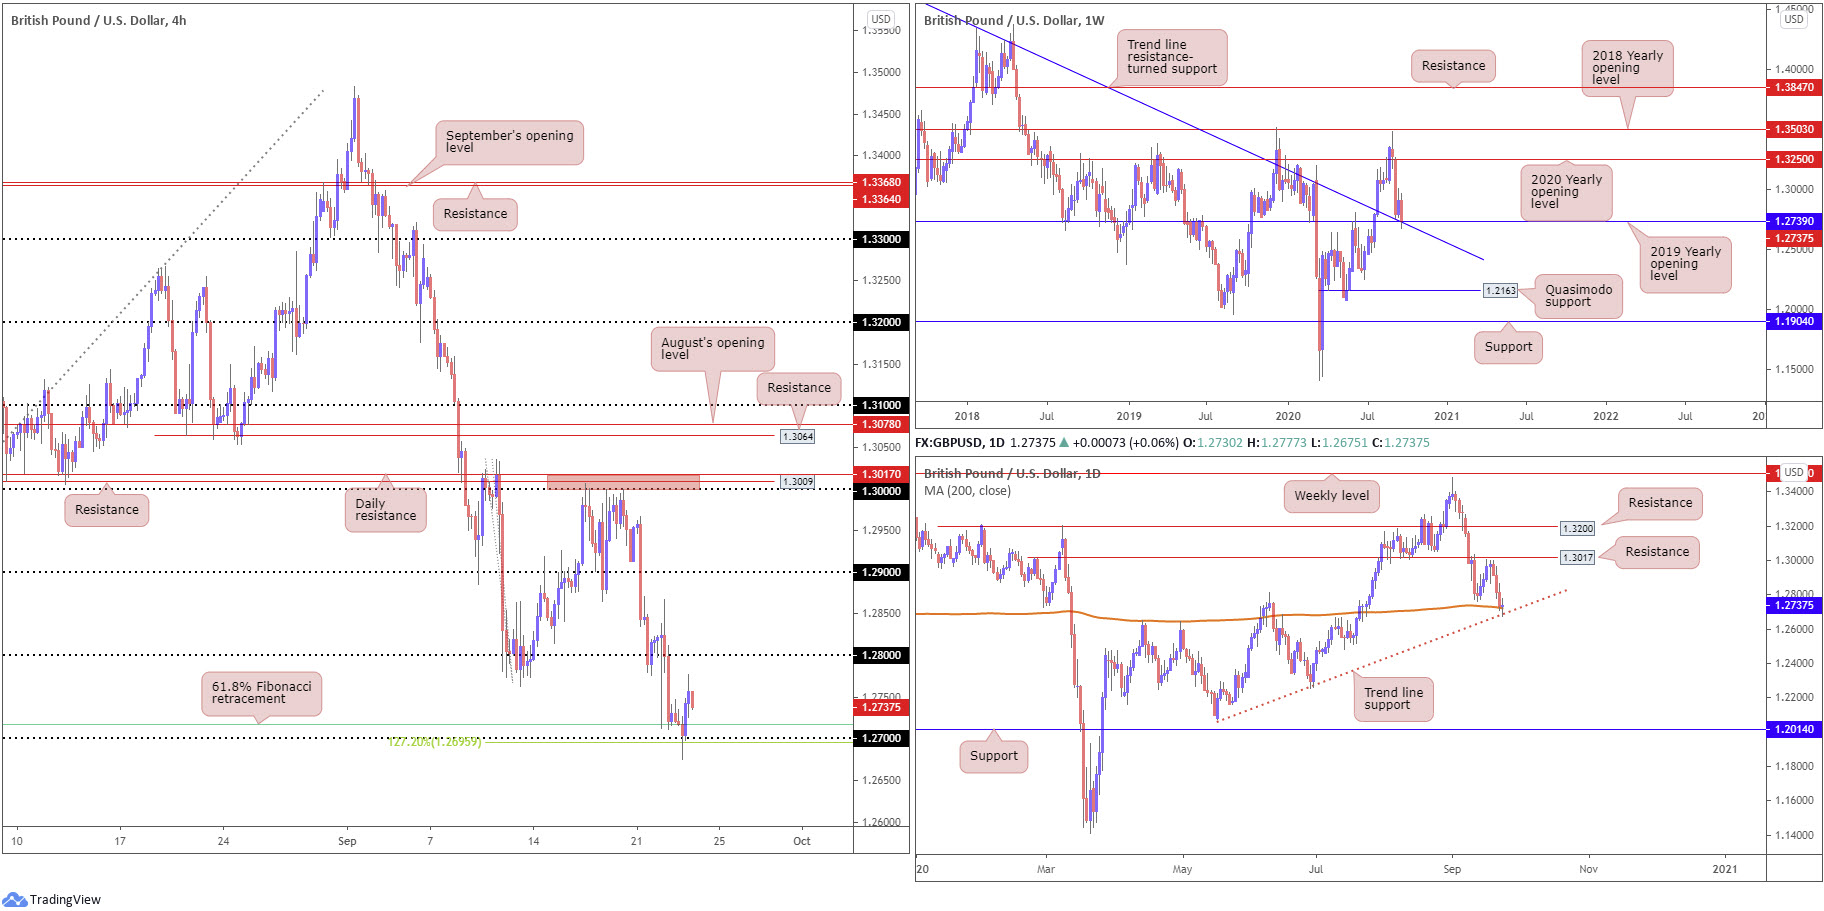
GBP/USD, technically speaking, trades at incredibly confluent support.
- Out of the weekly timeframe, the pair is crossing swords with the 2019 yearly opening value at 1.2739 and intersecting trend line resistance-turned support, taken from the high 1.5930.
- From the daily timeframe, trend line support, extended from the low 1.2075, and the 200-day SMA (orange – 1.2721) are in play.
- H4 is seen rebounding from the 1.27 handle and converging 61.8% Fibonacci retracement at 1.2718, as well as a 127.2% Fibonacci extension point at 1.2695.
Areas of consideration:
The reaction from 1.27 (and Fibonacci confluence), along with current support on the higher timeframes, is likely appealing, enough to perhaps draw in buyers. The next upside target rests around the 1.28 handle on the H4.
AUD/USD:
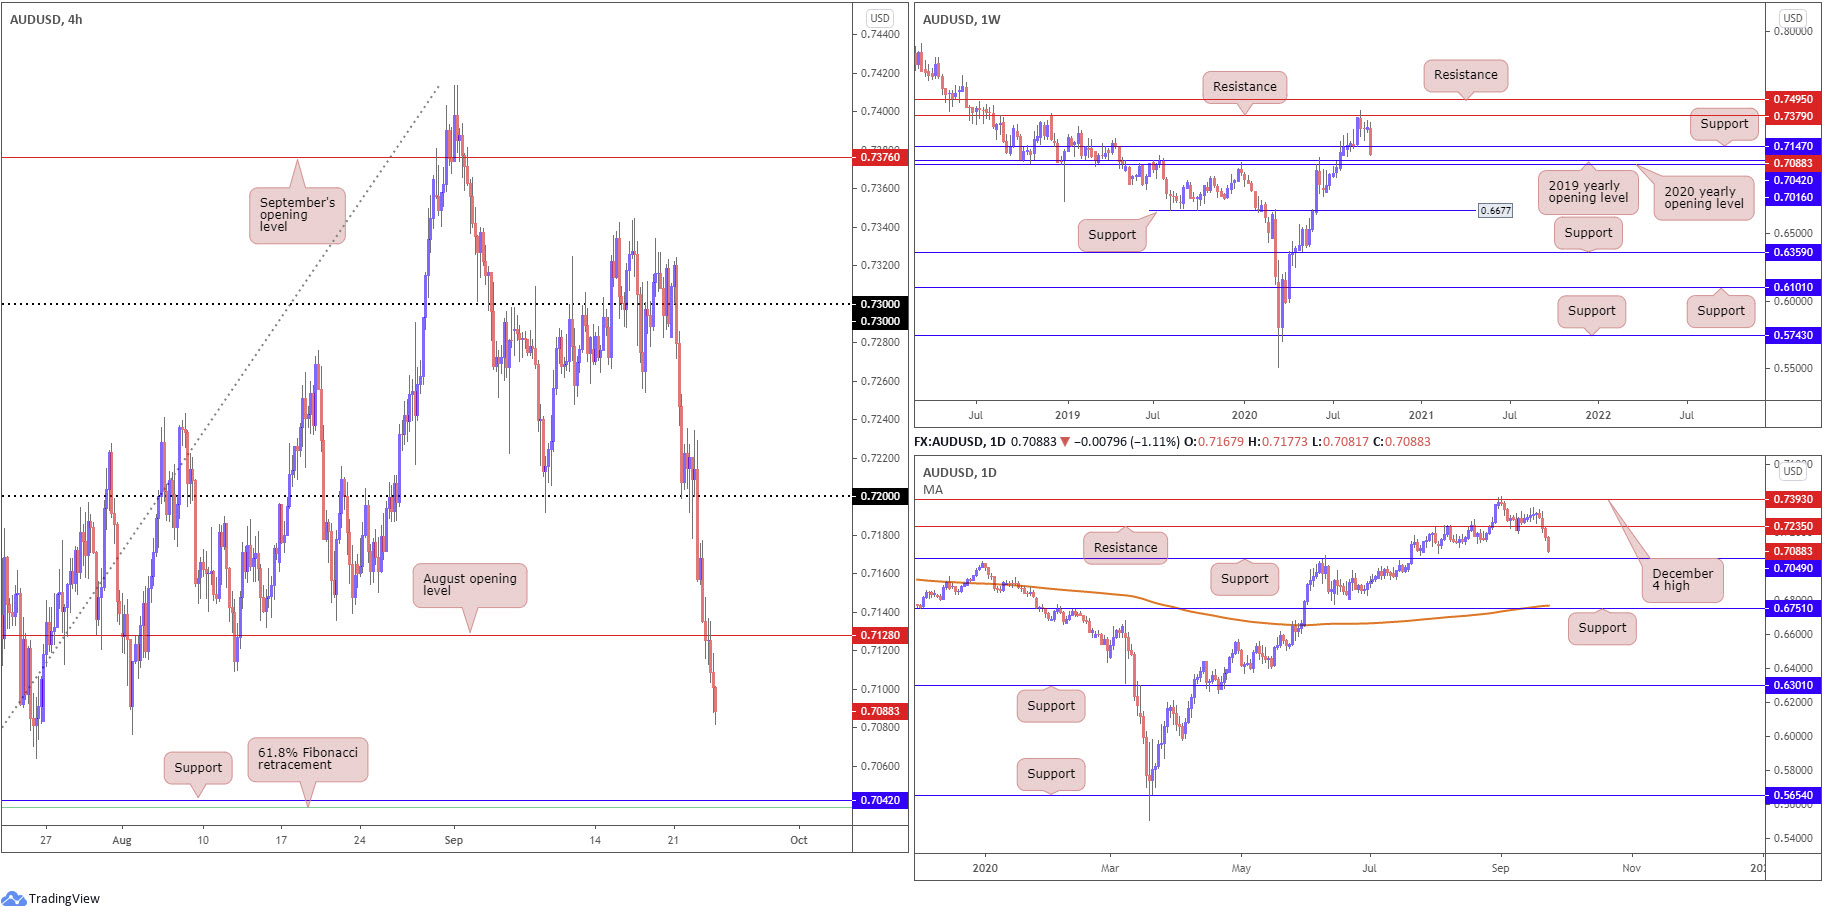
Down more than 1% Wednesday, AUD/USD, weighed amid risk aversion, overthrew August’s opening value at 0.7128 on the H4 Wednesday, potentially clearing space to support at 0.7042 (a prior Quasimodo resistance) and a 61.8% Fibonacci retracement at 0.7038. Note a break here exposes the key figure 0.70.
On the weekly timeframe, support at 0.7147 remains under pressure, with price targeting the 2020 and 2019 yearly opening values at 0.7016 and 0.7042, respectively. The daily timeframe, thanks to recent selling, has support at 0.7049 in sight.
Areas of consideration:
As of current price, sellers appear to have the upper hand until crossing paths with the 0.7050ish range. Should we reach this far south, traders will likely look to offload shorts and consider long positions, in light of support confluence: H4 support at 0.7042 (along with 61.8% Fibonacci retracement at 0.7038) converges with the 2019 yearly opening value to the pip (weekly timeframe), and is positioned nearby daily support at 0.7049.
USD/JPY:
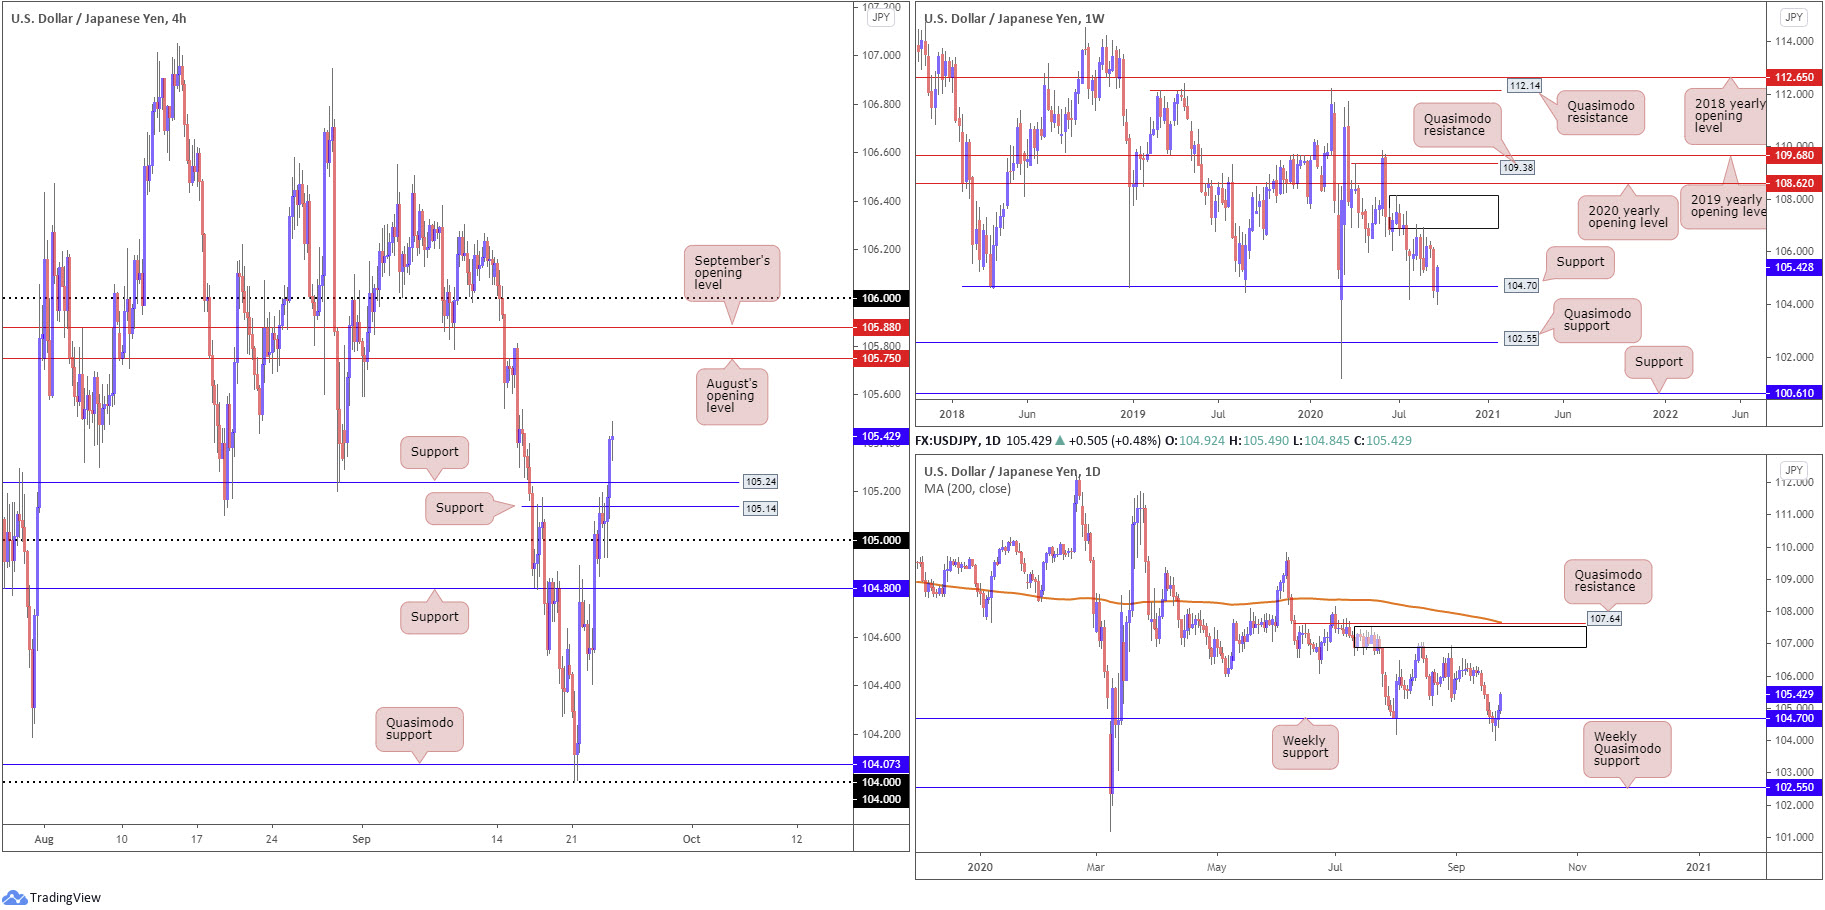
USD/JPY extended to a third consecutive daily gain Wednesday, strengthened on the back of the US dollar index making headway north of 94.00. Retesting 105 on the H4, the pair, as you can see, latched onto fresh bids above Quasimodo resistance at 105.14 and resistance plotted at 105.24. This, from a technical standpoint, has perhaps cleared the river north until August’s opening value at 105.75 and September’s opening value at 105.88.
From the higher timeframes, we can see the unit regained footing above weekly support at 104.70.
Areas of consideration:
For those who read Wednesday’s technical briefing you may recall the following (italics):
In order to climb above weekly support at 104.70 and make any progress, H4 resistances at 105, 105.14 and 105.24 must be cleared. Overthrowing H4 resistance at 105.24, therefore, may trigger bullish themes to take the currency pair up to at least August’s opening value at 105.75, with a break throwing September’s opening level at 105.88 into the mix.
Unfortunately, the H4 or H1 candles failed to retest 105.24 as support before rallying to fresh weekly peaks. Should this occur today, knowing where we’re coming from on the higher timeframes and the room seen to advance on the H4 to 105.75, buyers are likely to make an appearance.
USD/CAD:
The DXY crossing above 94.00 and closing higher for a fourth consecutive session, along with WTI concluding sharply off session peaks at $40.70 a barrel, led USD/CAD higher Wednesday.
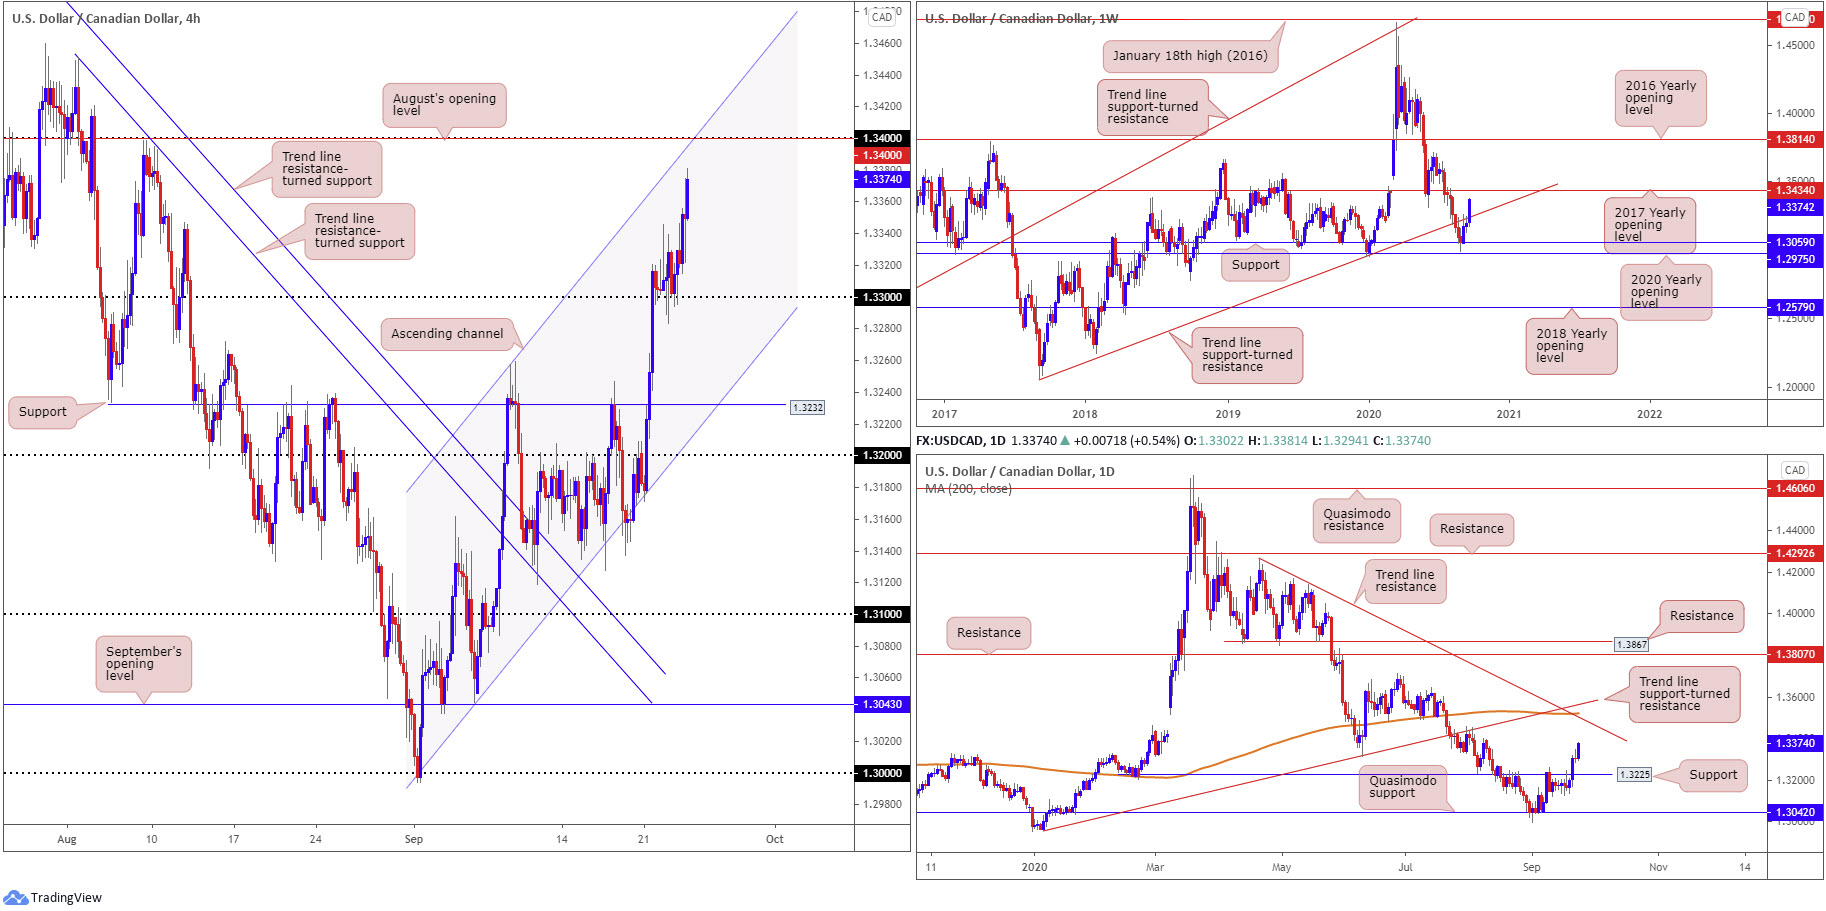
H4, after retesting the 1.33 handle, caught fresh bids and reached peaks at 1.3381. Further buying from here is likely to tag the 1.34 handle/August’s opening level, plotted close by channel resistance, taken from the high 1.3257.
From the higher timeframes, research notes the following:
Following a stronger-than-expected recovery off support at 1.3059, pinned just north of the 2020 yearly opening value at 1.2975 on the weekly timeframe, weekly price has taken on trend line support-turned resistance, taken from the low 1.2061. Continued upside highlights the 2017 yearly opening value at 1.3434 as possible resistance.
A closer reading of price action on the daily timeframe reveals resistance at 1.3225 gave way in recent trading. In terms of fresh resistance, we do not see much to hang our hat on until crossing swords with trend line resistance, etched from the high 1.4265, which happens to align closely with the 200-day SMA (orange – 1.3521). Also in close view is trend line support-turned resistance, taken from the low 1.2957. However, before reaching the said daily levels, we must contend with weekly resistance around 1.3434.
Areas of consideration:
For those who read Wednesday’s technical briefing you may recall the following (italics):
Although buyers appear to lack passion off 1.33 at the moment, the retest of this level is notable knowing we have room for buyers to stretch their legs on the higher timeframes to at least weekly resistance placed at 1.3434 (the 2017 yearly opening level).
Conservative traders are likely to seek additional confirmation, perhaps in the form of a H4 bullish candlestick pattern, before pulling the trigger, targeting the aforementioned H4 resistances.
Traders currently long are likely honing in on 1.34, followed by weekly resistance (the 2017 yearly opening value) at 1.3434. Here sellers could make a show, though should follow-through buying develop, technical eyes will likely be on the daily trend line resistance (1.4265).
USD/CHF:
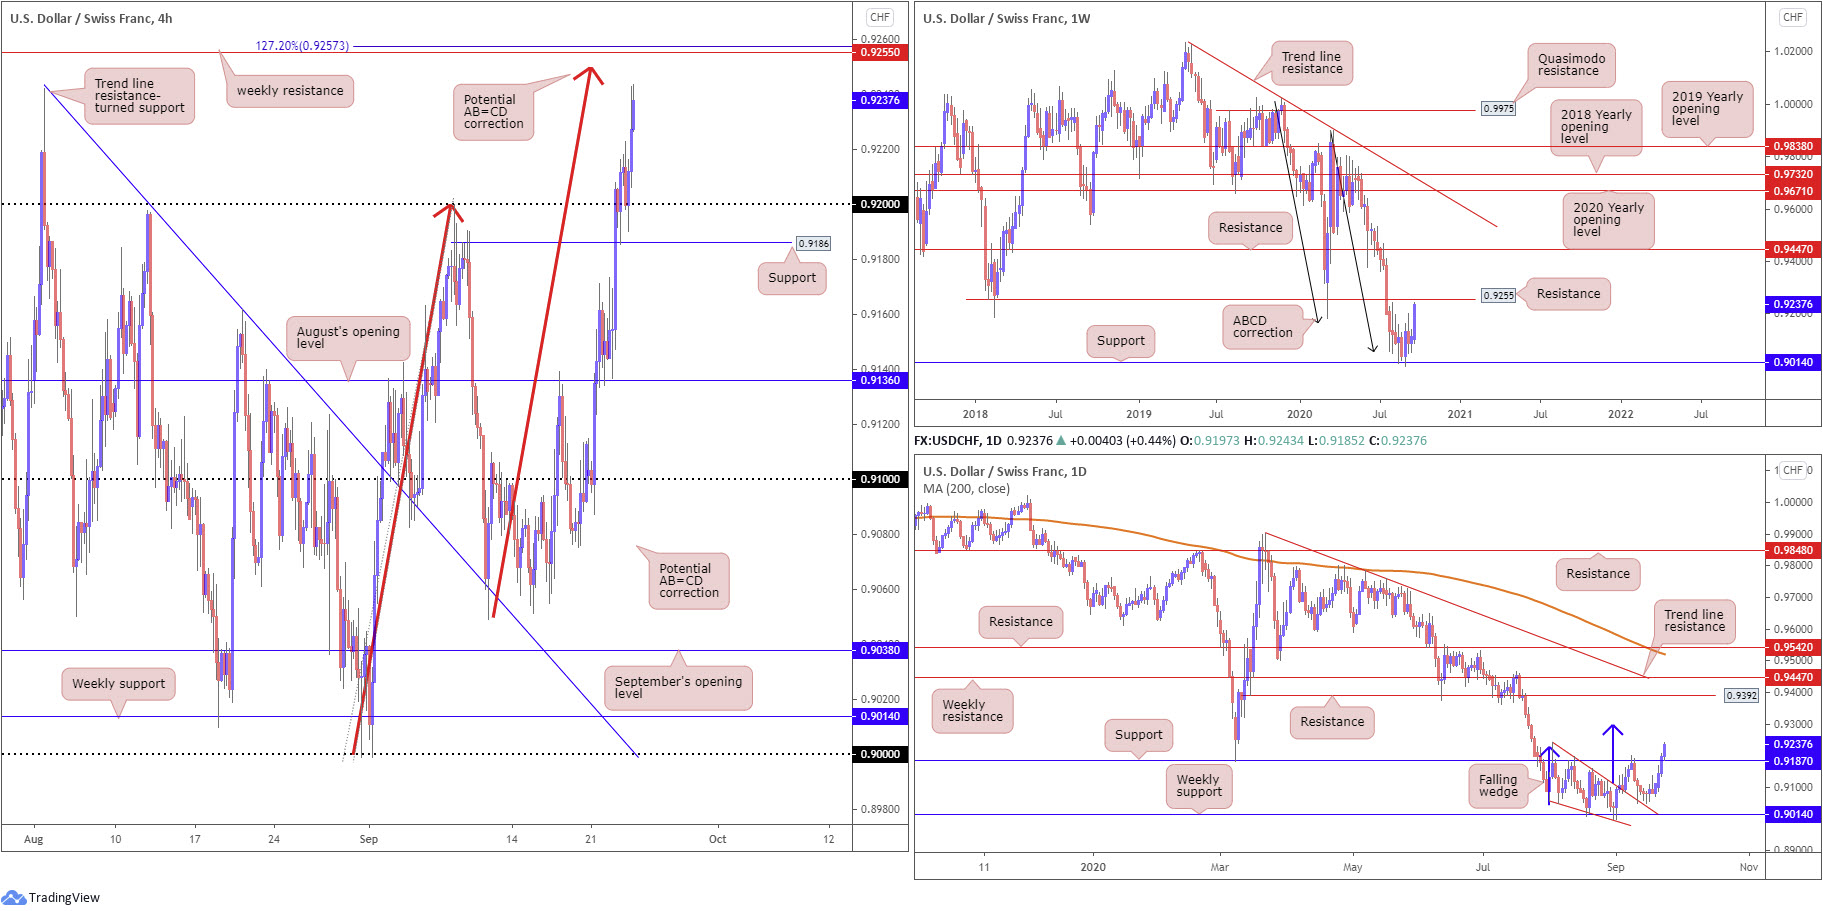
0.92 served well as support Wednesday, welcoming a retest mid-way through the London session. H4 rebounded strongly from the round number and extended gains heading into US trading, positioning weekly resistance at 0.9255 within striking distance, which happens to merge closely with a H4 AB=CD (red arrows) completion at 0.9249 and a 127.2% Fibonacci extension point at 0.9257.
Movement on the weekly timeframe reveals buyers staged an impressive recovery off support at 0.9014, potentially gleaning additional impetus from ABCD support at 0.9051 (black arrows), and is now approaching resistance mentioned above at 0.9255 (a previous Quasimodo support level).
Form the daily timeframe, the beginning of September observed the upper border of a falling wedge pattern (drawn from the high 0.9241 and a low of 0.9056) give way, consequently unlocking a bullish reversal signal. Although resistance at 0.9187 initially put a lid on gains, buyers regained consciousness after retesting the falling wedge and recently engulfed the aforementioned resistance level. Weekly resistance at 0.9255 is next on tap, followed by the daily falling wedge take-profit target (blue arrows) at 0.9297.
Areas of consideration:
For those who read Wednesday’s technical briefing you may recall the following (italics):
A decisive H4 close above 0.92 today could call for further buying (conservative traders will likely want to see a retest of the round number form before committing), targeting weekly resistance at 0.9255, which merges closely with a H4 AB=CD (red arrows) pattern at 0.9249 and 127.2% Fibonacci extension point at 0.9257.
With H4 approaching AB=CD resistance around 0.9249 and weekly price closing in on resistance from 0.9255, buyers are likely to begin liquidating longs with fresh sellers also potentially making an appearance.
Dow Jones Industrial Average:
US equity benchmarks tumbled Wednesday amid rising COVID-19 cases. The Dow Jones Industrial Average dropped 525.05 points, or 1.92%; the S&P 500 declined 78.65 points, or 2.37% and the Nasdaq traded lower by 330.65 points, or 3.02%.
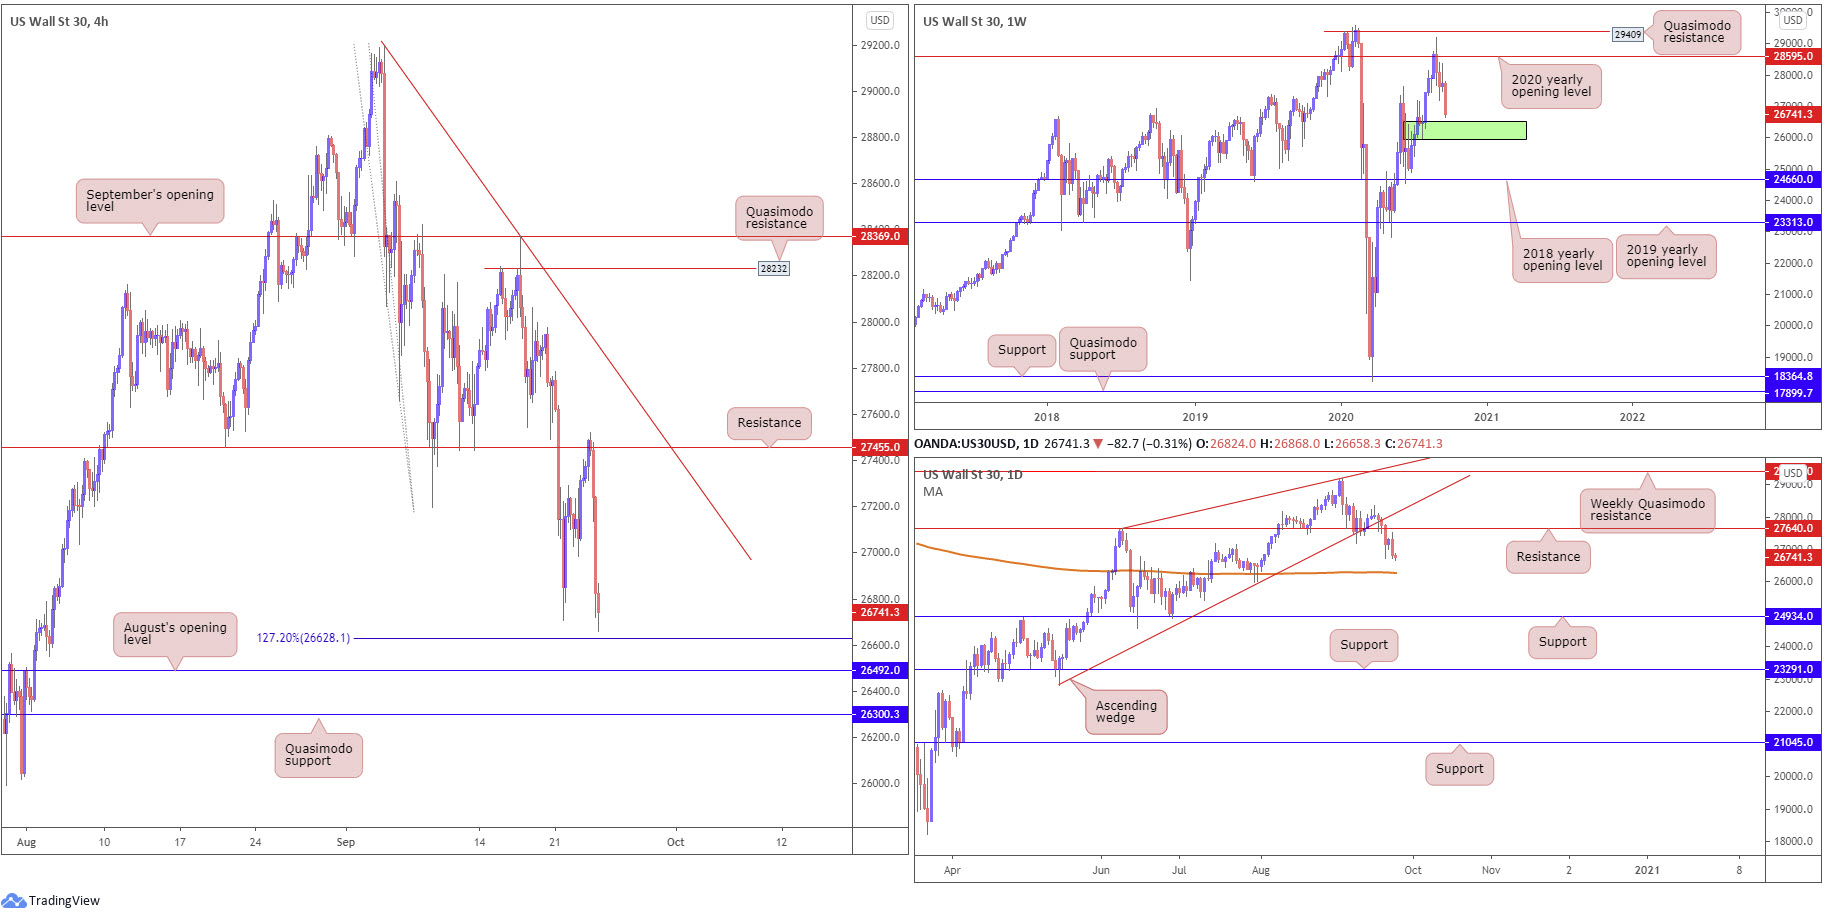
Technically, from the weekly timeframe, the unit is seen fast approaching demand (green) at 25916-26523, an area active buyers may try and defend. This follows a recent attempt to overrun the 2020 yearly opening value at 28595 (sited just under Quasimodo resistance at 29409).
Trading on the daily timeframe recently elbowed through an ascending wedge, taken from the low 22803, and support from 27640 (now a serving resistance). This, alongside Wednesday’s bearish outside reversal candle, potentially sets the stage for a move to the 200-day SMA (orange – 26275), followed by a possible run to support priced in at 24934.
H4 resistance at 27455 side-lined hopes of additional recovery gains on Wednesday, as price aggressively turned to lower levels in recent hours, engulfing Monday’s low at 26708 and shining the spotlight on a 127.2% Fibonacci extension point at 26628, followed by August’s opening value at 26492. Follow-through downside through the aforementioned levels points to an approach towards Quasimodo support at 26300.
Areas of consideration:
The weekly and daily timeframes suggest additional losses.
While August’s opening value at 26492 could encourage buying, given the level residing within weekly demand at 25916-26523, H4 Quasimodo support at 26300 is equally likely to entice buyers due to the 200-day SMA merging closely with the level (and also positioned within the aforementioned weekly demand).
XAU/USD (GOLD):
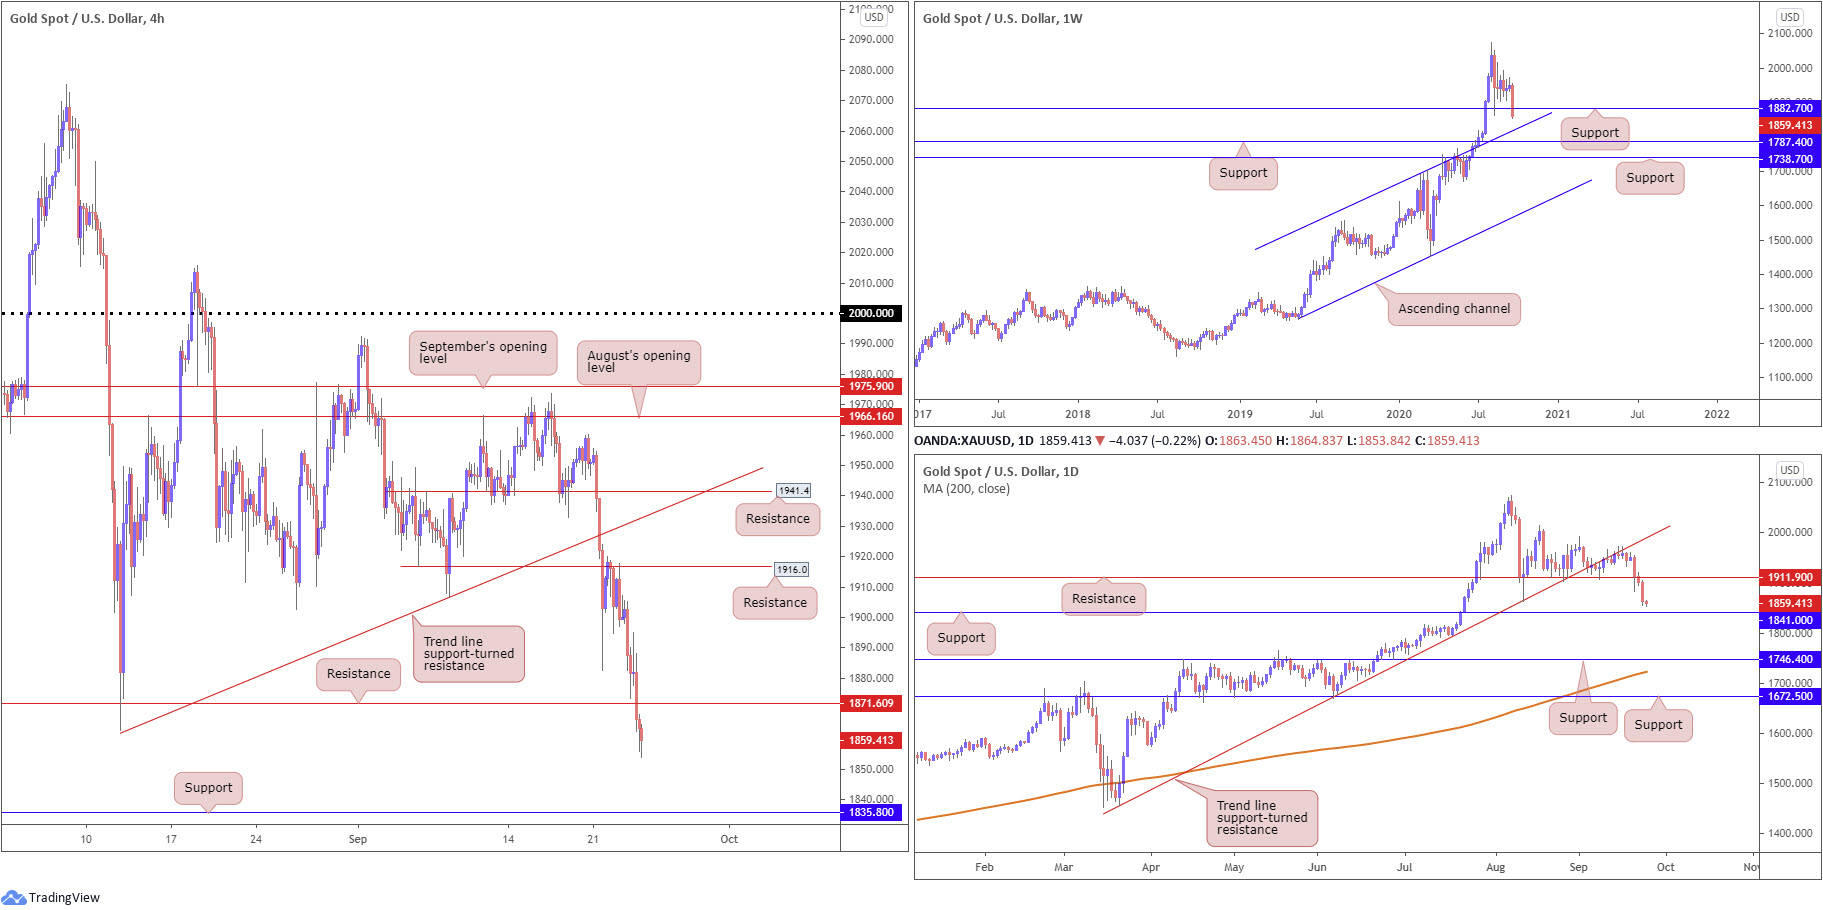
Weekly support at $1,882 recently made its way back into the spotlight and is currently under pressure, with gold trading lower by nearly 5% on the week so far. Should sellers strengthen their grip, channel resistance-turned support, etched from the high $1,703, might enter view.
Support from $1,911 was recently engulfed (now serving as resistance) on the daily timeframe, following last week’s action gripping trend line support-turned resistance, taken from the low $1,455. Consequently, after pencilling in a third consecutive daily loss, this shifts focus to support at $1,841.
On the H4 timeframe, we can see resistance at $1,916 maintained its position (a previous Quasimodo support) in recent trade. Following Tuesday’s bearish outside candle, Wednesday explored lower levels and took over support at $1,871 (now an acting resistance), directing the technical radar to support at $1,835.
Areas of consideration:
According to technical structure, price indicates sellers still have the advantage until connecting with daily support at $1,841, closely shadowed by H4 support at $1,835 and then the weekly channel support (around $1,825ish).
Therefore, between $1,825/$1,841, this area represents a clear take-profit target for current shorts and, at the same time, provides a platform for buyers to consider.
The accuracy, completeness and timeliness of the information contained on this site cannot be guaranteed. IC Markets does not warranty, guarantee or make any representations, or assume any liability regarding financial results based on the use of the information in the site.
News, views, opinions, recommendations and other information obtained from sources outside of www.icmarkets.com.au, used in this site are believed to be reliable, but we cannot guarantee their accuracy or completeness. All such information is subject to change at any time without notice. IC Markets assumes no responsibility for the content of any linked site.
The fact that such links may exist does not indicate approval or endorsement of any material contained on any linked site. IC Markets is not liable for any harm caused by the transmission, through accessing the services or information on this site, of a computer virus, or other computer code or programming device that might be used to access, delete, damage, disable, disrupt or otherwise impede in any manner, the operation of the site or of any user’s software, hardware, data or property.


