
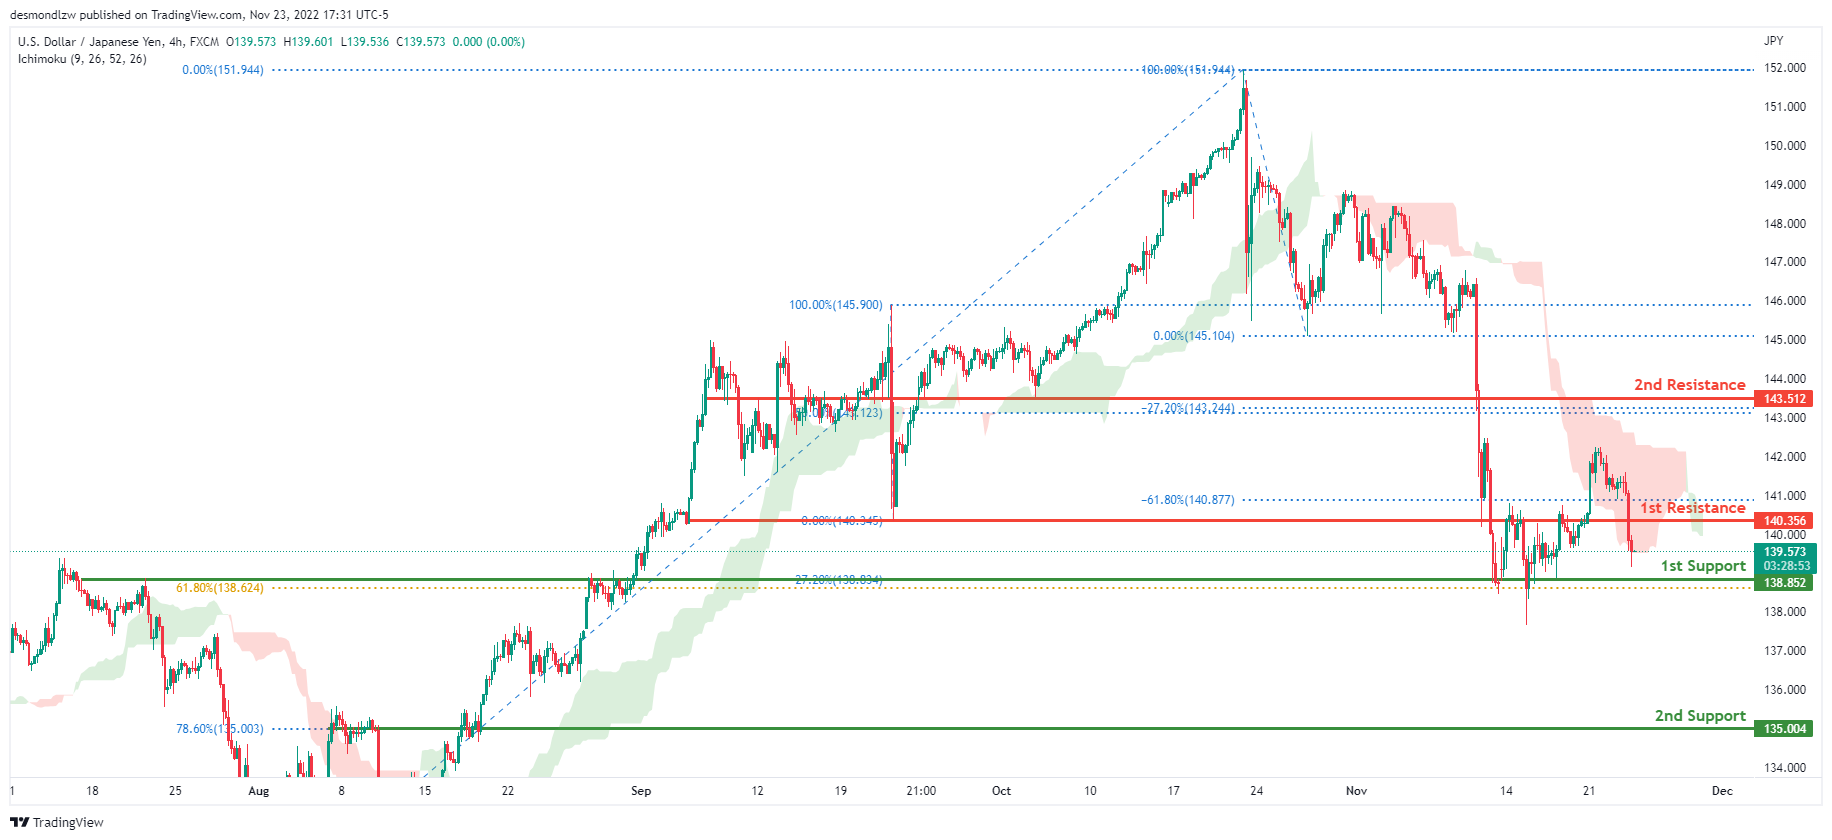
USD/JPY:
The current general bias for USDJPY on the H4 chart is bearish. To add confluence to this, the price is under the Ichimoku cloud which indicates a bearish market. If the bearish momentum continues, expect USDJPY to head towards the 1st support line at 138.852, where the –27.2% Fibonacci expansion line is located. In an alternative scenario, price could go up to retest the 1st resistance line at 140.356, where the -61.8% Fibonacci expansion line and previous low are located.
Areas of consideration:
- H4 time frame, 1st resistance at 140.356
- H4 time frame, 1st support at 138.852
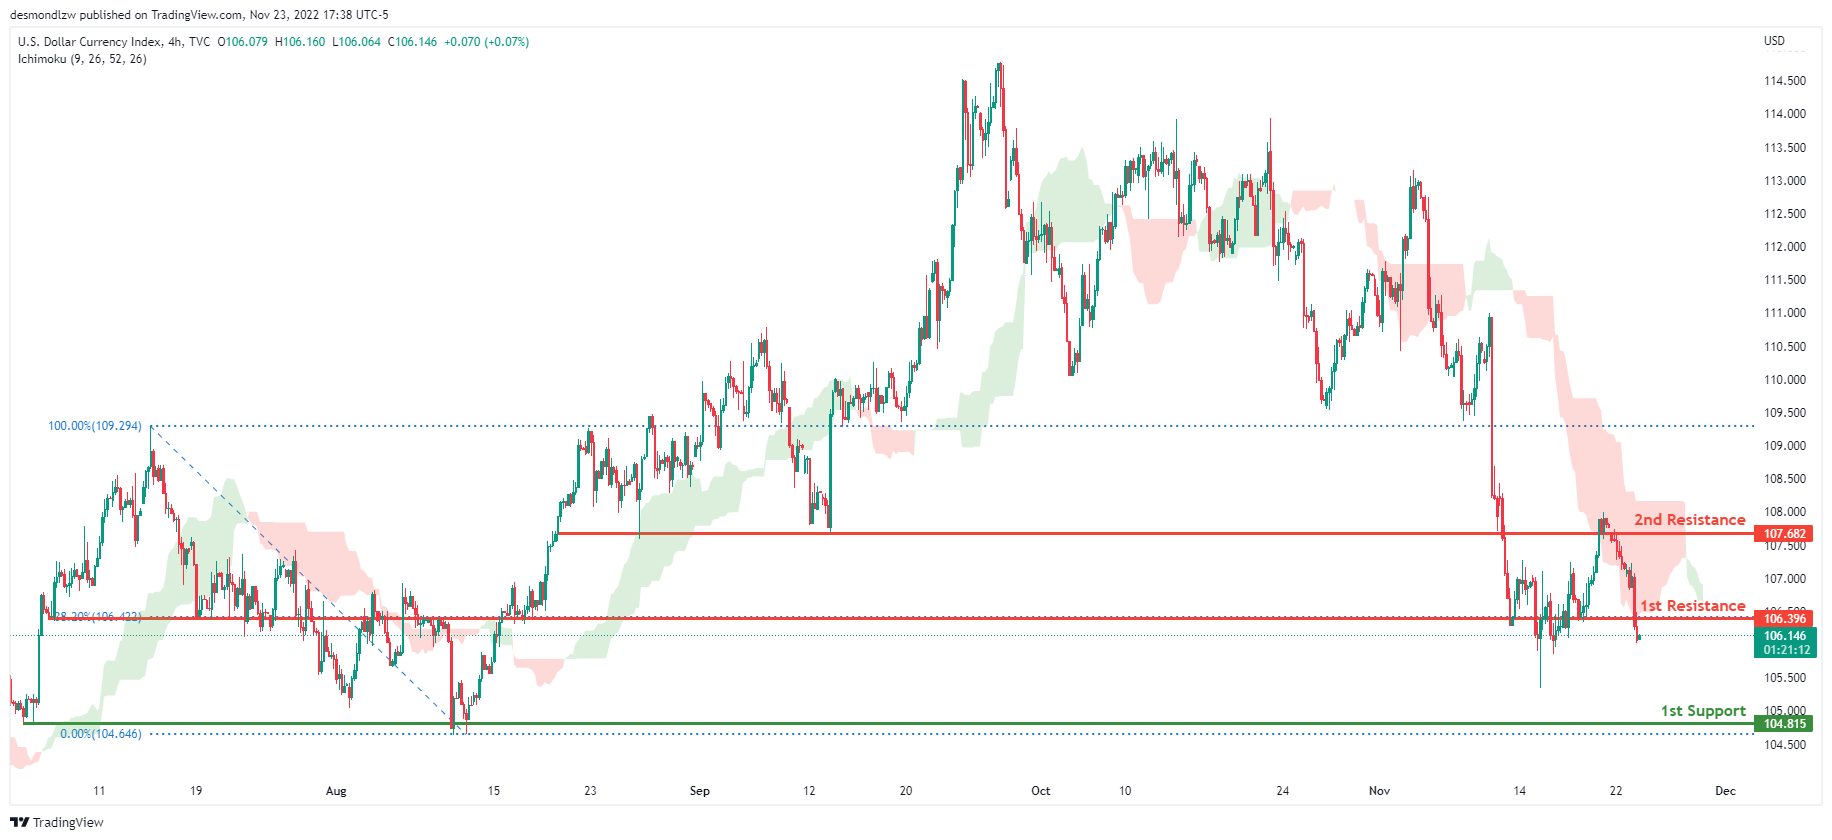
DXY:
On the H4 chart, the overall bias for DXY is bearish. To add confluence to this, the price is crossing below the Ichimoku cloud which indicates a bearish market. If this bearish momentum continues, expect the price to head towards the 1st support line at 104.815 where the previous low and the 0% Fibonacci line are located. In an alternative scenario, price could head back up and retest the 1st resistance line at 106.396 where the 38.2% fibonacci line is located.
Areas of consideration:
- H4 time frame, 1st resistance at 106.396
- H4 time frame, 1st support at 104.815
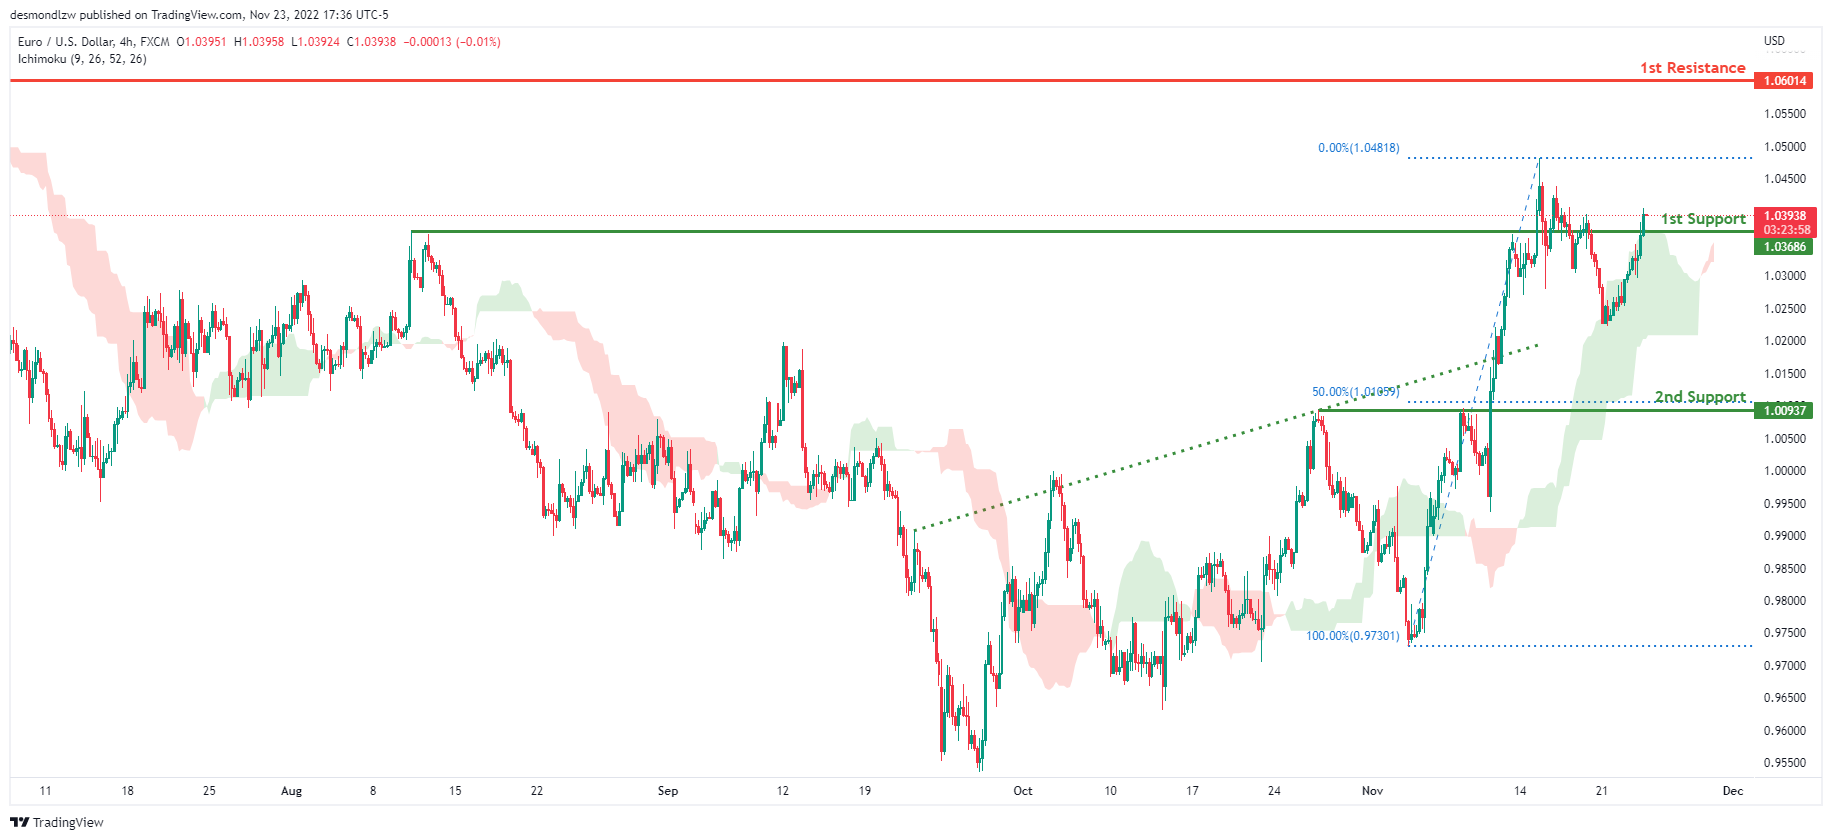
EUR/USD:
Looking at the H4 chart, my overall bias for EURUSD is bullish due to the current price being above the Ichimoku cloud, indicating a bullish market. To add confluence to this bias, price has also broken above the ascending trend line. If this bullish momentum continues, expect the price to possibly head towards the 1st resistance at 1.06014, where the previous swing high is located. In an alternate scenario, price could possibly head back down towards the 1st support level at 1.03686, where the previous swing high is located.
Areas of consideration :
- H4 1st resistance at 1.06014
- H4 1st support at 1.0368`
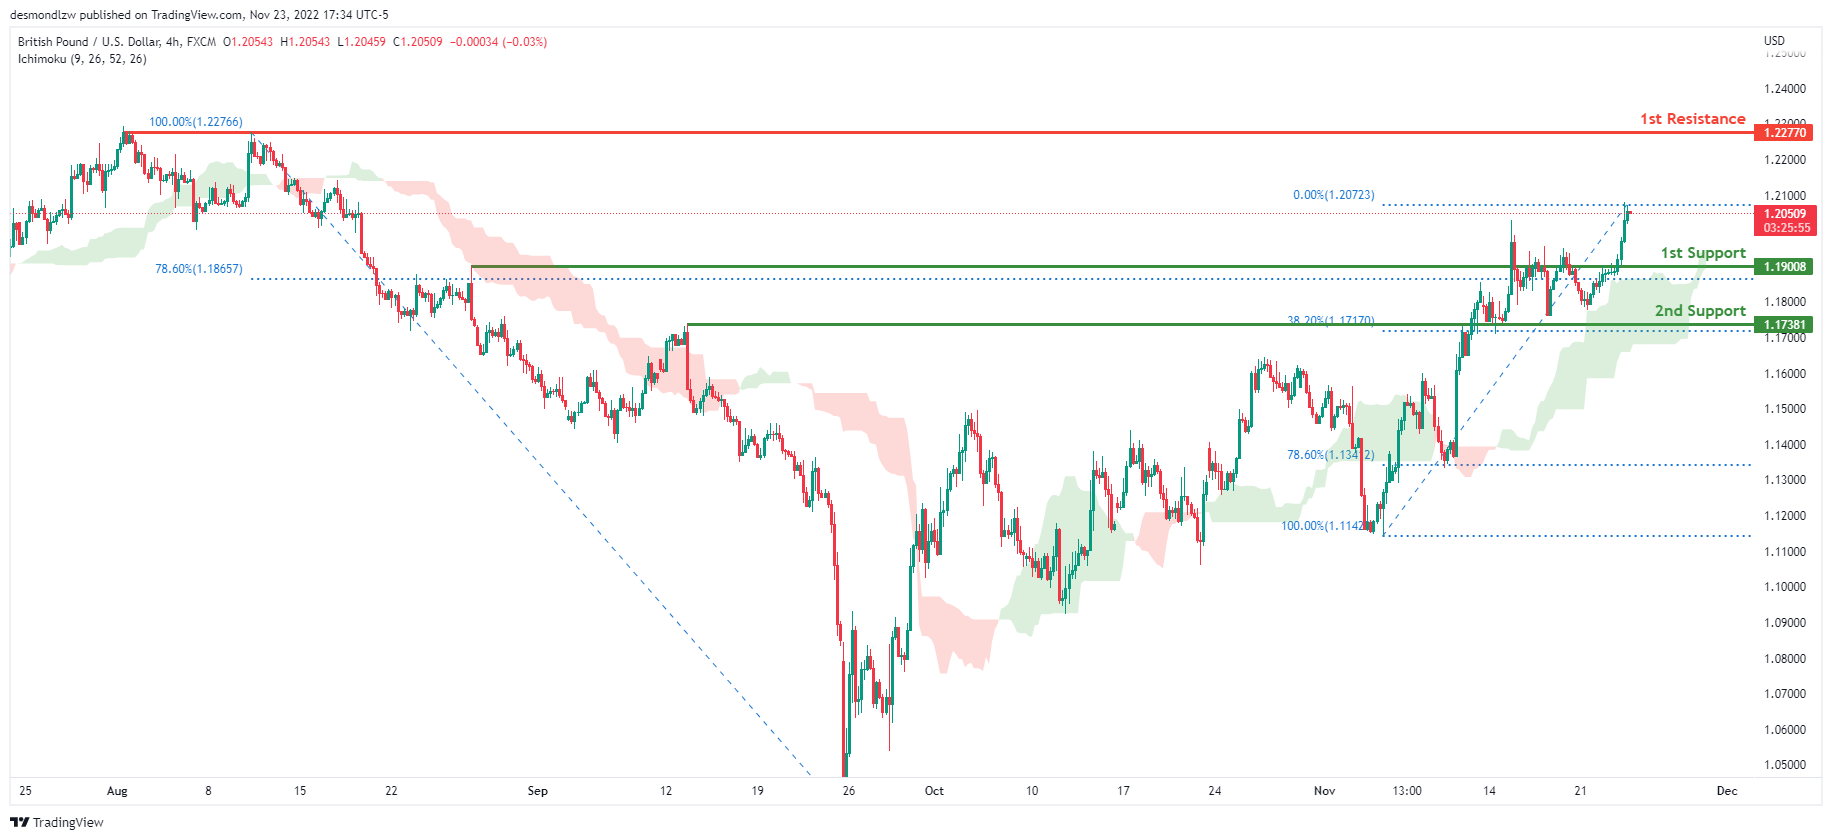
GBP/USD:
Looking at the H4 chart, my overall bias for GBPUSD is bullish due to the current price being above the Ichimoku cloud, indicating a bullish market. Expecting price to possibly head towards the 1st resistance line at 1.22770, where the previous swing high is. In an alternative scenario, price could possibly head back down to retest the 1st support line at 1.19008, where the 78.6% Fibonacci line is.
Areas of consideration:
- H4 1st resistance at 1.22770
- H4 1st support at 1.19008
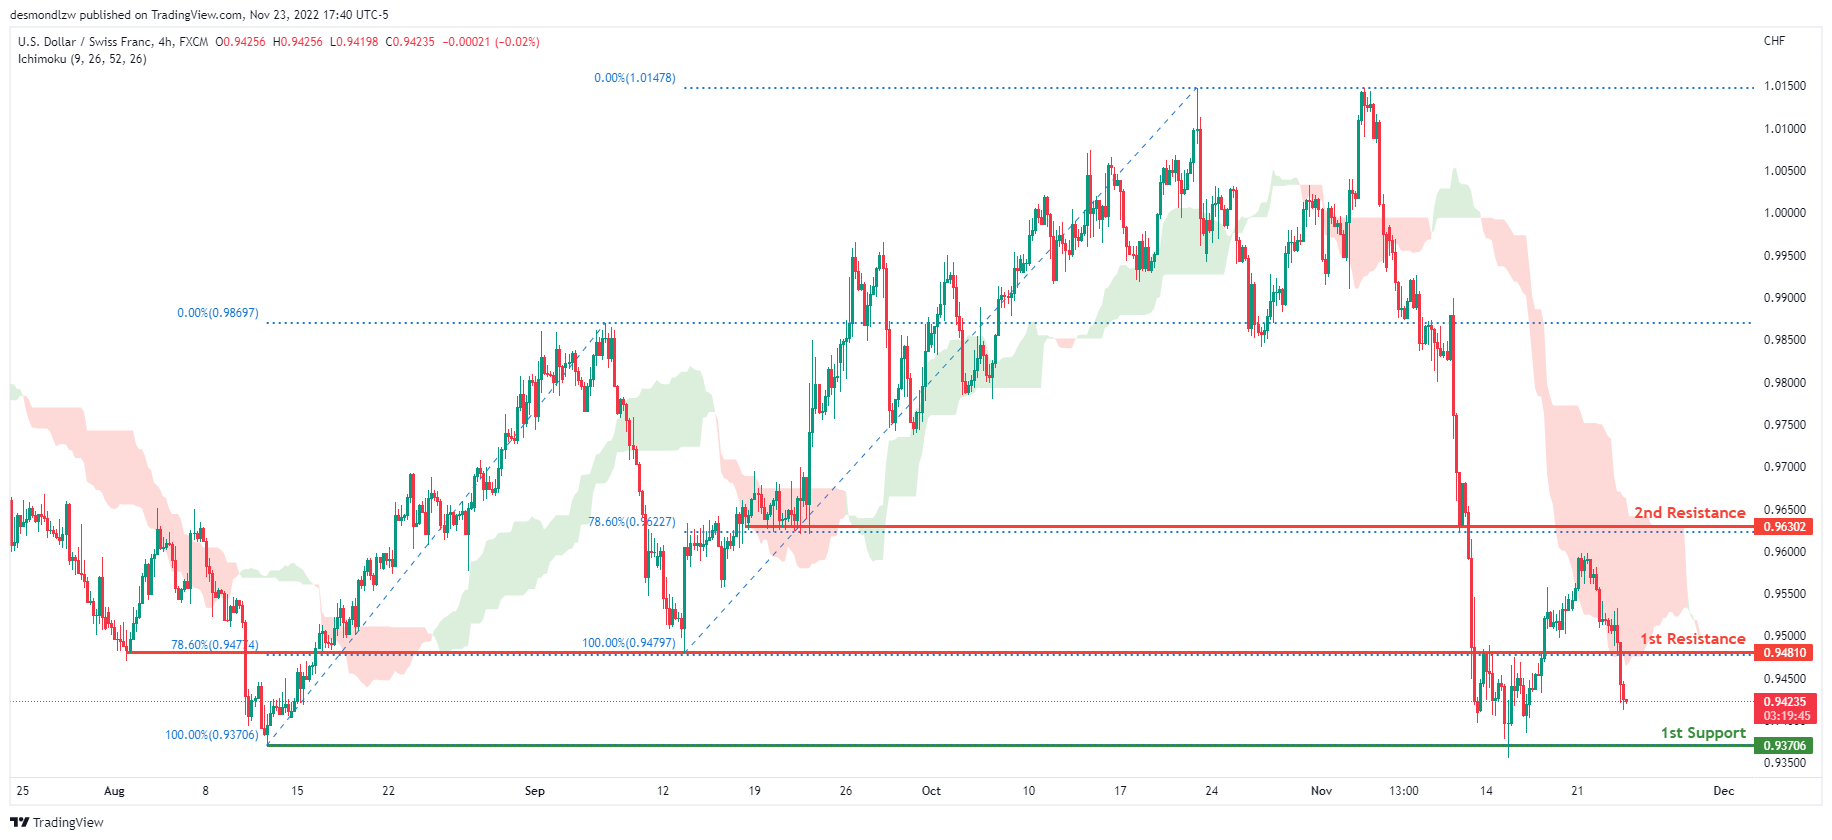
USD/CHF:
The overall bias for USDCHF on the H4 chart is bearish. In addition, the price is crossing below the Ichimoku cloud, indicating a bearish market. If the current bearish trend continues, expect price to continue heading towards the 1st support line at 0.93706, where the previous swing low is. In an alternate scenario, price could rise towards the 1st resistance line at 0.94810, where the 78.6% Fibonacci line is.
Areas of consideration
- H4 1st support at 0.93706
- H4 1st resistance at 0.94810
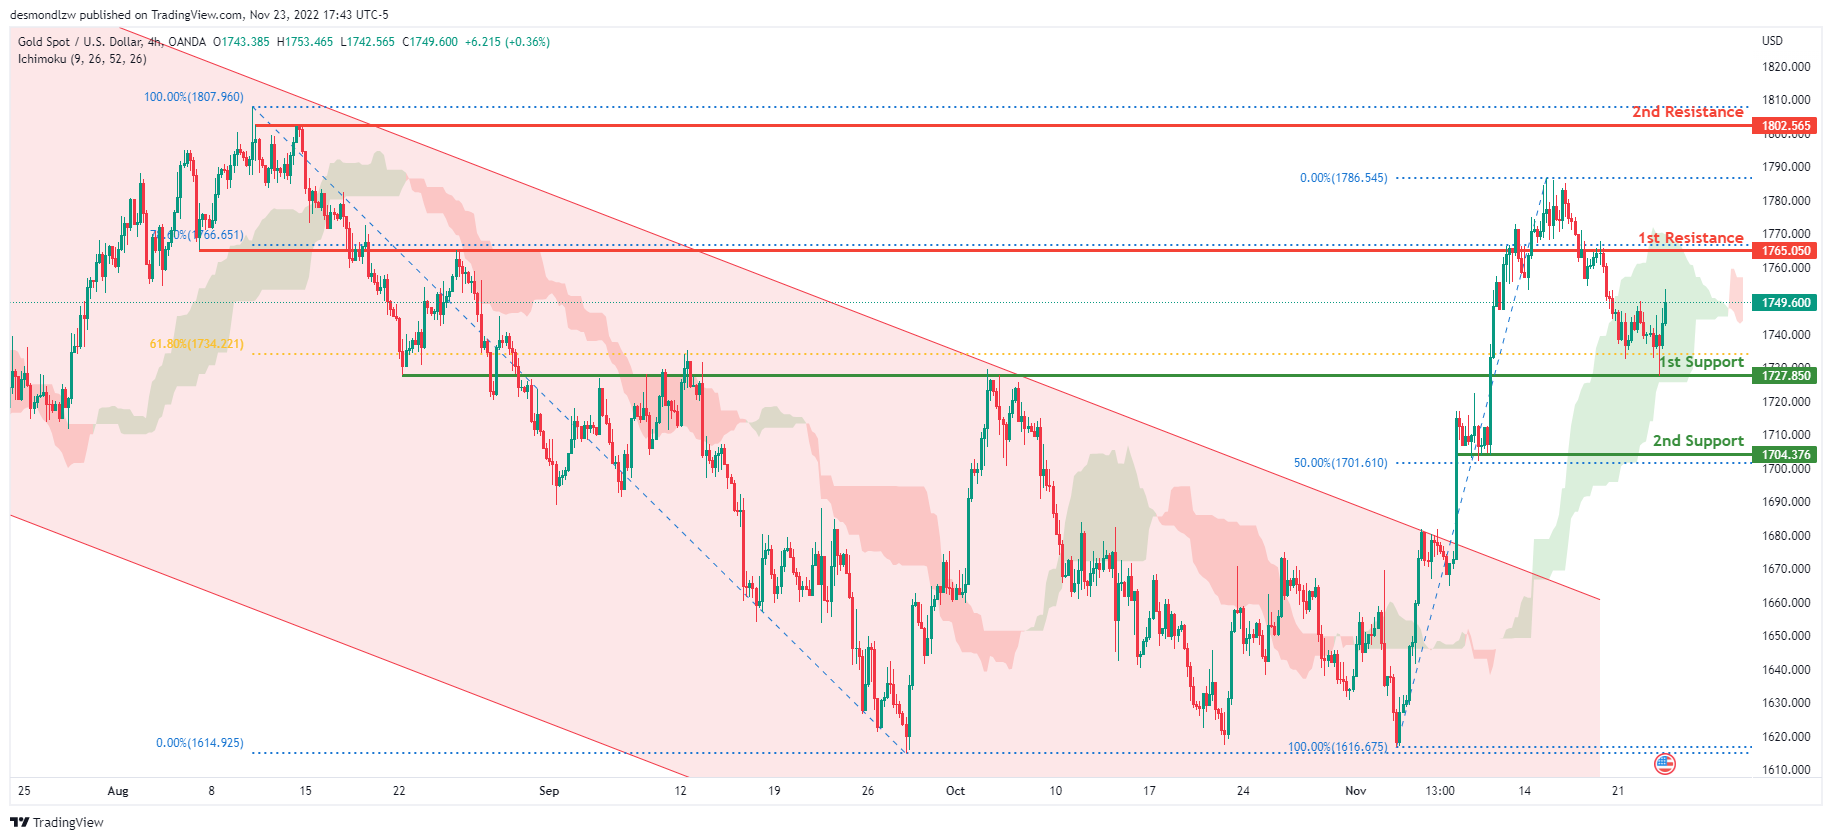
XAU/USD (GOLD):
Looking at the H4 chart, my overall bias for XAUUSD is bearish due to the current price crossing below the Ichimoku cloud, indicating a bearish market. If this bearish momentum continues, expect price to possibly head back down towards the 1st support level at 1727.850, where the 38.2% and 61.8% Fibonacci lines are located.
In an alternate scenario, price could possibly head back up towards the 1st resistance at 1765.050, where the 78.6% Fibonacci line is located.
Areas of consideration:
- H4 time frame, 1st resistance at 1765.483
- H4 time frame, 1st support at 1727.850
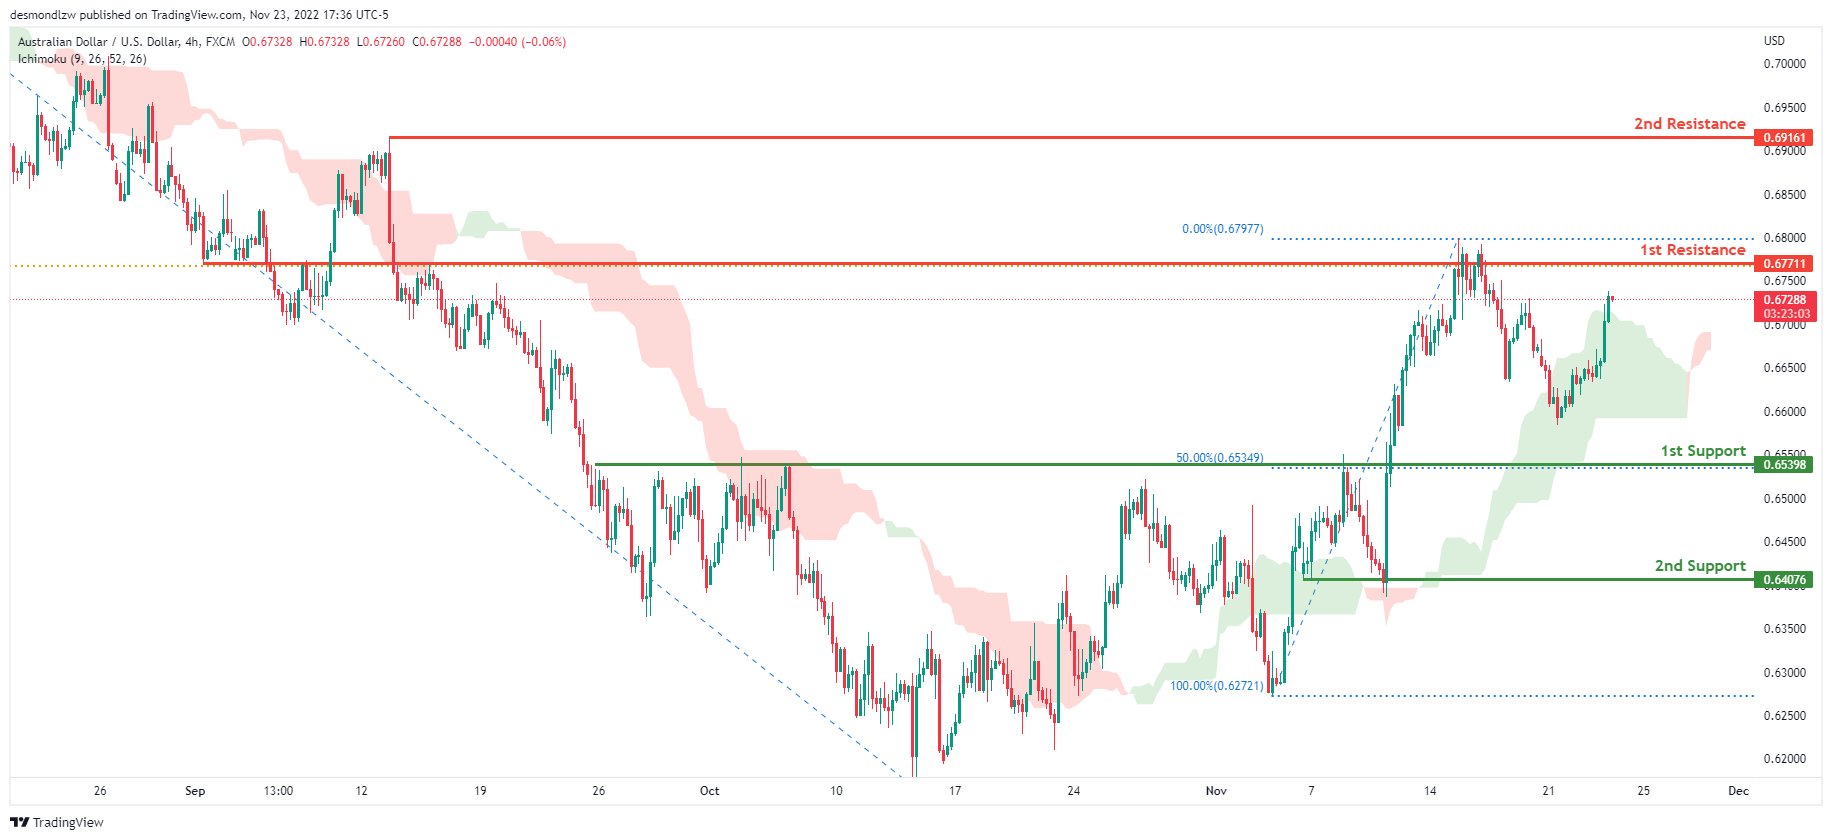
AUD/USD:
Looking at the H4 chart, my overall bias for ADUSD is bullish due to the current price being above the Ichimoku cloud, indicating a bullish market. Expecting price to continue heading towards the 1st resistance at 0.67711 where the 61.8% Fibonacci line is. In an alternative scenario, price could possibly head back down to retest the 1st support line at 0.65398 where the 50% Fibonacci line is.
Areas of consideration
- H4, 1st resistance at 0.67711
- H4, 1st support at 0.65398
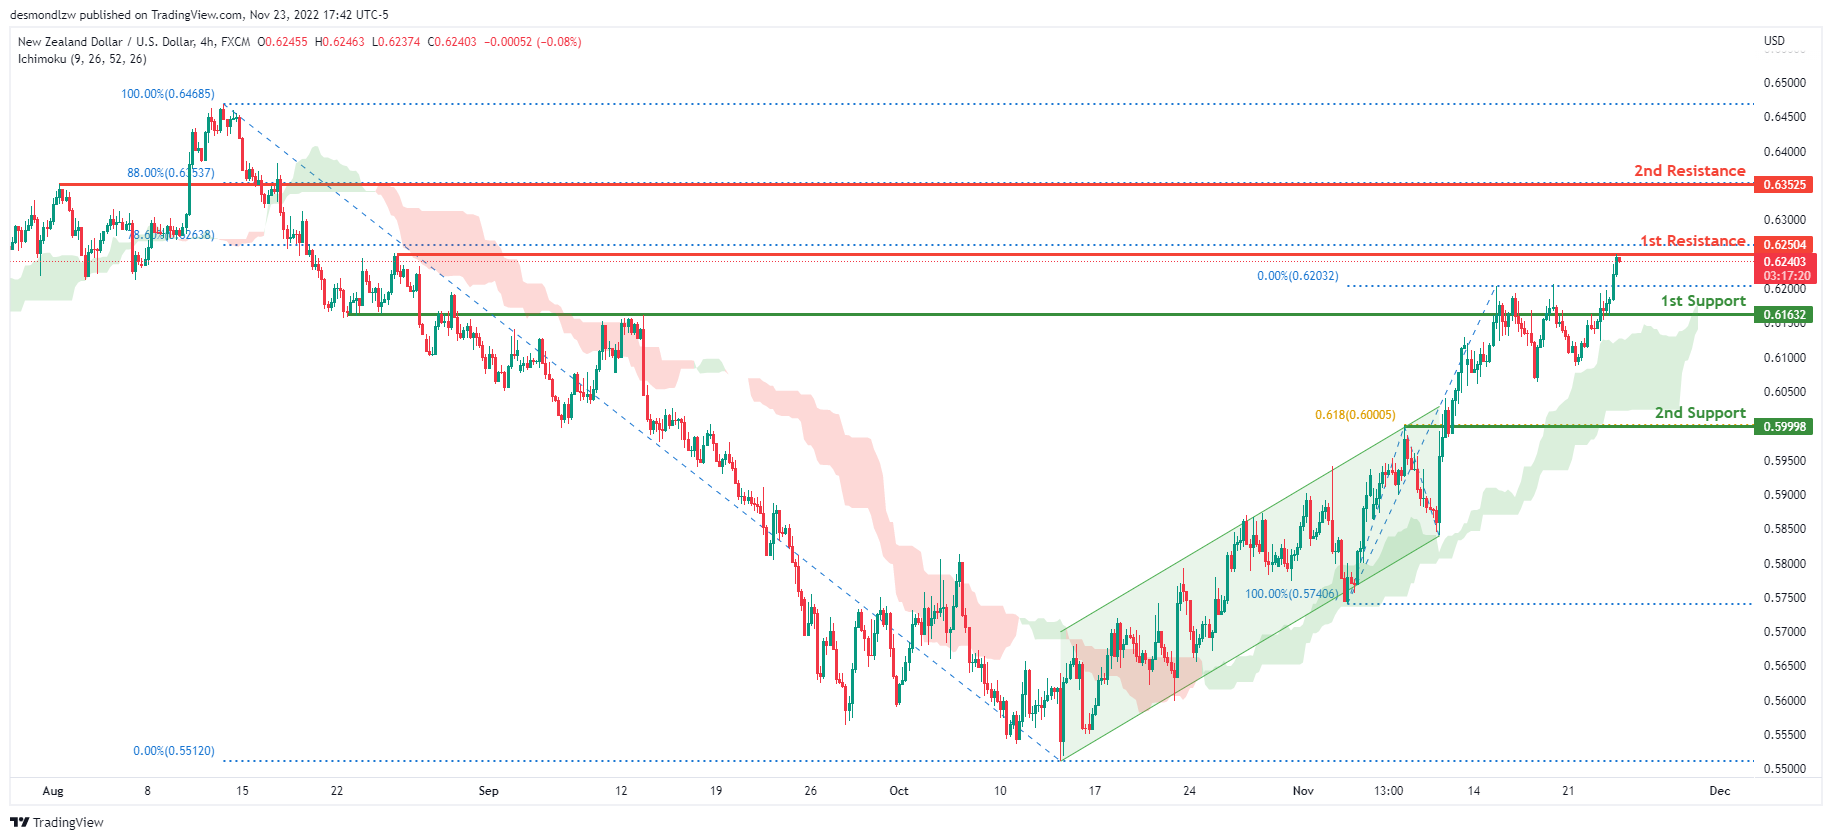
NZD/USD:
On the H4 chart, we have a bullish bias with the price moving above the Ichimoku cloud and has broken out of the ascending channel. If this bullish momentum continues, expect the price to break the 1st resistance line at 0.62504, where the 78.6% Fibonacci line is, before heading towards the 2nd resistance line at 0.63525, where the 88% Fibonacci line is. Alternatively, the price may head back down and break the 1st support at 0.61632, where the previous swing high is located, before heading towards the 2nd support at 0.59998 where the 61.8% Fibonacci line is.
Areas of consideration:
- H4 time frame, 1st resistance at 0.62504
- H4 time frame, 2nd resistance at 0.63525
- H4 time frame, 1st support at 0.61632
- H4 time frame, 2nd support at 0.59998
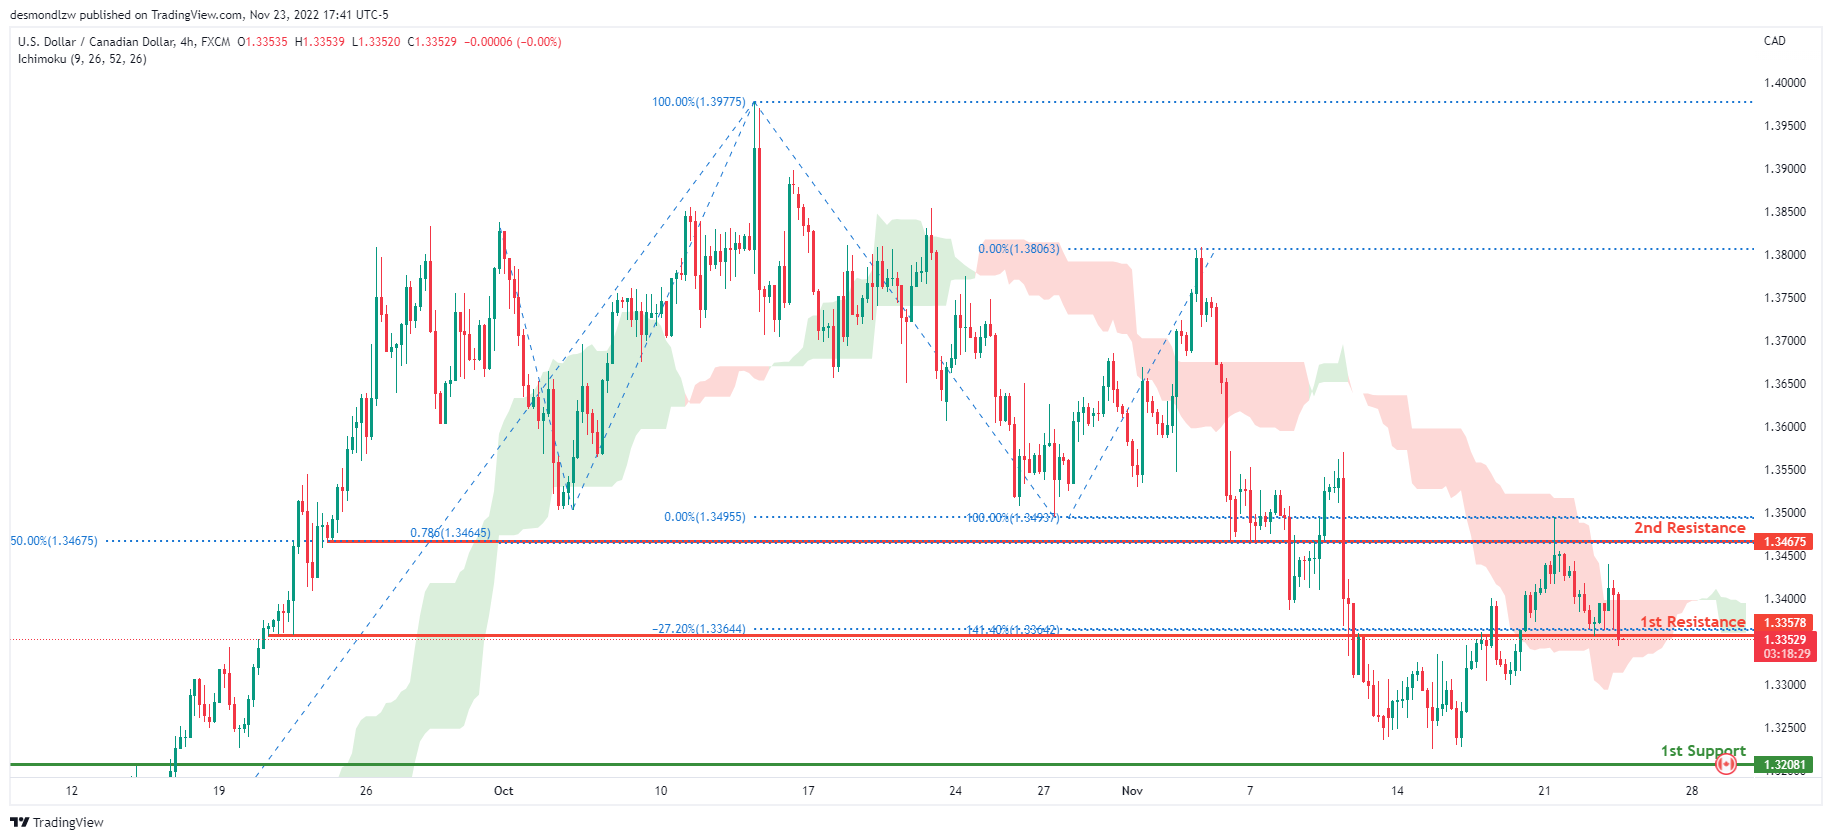
USD/CAD:
On the H4 chart, the overall bias for USDCAD is bearish. To add confluence to this, the price is crossing below the Ichimoku cloud which indicates a bearish market. If this bearish momentum continues, expect the price to continue heading towards the 1st support line at 1.32081 where the 78.6% Fibonacci line is located. In an alternative scenario, price could head back up to retest the 1st resistance line at 1.33578, where the -27.2% Fibonacci expansion line and 141.4% Fibonacci line is.
Areas of consideration:
- H4 time frame, 1st resistance at 1.33578
- H4 time frame, 1st support at 1.32081
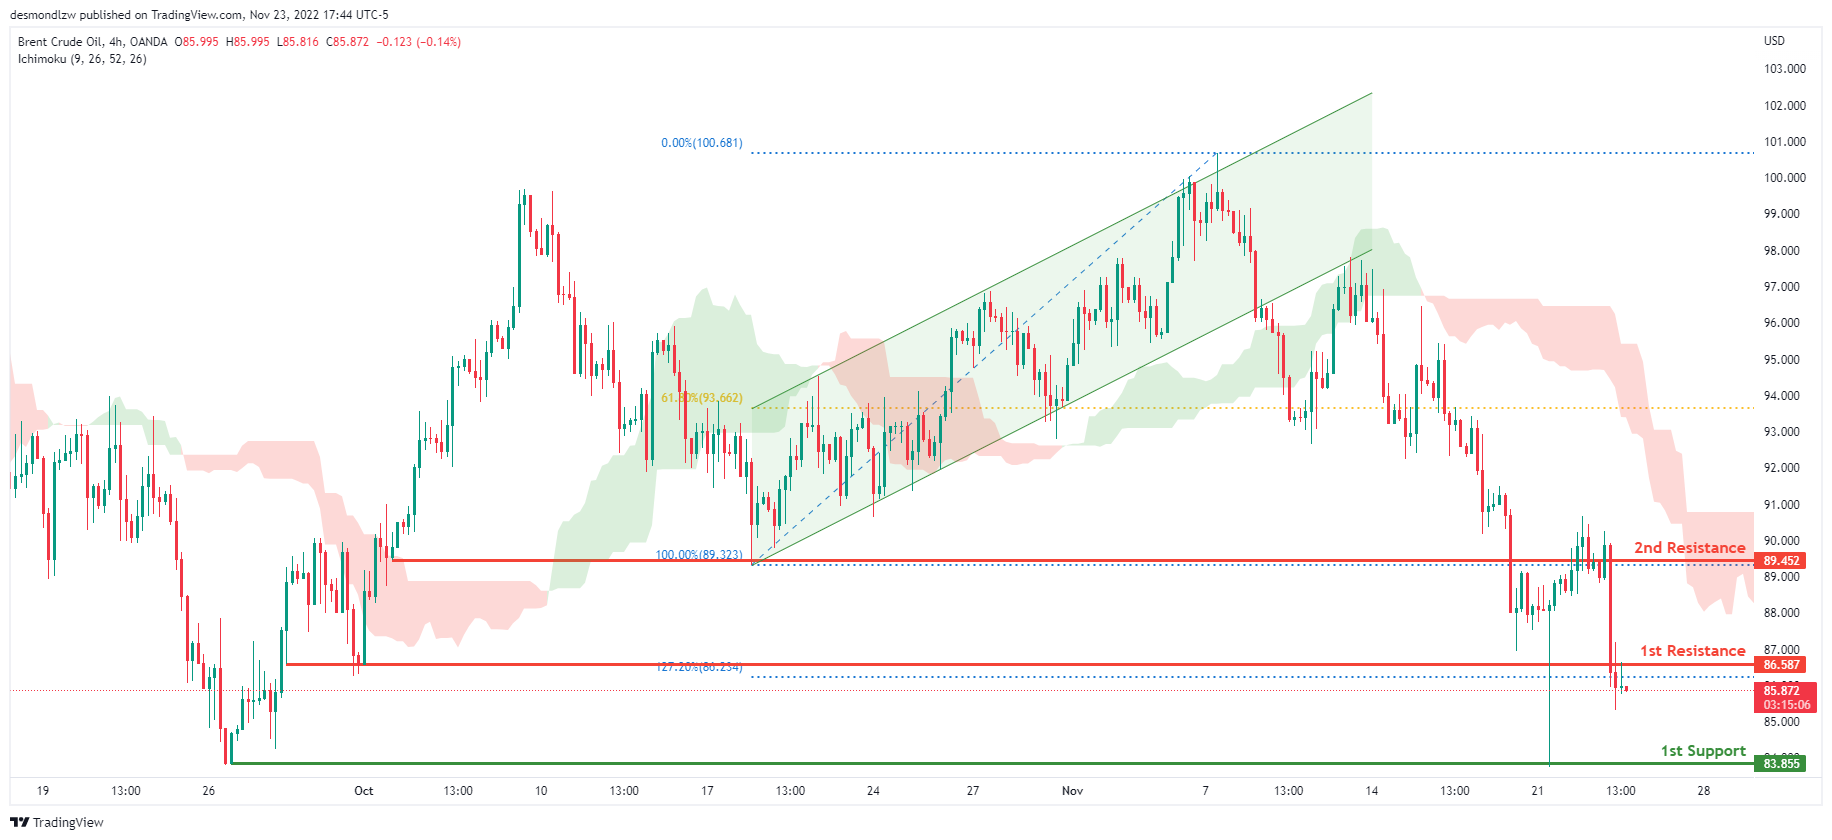
OIL:
Looking at the H4 chart, my overall bias for BCOUSD is bearish due to the current price being below the Ichimoku cloud, indicating a bearish market. If this bearish momentum continues, expect price to possibly head towards the 1st support at 83.855, where the previous swing low is located. In an alternate scenario, price could possibly head back up to retest the 1st resistance level at 86.587, where the 127.2% Fibonacci extension line is located.
Areas of consideration:
- H4 time frame, 1st resistance at 86.587
- H4 time frame, 1st support at 83.855
- H4 time frame, 2nd support at 89.452
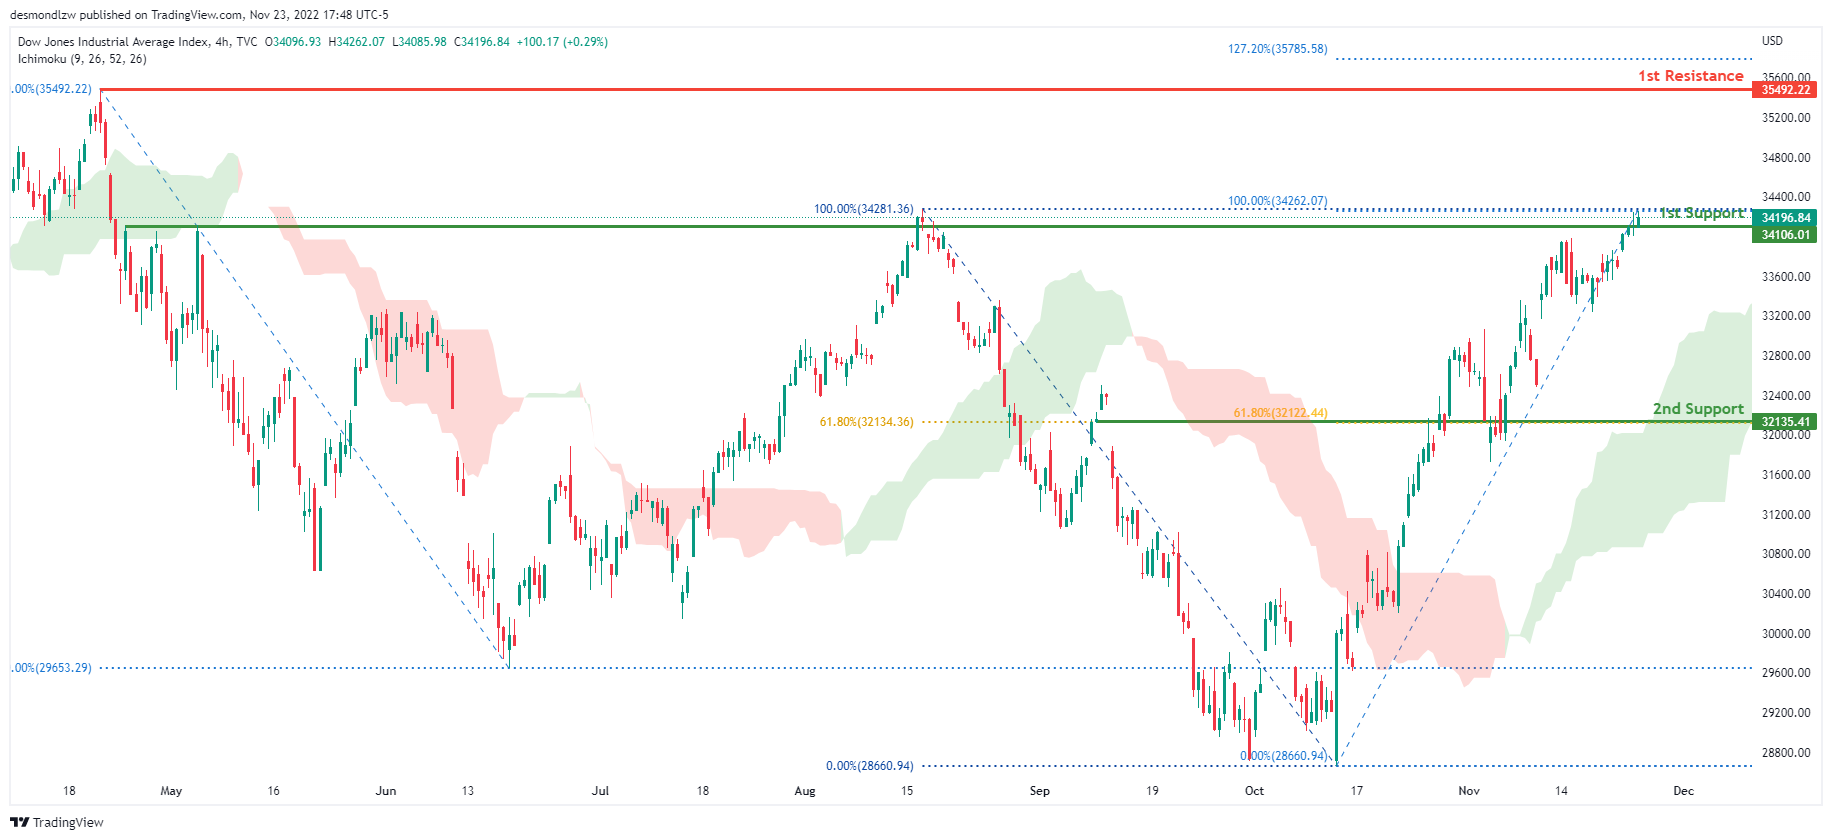
Dow Jones Industrial Average:
On the H4 chart, the overall bias for DJI is bullish. To add confluence to this, the price is above the Ichimoku cloud which indicates a bullish market. If this bullish momentum continues, expect the price to continue heading towards the 1st resistance line at 35492.22, where the previous swing high and 127.2% Fibonacci extension line is. In an alternative scenario, price could head back down breaking the 1st support line at 34106.01, where the previous swing high is before heading towards the 2nd support at 32135.41, where the 61.8% Fibonacci line is.
Areas of consideration:
- H4 time frame, 1st support at 34106.01
- H4 time frame, 2nd support at 32135.41
- H4 time frame, 1st Resistance at 35492.22
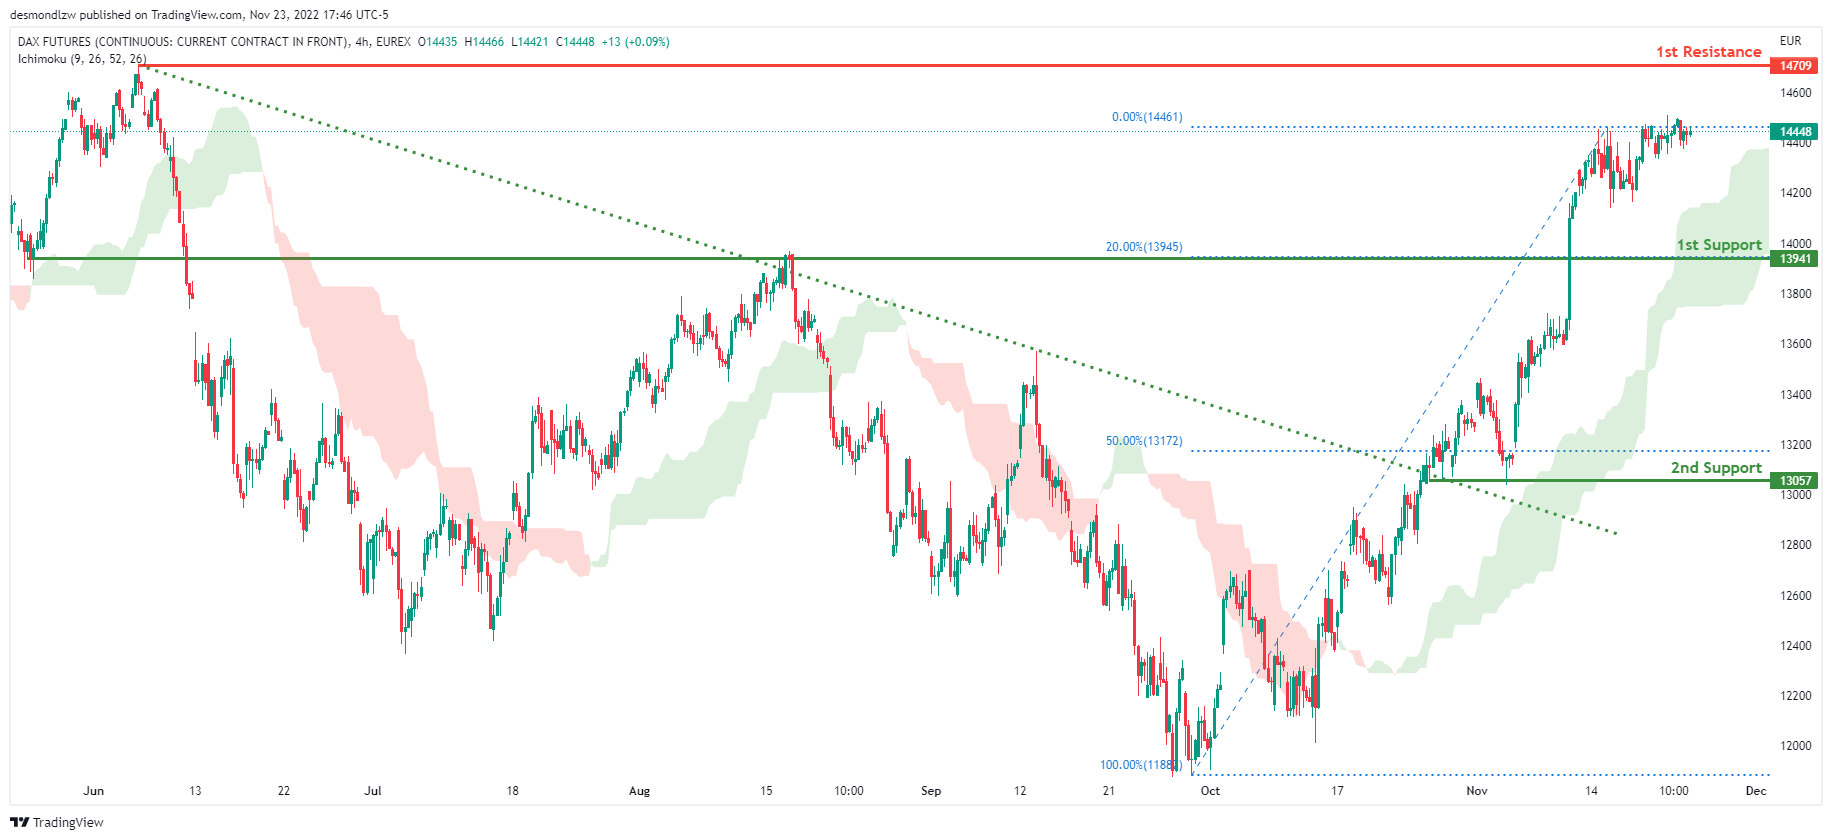
DAX:
The H4 chart shows a bullish bias, with price breaking through the descending trendline and rising above the Ichimoku cloud. Price is expected to maintain its bullish momentum and rise to the first resistance level at 14709, where the previous swing high is located. Alternatively, the price could fall to the first support level at 13941, which corresponds to the 20% Fibonacci line.
Areas of consideration:
- H4 time frame, 1st resistance is at 14709
- H4 time frame, 1st support is at 13941
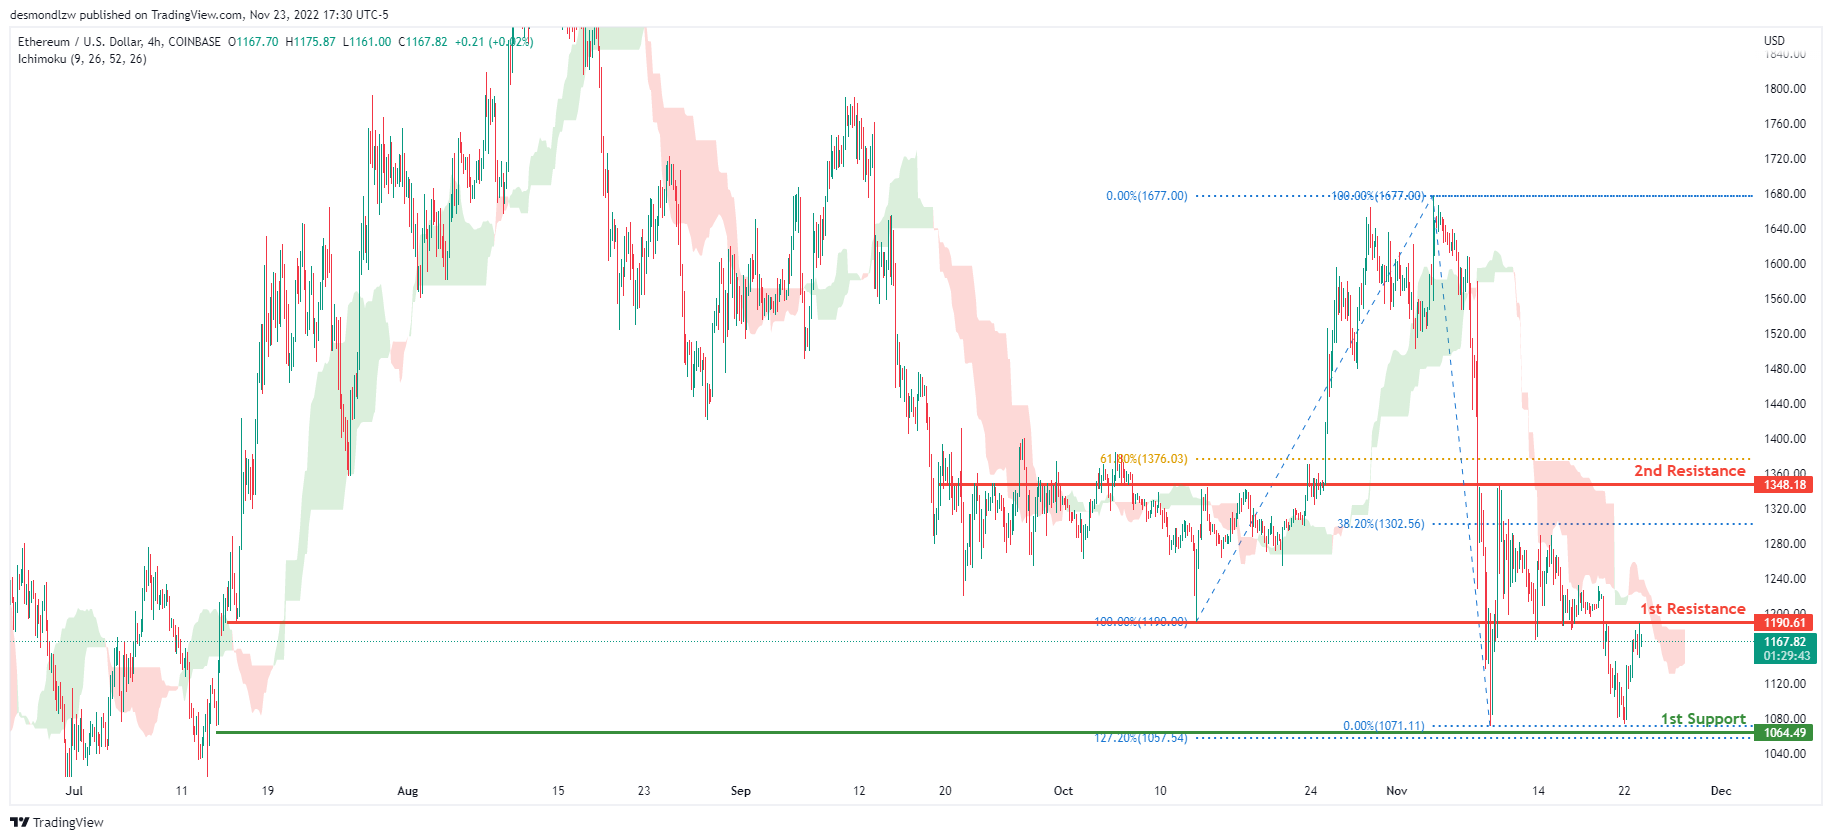
ETHUSD:
Looking at the H4 chart, my overall bias for ETHUSD is bearish due to the current price being below the Ichimoku cloud, indicating a bearish market .If this bearish momentum continues, expect price to possibly head towards the 1st support at 1064.49, where the -27.2% Fibonacci expansion line and 127.2% Fibonacci extension line are located. In an alternate scenario, price could possibly head back up towards the 1st resistance level at 1190.61, where the previous swing low is located.
Areas of consideration:
- H4 time frame, 1st resistance of 1190.61
- H4 time frame, 1st support at 1064.49
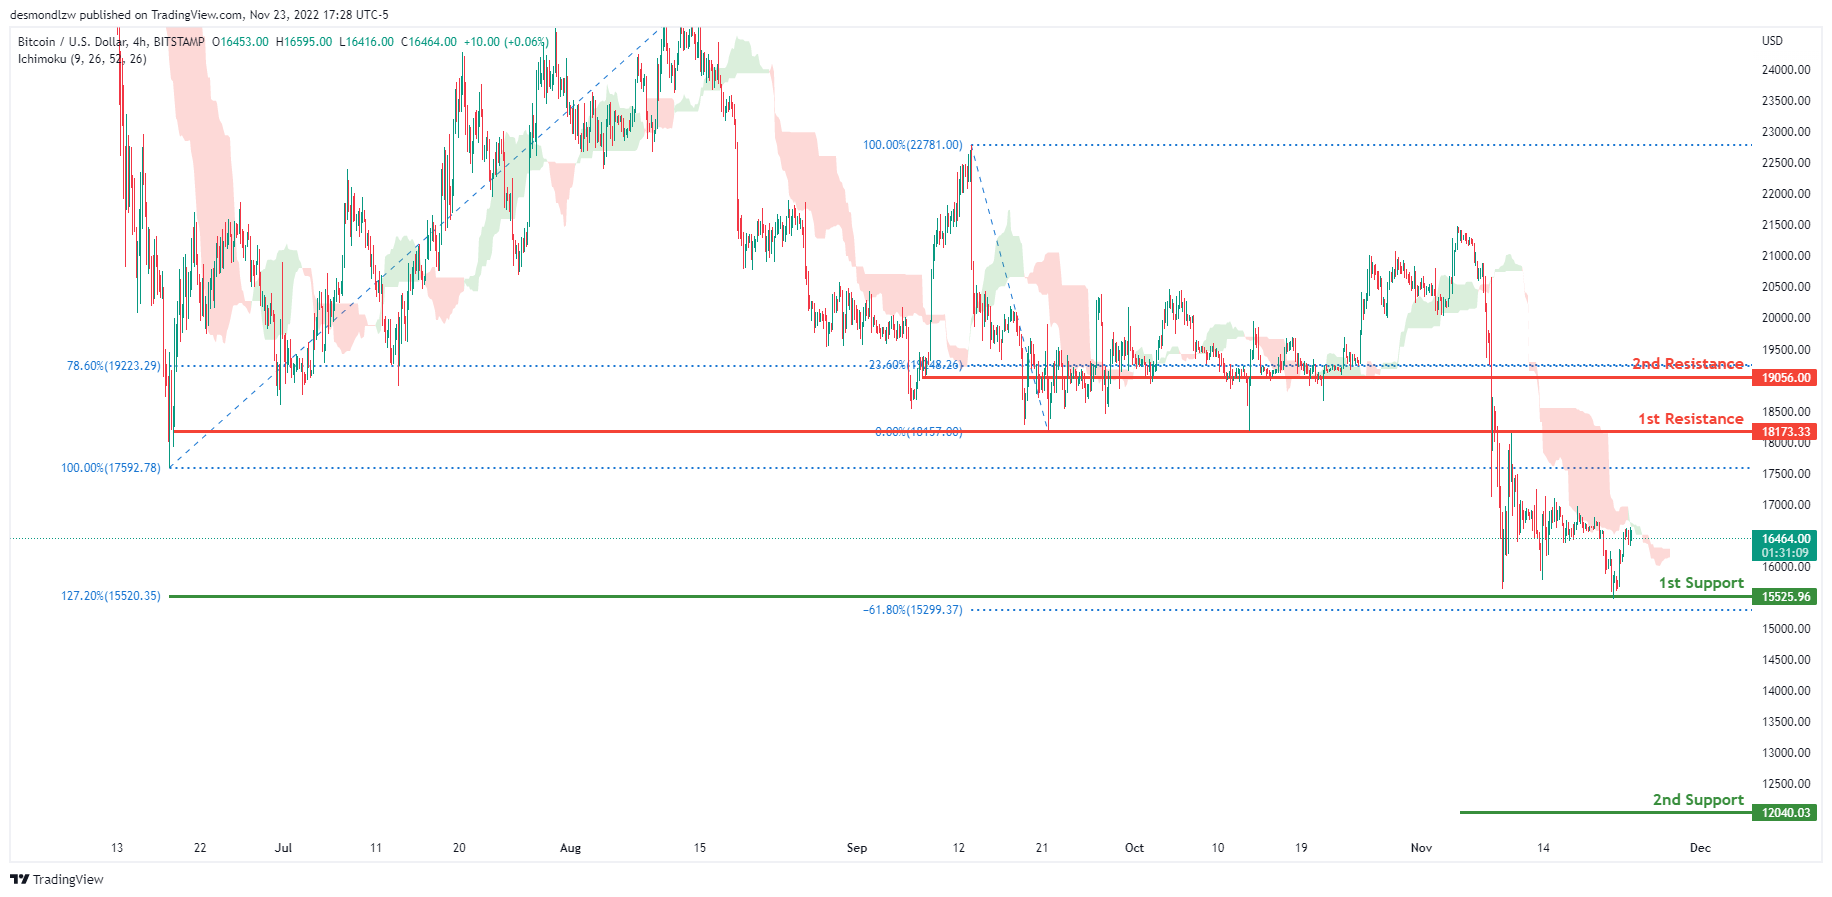
BTCUSD:
On the H4 chart, the overall bias for BTCUSD is bearish. To add confluence to this, the price is below the Ichimoku cloud which indicates a bearish market. If this bearish momentum continues, expect the price to head towards the 1st support line at 15525.96, where the 127.2% Fibonacci extension line and -61.8% Fibonacci expansion line is located. If price breaks the 1st support line, price could possibly head towards the 2nd support line at 12040.03 where the -61.8% Fibonacci expansion line is located. In an alternative scenario, price could head back up to retest the 1st resistance line at 18173.33, where the previous low and 0% Fibonacci line is located.
Areas of consideration:
- H4 time frame, 1st resistance 18173.33
- H4 time frame, 1st support at 15525.96
- H4 time frame, 2nd support at 12040.03
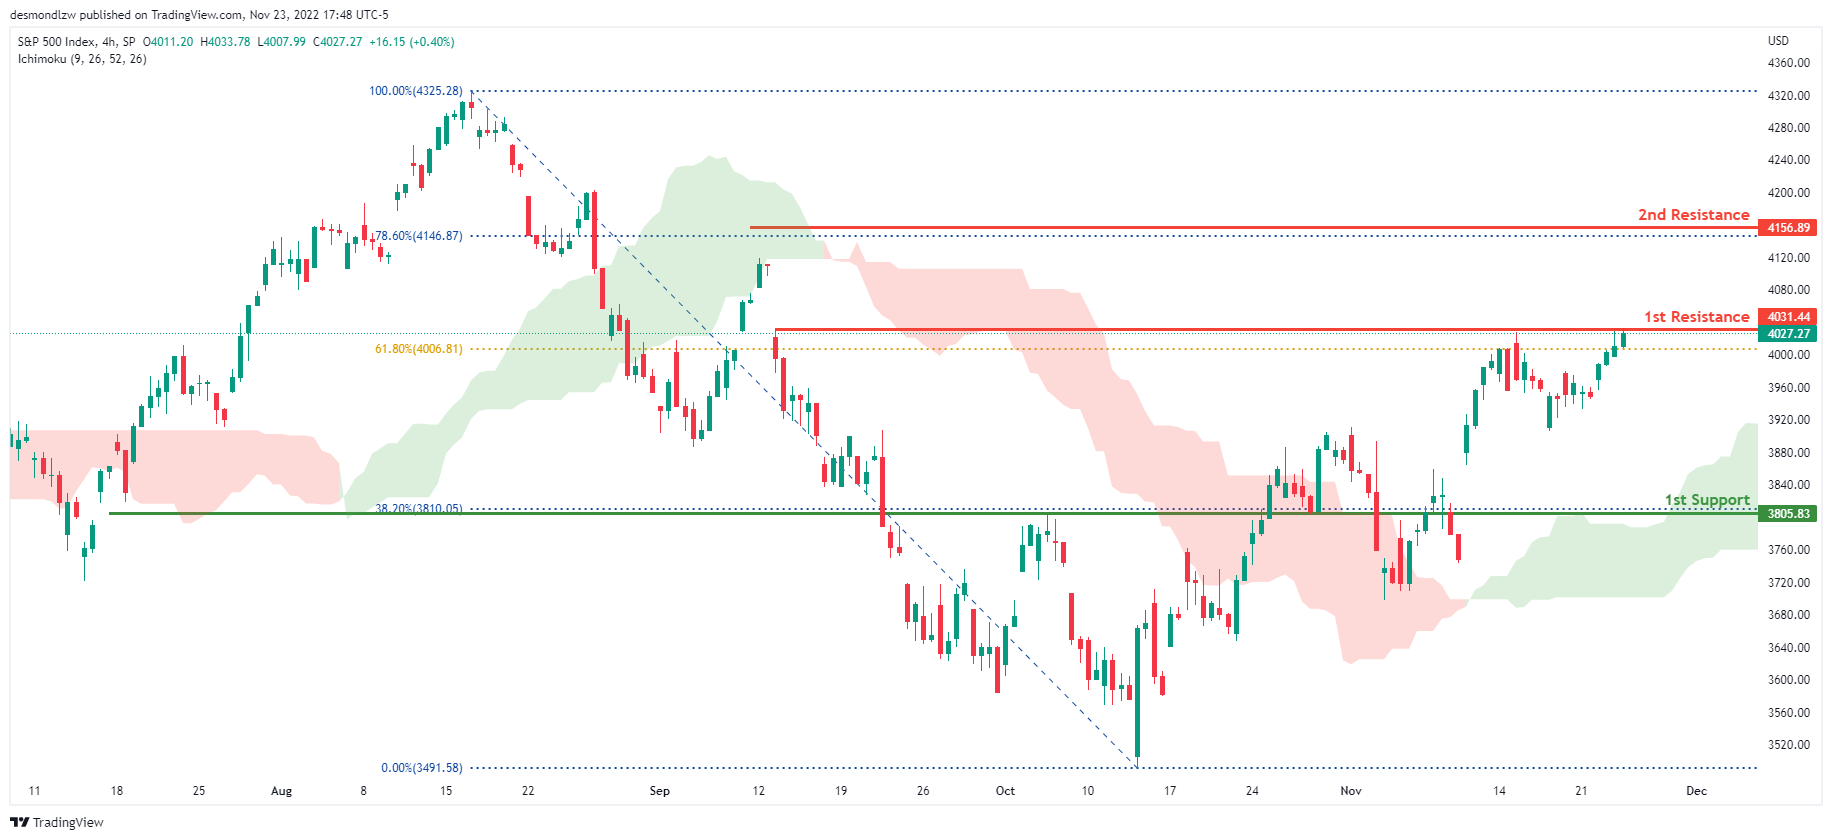
S&P 500:
The overall bias for the S&500 on the H4 chart is bullish, with prices above the Ichimoku cloud. If the bullish momentum continues, the price will rise to the first resistance line at 4011.74, where the 61.8% Fibonacci line is located. If the first resistance line is broken, the second resistance line is at 4119.28, which is the previous swing high and the 78.6% Fibonacci line. In an alternate scenario, price could return to the first support line at 3805.83, where the 38.2% Fibonacci line is located.
Areas of consideration:
- H4 time frame, 1st support at 3805.83
- H4 time frame, 1st resistance at 4011.74
- H4 time frame, 2nd resistance at 4119.28
The accuracy, completeness and timeliness of the information contained on this site cannot be guaranteed. IC Markets does not warranty, guarantee or make any representations, or assume any liability regarding financial results based on the use of the information in the site.
News, views, opinions, recommendations and other information obtained from sources outside of www.icmarkets.com.au, used in this site are believed to be reliable, but we cannot guarantee their accuracy or completeness. All such information is subject to change at any time without notice. IC Markets assumes no responsibility for the content of any linked site.
The fact that such links may exist does not indicate approval or endorsement of any material contained on any linked site. IC Markets is not liable for any harm caused by the transmission, through accessing the services or information on this site, of a computer virus, or other computer code or programming device that might be used to access, delete, damage, disable, disrupt or otherwise impede in any manner, the operation of the site or of any user’s software, hardware, data or property.