
EUR/USD:
Outlook unchanged.
EUR/USD action concluded Wednesday marginally in negative territory, down 0.08%. The greenback was unaffected by the FOMC Minutes, delivering little in the way of surprises. Policymakers noted a patient approach for rate policy would likely be appropriate for some time even if global conditions keep improving.
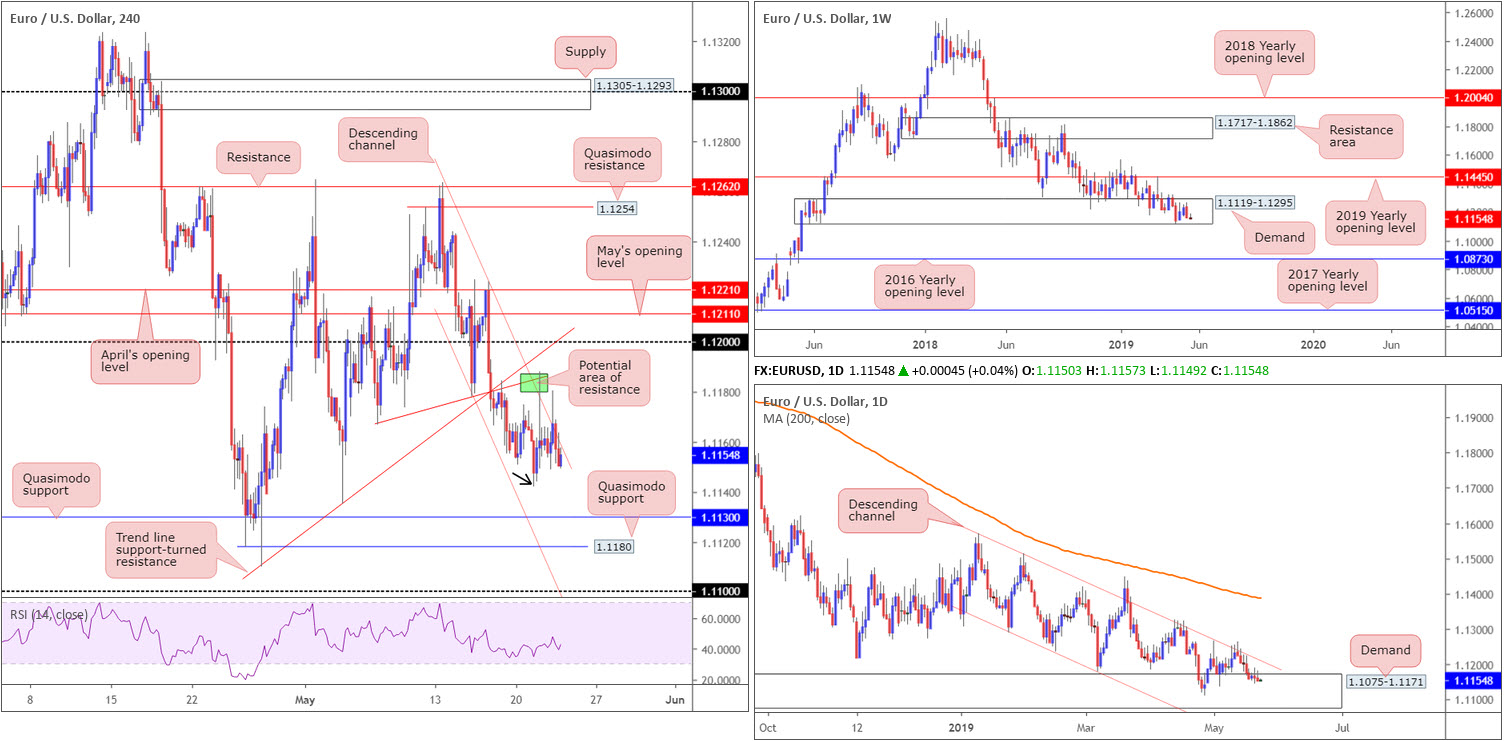
Technically speaking, price action remains unchanged. For folks who read previous reports you may recall the research team highlighted a merging channel resistance (taken from the high 1.1263) and local trend line support-turned resistance (1.1166) on the H4 timeframe as a potential area for selling opportunities (green). Shorts from this area are expected to target Tuesday’s low at 1.1142 (black arrow), followed by a Quasimodo support drawn from 1.1130.
On more of a broader perspective, buyers and sellers remain trading within the lower limits of a long-standing demand zone at 1.1119-1.1295 on the weekly timeframe. In the event a break of the aforesaid demand is observed, traders’ crosshairs will likely be fixed on the 2016 yearly opening level at 1.0873. This, according to our technical studies, is a strong possibility, given the long-term trend facing a southerly bearing since topping in early 2018.
The central focus on the daily timeframe is demand parked at 1.1075-1.1171, thanks to a rejection off long-term channel resistance taken from the high 1.1569 early last week. Although the demand is glued to the underside of the current weekly demand area, traders are encouraged to pencil in the next downside target on the daily scale in the event we push lower: a particularly interesting area of demand coming in at 1.0860-1.0954 (not visible on the screen), which happens to envelope the 2016 yearly opening level mentioned above on the weekly timeframe at 1.0873.
Areas of consideration:
Longer term, although the overall trend is facing south, this market offers a difficult short owing to demand seen on the weekly and daily timeframes.
Shorter-term traders may already be short this market from 1.1184ish: the combination of a H4 channel resistance (taken from the high 1.1263) and the local trend line support-turned resistance (1.1166). Reducing risk to breakeven at this point is still an option, with the first take-profit target set around 1.1142.
Traders who missed the initial call to sell were given a second opportunity to participate yesterday following a retest of the said H4 channel resistance, though entry was greatest on the H1 timeframe by way of a shooting star formation printed in the early hours of US trading.
Today’s data points: French Flash Services PMI; French Flash Manufacturing PMI; German Flash Manufacturing PMI; German Flash Services PMI; EUR Flash Manufacturing PMI; EUR Flash Services PMI; German Ifo Business Climate; ECB Monetary Policy Meeting Accounts.
GBP/USD:
Sterling remained on the defensive Wednesday, dropping 0.36% vs. the dollar. UK CPI rose 2.1% from a year earlier, slightly below the 2.2% forecast by economists. This, alongside UK Prime Minister May facing calls from within the Conservative Party to resign after the PM unveiled her new Brexit bill, collectively weighed on the pound.
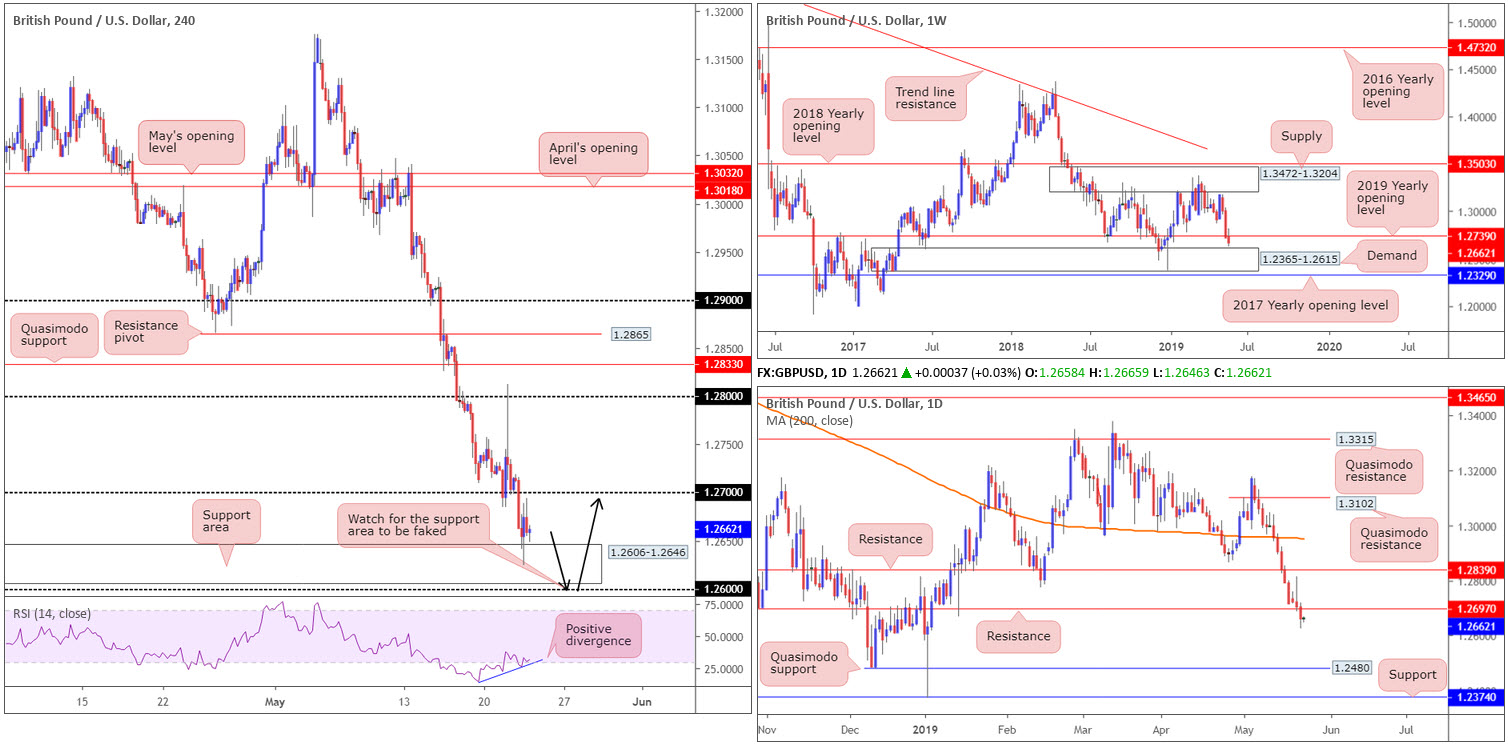
In early Europe, the technical picture reveals 1.27 gave way in strong fashion and exposed fresh ground towards a H4 support area plotted at 1.2606-1.2646. Holding into the close, this zone (highlighted in Wednesday’s briefing) is likely of interest to many traders: some see this as a base to begin liquidating shorts, while others may even view this area as a region for fresh longs. The attraction, according to our technical reading, is due to its association with the top edge of weekly demand at 1.2365-1.2615. Further adding to this, the H4 RSI is also chalking up positive divergence out of oversold territory.
The only drawback to a long in this market, aside from the immediate trend facing a southerly bearing at the moment, is daily price recently engulfing support at 1.2697 (now acting resistance). As you can see from the chart, limited support is visible on this scale until shaking hands with a Quasimodo formation at 1.2480.
Areas of consideration:
Although some traders are possibly long from the current H4 demand zone, the research team notes a fakeout below this area to the nearby 1.26 handle is also a possibility.
Therefore, conservative traders may wish to adopt a patient approach and see if the candles are drawn to 1.26 before pulling the trigger. An ideal scenario would be for H4 price to print a hammer formation off 1.26, thus confirming buyer intent and simultaneously providing traders a structure to base entry and risk levels from.
Today’s data points: Limited.
AUD/USD:
Outlook unchanged.
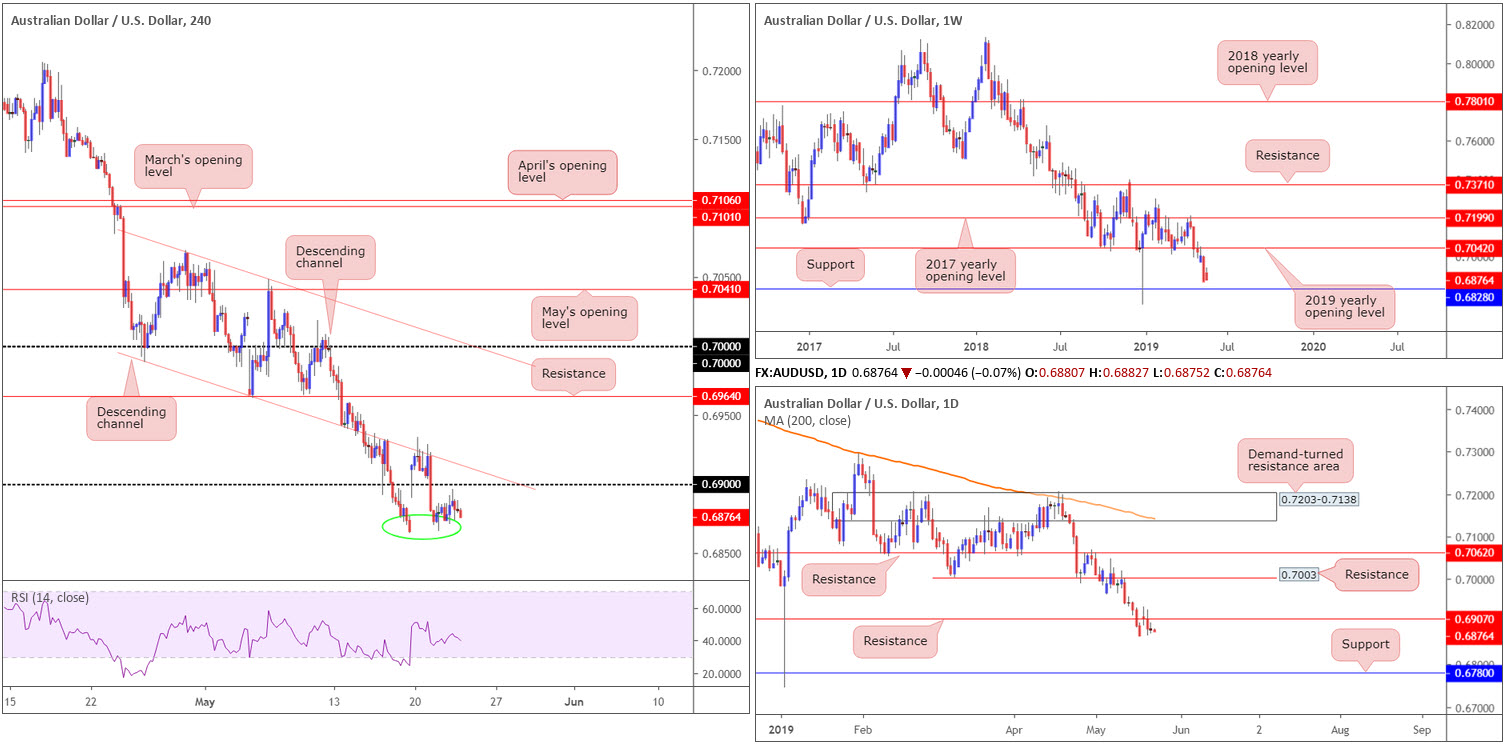
Unchanged at -0.03%, Wednesday’s segment struggled to pin a direction as H4 candles consolidate recent losses sub 0.69 after filling the weekend gap.
Below 0.69, the research team notes limited support, aside from the local base (green circle) around 0.6866ish, until connecting with 0.68. This downside projection is further highlighted on the higher timeframes. Weekly price exhibits scope to press as far south as support coming in at 0.6828, and daily action, after crossing back beneath support (now acting resistance) at 0.6907, has support at 0.6780 to target.
Areas of consideration:
On account of the overall technical picture, the pendulum still appears to be swinging in favour of sellers at the moment. Should the market observe a retest to the underside of 0.69 that holds ground, preferably in the shape of a H4 bearish candlestick formation (this helps traders locate structured entry and risk levels), a sell is certainly worthy of consideration, steering towards 0.6860 as an initial take-profit zone, followed by 0.6828: the weekly support level.
Today’s data points: Limited.
USD/JPY:
In recent sessions, the market observed the USD/JPY put in a mild top as risk sentiment turned somewhat sour. Across the board, major US equity indexes recorded losses, as well as the US Treasury 10-year note losing more than 1.80% on the day.
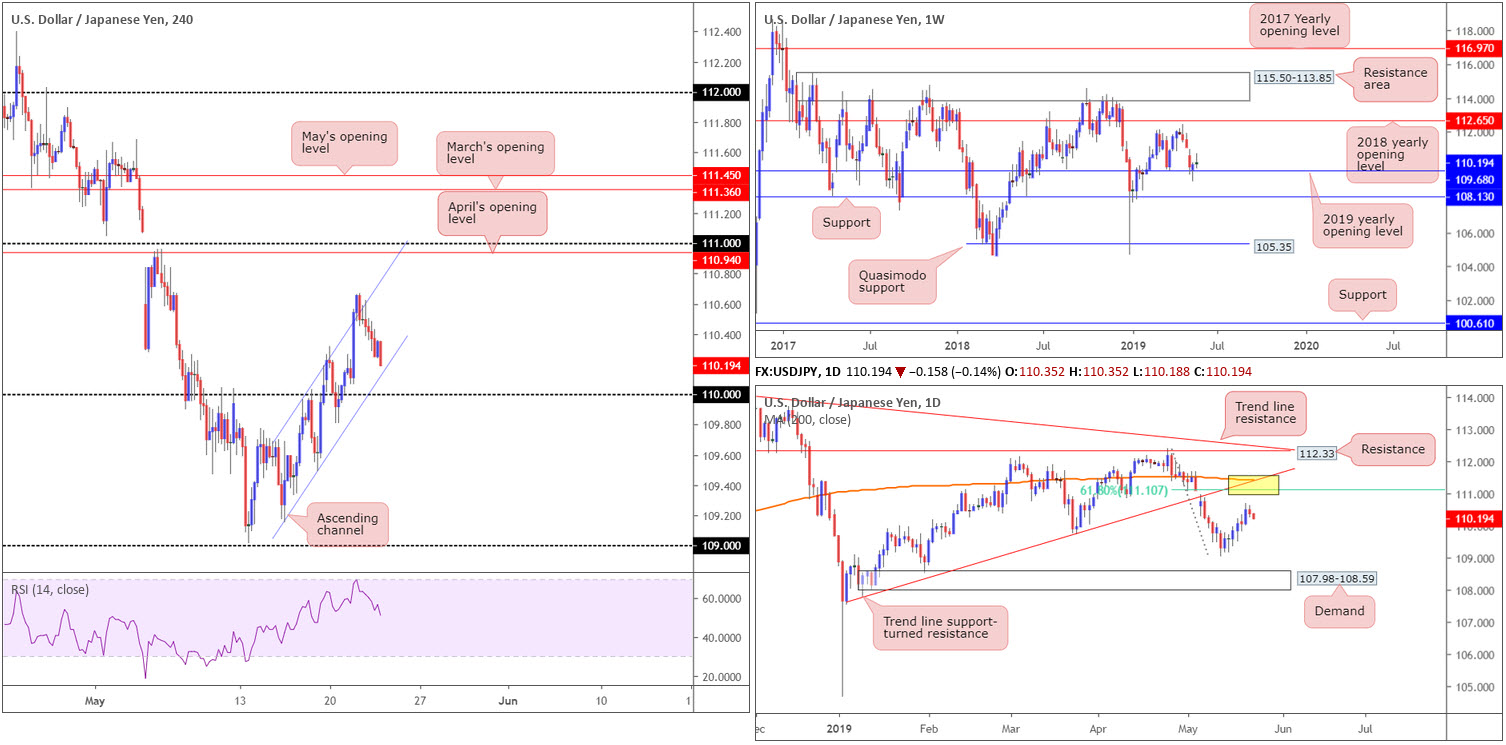
In view of the technical landscape, the H4 picture reveals price action remains within an ascending channel formation (109.15/109.96). As of late, the unit is approaching the lower limit of the said channel, though traders should remain cognizant of a potential fakeout brewing towards the nearby 110 handle.
Weekly movement continues to feed off support drawn from the 2019 yearly opening level at 109.68 in the mould of a reasonably attractive hammer pattern. Therefore, until this line is breached, longer-term flow remains to the upside. Further buying is also still a possibility on the daily timeframe, according to our technical studies, as price appears poised to approach a 61.8% Fibonacci resistance at 111.10. What gives this Fib level extra credibility is a merging trend line support-turned resistance etched from the low 107.77 and the 200-day SMA (yellow).
Areas of consideration:
In order to become buyers within this market, the research team feels 110 offers a prime location. An ideal setup is a reaction off 110 in the shape of a H4 bullish candlestick configuration. As often touted, this serves to identify intent and also provides traders entry and risk levels to trade.
While interim upside targets are in view, the ultimate destination is seen around 111.10ish, followed by 112.65.
Today’s data points: Limited.
USD/CAD:
Upbeat Canadian retail sales data provided fresh impetus to the Canadian dollar Wednesday, hauling the USD/CAD sub 1.34 to a session low of 1.3357. Despite this, the pair witnessed a sharp U-turn and reclaimed 1.34 to the upside as the commodity-linked Canadian dollar failed to preserve its upward momentum amid a waning oil market (down more than 2.50%).
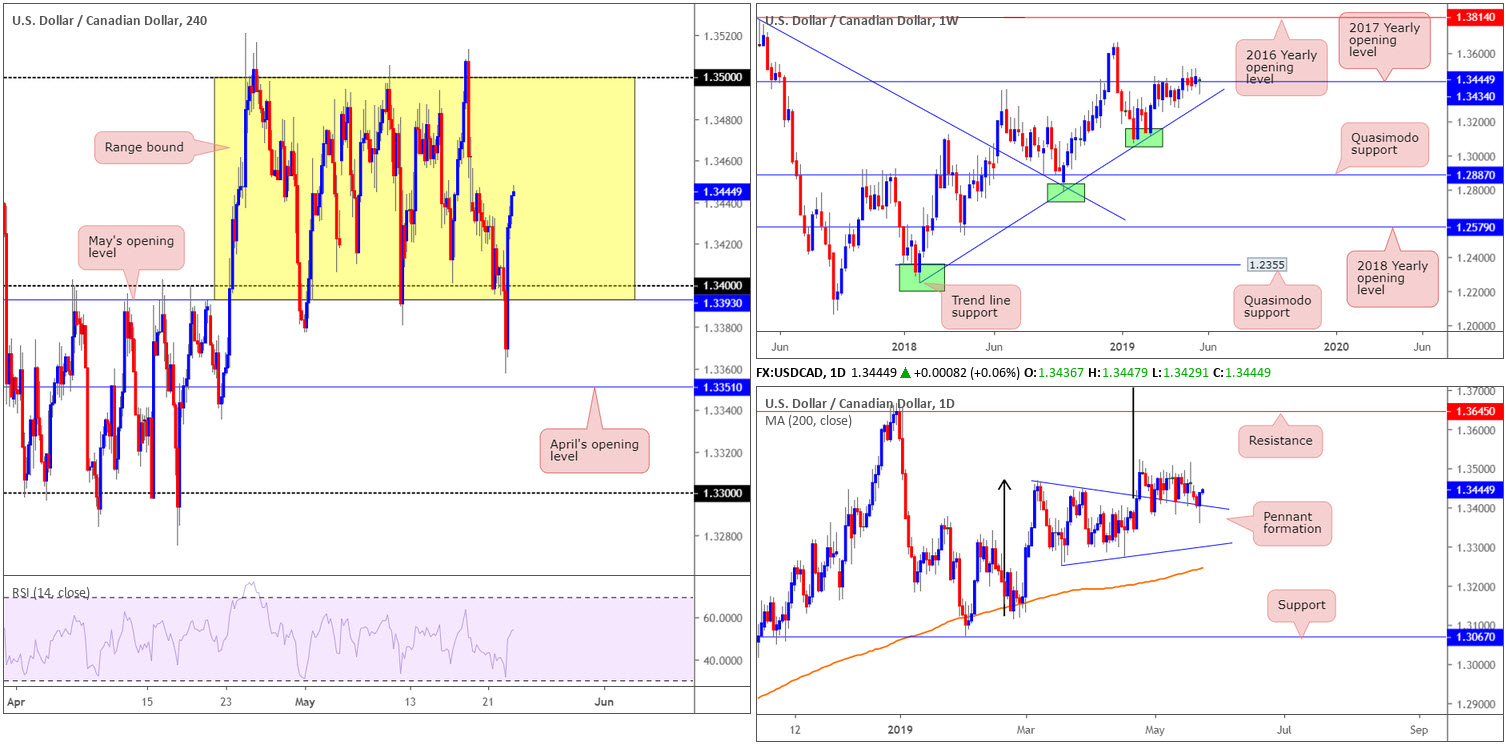
Overall, the H4 candles, since the latter part of April, have been busy carving out a 100-point+ range between May’s opening level at 1.3393/1.34 and the round number 1.35.
On a wider context, longer-term flows broke out above the 2017 yearly opening level at 1.3434 on the weekly timeframe, though has so far failed to breed much follow-through momentum. Areas outside of this level to be aware of fall in around the 2018 yearly high of 1.3664, and a trend line support etched from the low 1.2247.
A closer reading of price action shows the daily candles continue to feed off support drawn from the top edge of a pennant pattern (1.3467). Although the traditional price target (calculated by taking the distance from the beginning of the preceding move and adding it to the breakout price) remains on the chart at 1.3768 (black arrows), the next upside target from a structural standpoint falls in around resistance at 1.3645.
Areas of consideration:
In the event we continue to push higher the market may challenge 1.35 and possibly observe a H4 close form above the figure. Should a close higher occur, traders have the choice of either buying the breakout candle and placing stop-loss orders beneath its tail, or waiting and seeing if a retest scenario takes shape and entering on the back of the rejection candle’s structure. The next upside target on the H4 scale can be seen around 1.3570 (not seen on the screen), though according to the higher timeframes we could be heading much higher. A rejection off 1.35 may also be of interest to some traders, but remain aware the higher-timeframe picture is pointing to further buying.
1.34/May’s opening level at 1.3393 is also an area of interest on the H4 timeframe for possible longs, despite yesterday’s monstrous fakeout. Not only does the base represent the lower edge of the current H4 range, it is also reinforced by the top edge of the daily pennant formation highlighted above. For conservative traders, waiting for a H4 bullish candlestick to print from this region will help identify buyer intent and also serve as a structure to base entry and risk levels from.
Today’s data points: Limited.
USD/CHF:
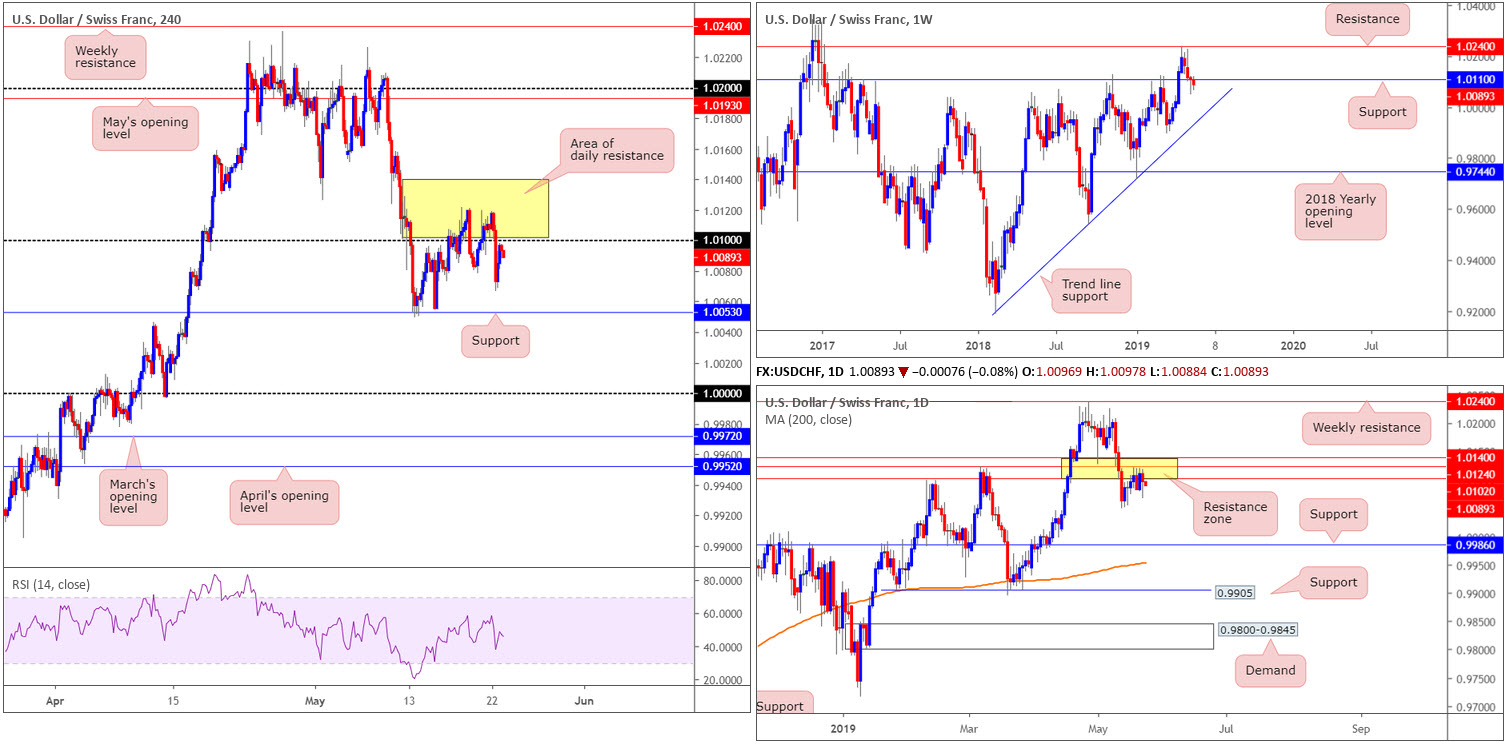
Failing to sustain gains above 1.01 on the H4 timeframe, drove the unit to a session lows of 1.0066 Wednesday. Seeing the H4 candles reclaim 1.01 should not come as a surprise, considering buyers failed to prove themselves above this figure, along with a robust daily resistance zone between 1.0102/1.0140 visible overhead.
Further selling from current price has H4 support at 1.0053 in sight, eventually followed by 1.0000 (parity). Further rejection off the said daily resistance zone, nonetheless, has the 1.0050 May 13 low in sight, followed then by a possible run towards support fashioned at 0.9986.
It might also be worth sharing a note on the weekly timeframe. The buck’s retreat from the 2019 high 1.0236 set towards the end of May continued last week, though downside momentum decreased considerably and formed a nice-looking hammer formation off support at 1.0110. As of current price, buyers appear fragile, with a failure of the aforementioned weekly support positioning trend line support (etched from the low 0.9187) in the firing range.
Areas of consideration:
As we’ve formulated a H4 close beneath 1.01, a retest to the underside of this number is likely of interest to some traders, targeting H4 support at 1.0053 as the initial port of call. Ultimately, it is down to the individual trader to decide whether a short here is worthy of the risk. Conservative traders may opt for additional confirmation to take shape, be it a candlestick signal, an MA crossover or even lower-timeframe confirming structure: support-turned resistance retest. This not only helps identify seller intent, it also helps deliver traders entry and risk levels to work with.
Today’s data points: Limited.
Dow Jones Industrial Average:
US equities finished lower Wednesday as lingering trade woes overshadowed the release of the minutes from the Federal Reserve’s policy meeting that delivered little in the way of surprises.
The Dow Jones Industrial Average declined 0.39%; the S&P 500 0.28% and the tech-heavy Nasdaq settled at -0.41%.
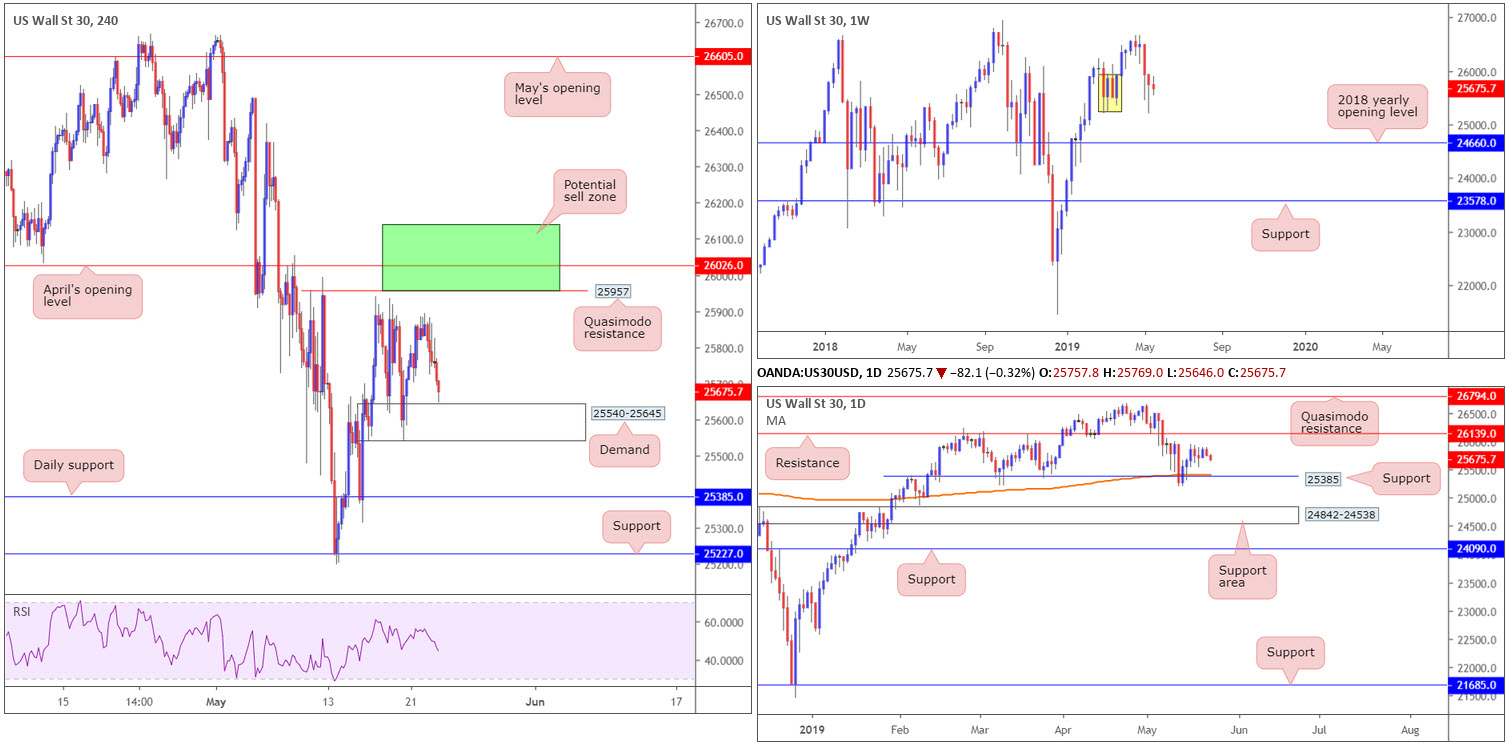
On the technical front, the DJIA H4 chart shows price action headed for a retest of demand seen at 25540-25645. Beyond here, the research team has daily support at 25385 sited on the chart. To the upside, Quasimodo resistance at 25957 is visible, trailed closely by April’s opening level at 26026.
Weekly flow shows demand marked in yellow at 25217-25927, although unlikely to be considered a strong area on this timeframe owing to limited momentum produced from the base, remains in the fold. In the event this entices buyers into the market, we could be looking at a run towards the 26668 April 22 high.
Last week observed the index shake hands with notable support at 25385 on the daily timeframe, which happened to intersect with the 200-day SMA. Technically, this provided a platform for buyers to enter the market, with the next upside point of interest falling in at resistance fixed from 26139.
Areas of consideration:
The current H4 demand is a chancy long, according to our reading, as the temptation to drive through this area in the direction of daily support mentioned above at 25385 (and nearby 200-day SMA) may be too much for the market. Should 25385 be tested, a long position is certainly a consideration.
Another area the research team are particularly fond of is the green zone plotted on the H4 timeframe between 26139 (the daily resistance level) and 25957 (the collection of H4 resistances). An ideal scenario would be for the H4 candles to chalk up a notable bearish candlestick configuration. Entry can be applied according to the candlestick’s rules, though stop-loss placement may be either above the daily resistance at 26139 (conservative) or above the upper shadow of the candlestick signal (aggressive).
Today’s data points: Limited.
XAU/USD (GOLD):
Outlook unchanged.
Spot gold, in $ terms, remained muted Wednesday despite the US dollar index formulating ground above its 98.00 mark, down 0.09%.
According to our technical research, much of Wednesday’s outlook still remains valid.
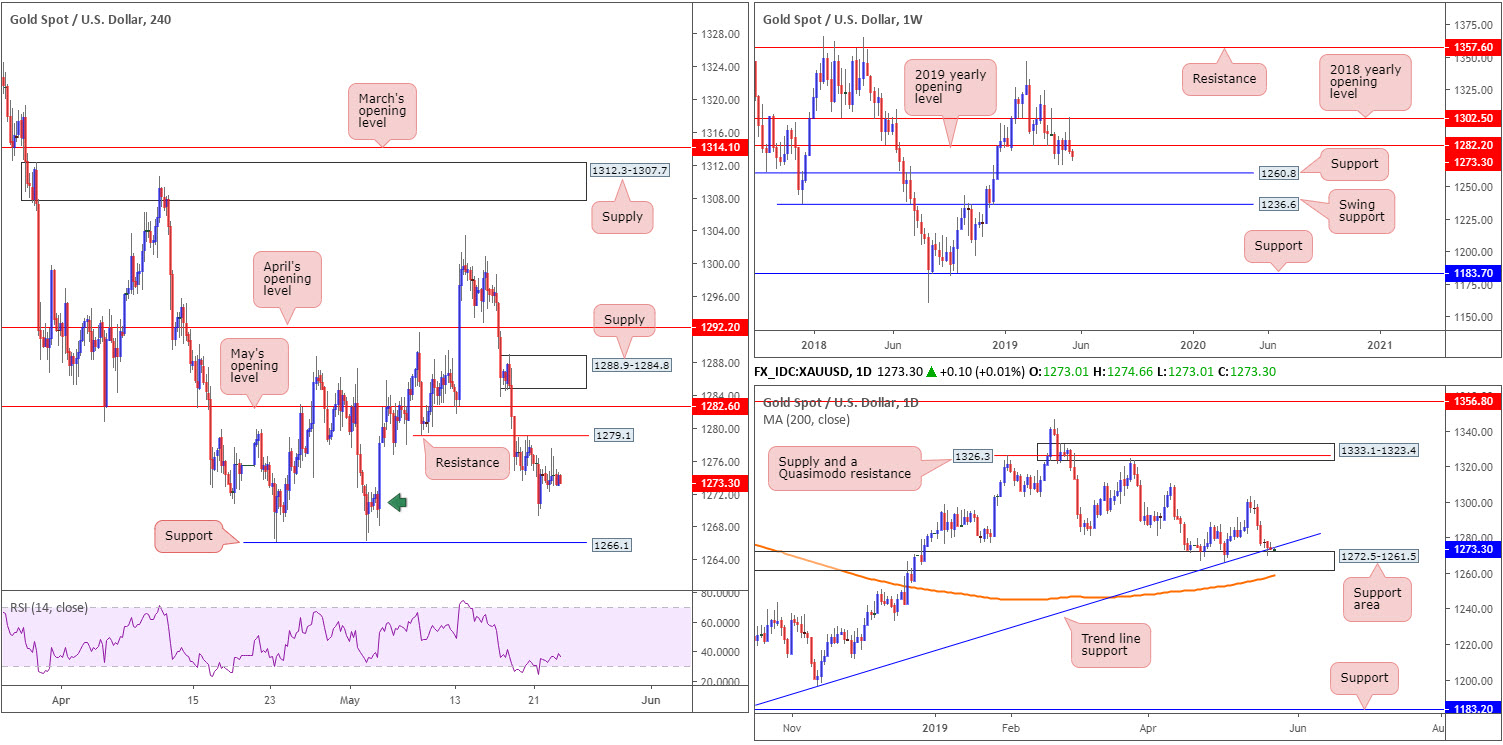
Weekly flow is exploring ground beneath its 2019 yearly opening level at 1282.2, and appears starved of support until connecting with 1260.8. Contrary to weekly direction, though, daily movement is shaking hands with a support area seen at 1272.5-1261.5. The zone boasts a reasonably solid history and merges with a trend line support taken from the low 1160.3. What’s also notable from a technical perspective is the unit remains above its 200-day SMA.
Closer analysis of the H4 timeframe has the candles rebounding from demand (green arrow) at 1268.1-1272.3. Beyond here, clear-cut support (double bottom) at 1266.1 is visible. Note the current H4 demand area also resides around the top edge of the daily support area at 1272.5-1261.5.
Areas of consideration:
As highlighted in previous reports, H4 demand marked with a green arrow at 1268.1-1272.3 was a point of interest for longs, owing to its connection to the top base of the current daily support area. Well done to any of our readers who managed to jump aboard the aforementioned H4 demand. The next upside target from this point falls in at resistance carved from 1279.1, followed by May’s opening level at 1282.6 – by that point you’ll also be trading around the underside of the 2019 yearly opening level mentioned above on the weekly timeframe at 1282.2.
Aside from a potential move higher, the research team sees little else to hang their hat on in terms of tradable opportunities at present.
The accuracy, completeness and timeliness of the information contained on this site cannot be guaranteed. IC Markets does not warranty, guarantee or make any representations, or assume any liability with regard to financial results based on the use of the information in the site.
News, views, opinions, recommendations and other information obtained from sources outside of www.icmarkets.com.au, used in this site are believed to be reliable, but we cannot guarantee their accuracy or completeness. All such information is subject to change at any time without notice. IC Markets assumes no responsibility for the content of any linked site. The fact that such links may exist does not indicate approval or endorsement of any material contained on any linked site.
IC Markets is not liable for any harm caused by the transmission, through accessing the services or information on this site, of a computer virus, or other computer code or programming device that might be used to access, delete, damage, disable, disrupt or otherwise impede in any manner, the operation of the site or of any user’s software, hardware, data or property.


