
Key risk events today:
French Flash Services PMI; French Flash Manufacturing PMI; German Flash Manufacturing PMI; German Flash Services PMI; EUR Flash Manufacturing PMI; EUR Flash Services PMI; ECB Monetary Policy Meeting Accounts; US Flash Manufacturing PMI; Jackson Hole Symposium.
EUR/USD:
Minutes for the July FOMC stated Federal Reserve officials viewed their interest-rate cut last month as insurance against too-low inflation and the risk of a deeper slump in business investment stemming from uncertainty over President Donald Trump’s trade war.
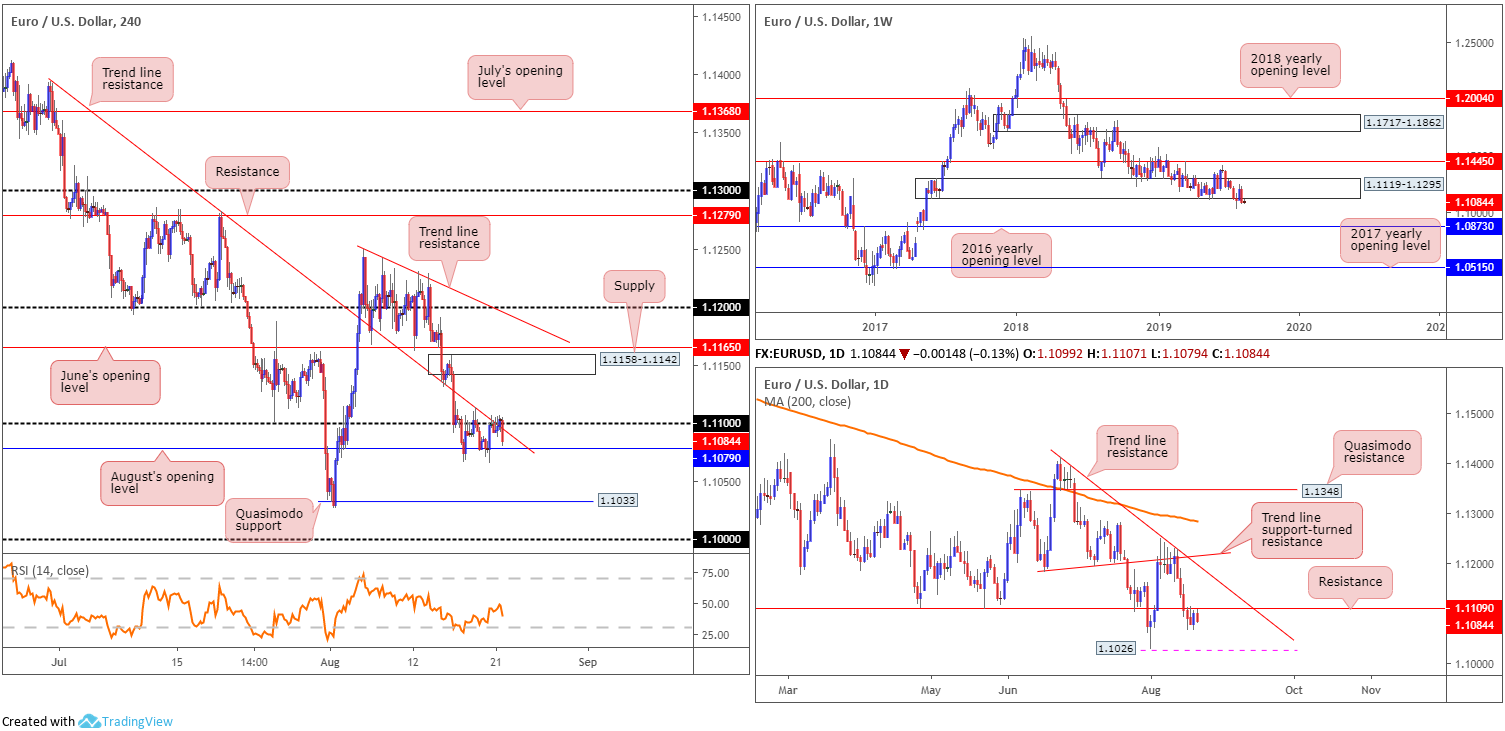
The US dollar index concluded Wednesday a shade higher, paring a portion of Tuesday’s losses. The EUR/USD remains rooted within a skin-tight consolidation between August’s opening level at 1.1079 and the 1.11 boundary that fuses with a trend line resistance taken from the high 1.1393. As underlined in yesterday’s morning brief, areas of interest outside of the current range can be found at a fresh supply zone drawn from 1.1158-1.1142, closely trailed by June’s opening level at 1.1165. To the downside, nonetheless, traders’ crosshairs are likely fixed on Quasimodo support coming in at 1.1033, closely followed by the key figure 1.10.
Longer term, however, daily flow continues to languish south of 1.1109, a support-turned resistance level. A notable rejection formed from this neighbourhood may govern enough attention to draw in 1.1026 (the 2019 low), followed by demand (not visible on the screen) at 1.0851-1.0950.
Long-standing weekly demand at 1.1119-1.1295 had the lower edge of its base engulfed last week. Continued selling may witness the unit knock on the 2016 yearly opening level’s door at 1.0873, which houses strong historical significance. In addition to this, traders may want to acknowledge the long-term trend remains facing a southerly bearing since topping in early 2018.
Areas of consideration:
Considering this week’s lacklustre performance, the research team’s outlook remains unchanged.
If daily resistance at 1.1109 remains in the fold and weekly flow continues to tread water beneath its demand at 1.1119-1.1295, sellers have the upper hand as far as technical structure is concerned and could prompt an extended selloff from 1.11 on the H4 timeframe. As highlighted above, 1.11 not only garners additional weight from the higher timeframes, it also converges with H4 trend line resistance.
On account of the above notes, conservative sellers likely have eyes on a H4 close sub August’s opening level at 1.1079. A decisive H4 close below here that’s followed up with a retest is likely sufficient to encourage further selling (entry and risk can be calculated based on the rejection candle’s structure). Downside targets can be seen at the H4 Quasimodo support at 1.1033, the 2019 low at 1.1026 and then the key figure 1.10.
GBP/USD:
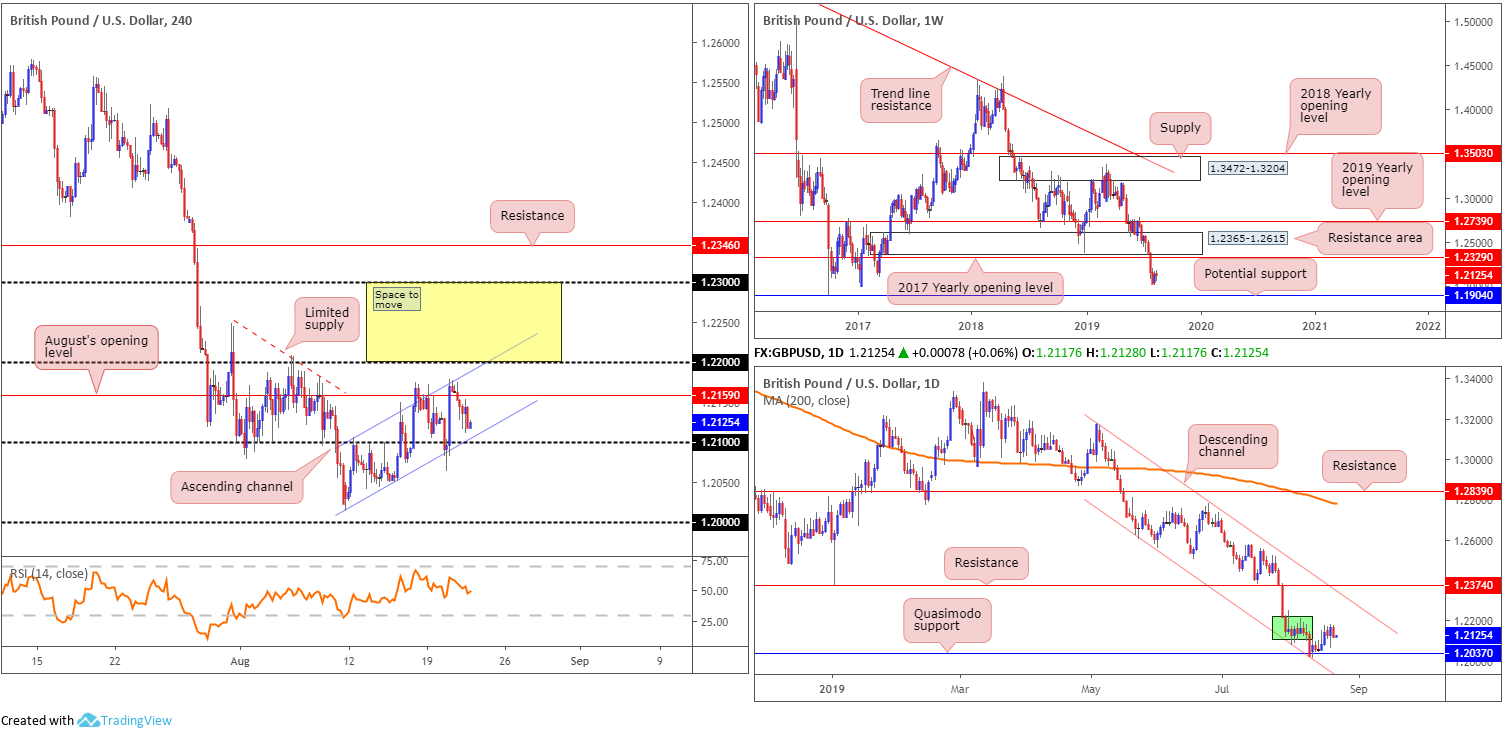
UK’s pound proved reasonably stable in response to Wednesday’s Federal Open Market Committee’s minutes. Despite this, the unit wrapped up the session marginally lower vs. the buck (-0.38%), and remains compressing within a medium-term ascending channel on the H4 timeframe (1.2014/1.2106). Chart studies on this scale, therefore, suggest scope for additional buying, particularly if we overthrow August’s opening level at 1.2159 and 1.22 as limited supply is visible until 1.23. To the downside, though, traders have 1.21 stationed close by as possible support, which happens to unite closely with channel support.
On a broader perspective the research team notes little change, with the previous report’s findings still in motion.
Extracted from Monday’s weekly report:
GBP/USD bulls went on the offensive last week, adding more than 115 points and snapping a four-week losing streak. For a currency that has been so beleaguered in recent months, this is a notable event. Further upside could have the unit shake hands with the 2017 yearly opening level at 1.2329 (resistance), set a couple of points south of a major resistance area at 1.2365-1.2615. Renewed selling interest, however, may lead to support entering the fold from 1.1904: a standout low clocked in early October 2016.
Extracted from yesterday’s brief:
Although scope for additional upside is certainly plausible on the daily timeframe from Quasimodo support at 1.2037, with north of the page relatively free until reaching resistance at 1.2374 (aligns with channel resistance etched from the high 1.3176), traders must first contend with a local block of supply shaded in green around the 1.2150ish area.
Areas of consideration:
Having witnessed the H4 candles recoil in recent movement, medium-term flow may stage a recovery from 1.21, targeting August’s opening level at 1.2159 as the initial upside objective. Psychological figures often encourage a stop run, so traders are urged to wait for additional candlestick confirmation to form before pulling the trigger. This not only helps classify buyer intent, it also delivers entry/risk levels to work with (based on the candlestick structure).
A H4 close above 1.22 also brings with it an opportunity to enter long, targeting 1.23 as the initial take-profit zone, closely followed by the 2017 yearly opening level on the weekly timeframe at 1.2329 and then H4 resistance at 1.2346. Depending on risk appetite, traders have the option of entering long on the breakout candle (with a protective stop-loss order positioned beneath the lower shadow) or conservatively waiting for a possible retest motion to occur before committing funds, preferably in the form of a H4 bullish candlestick signal (entry and risk can then be set according to this assembly).
AUD/USD:
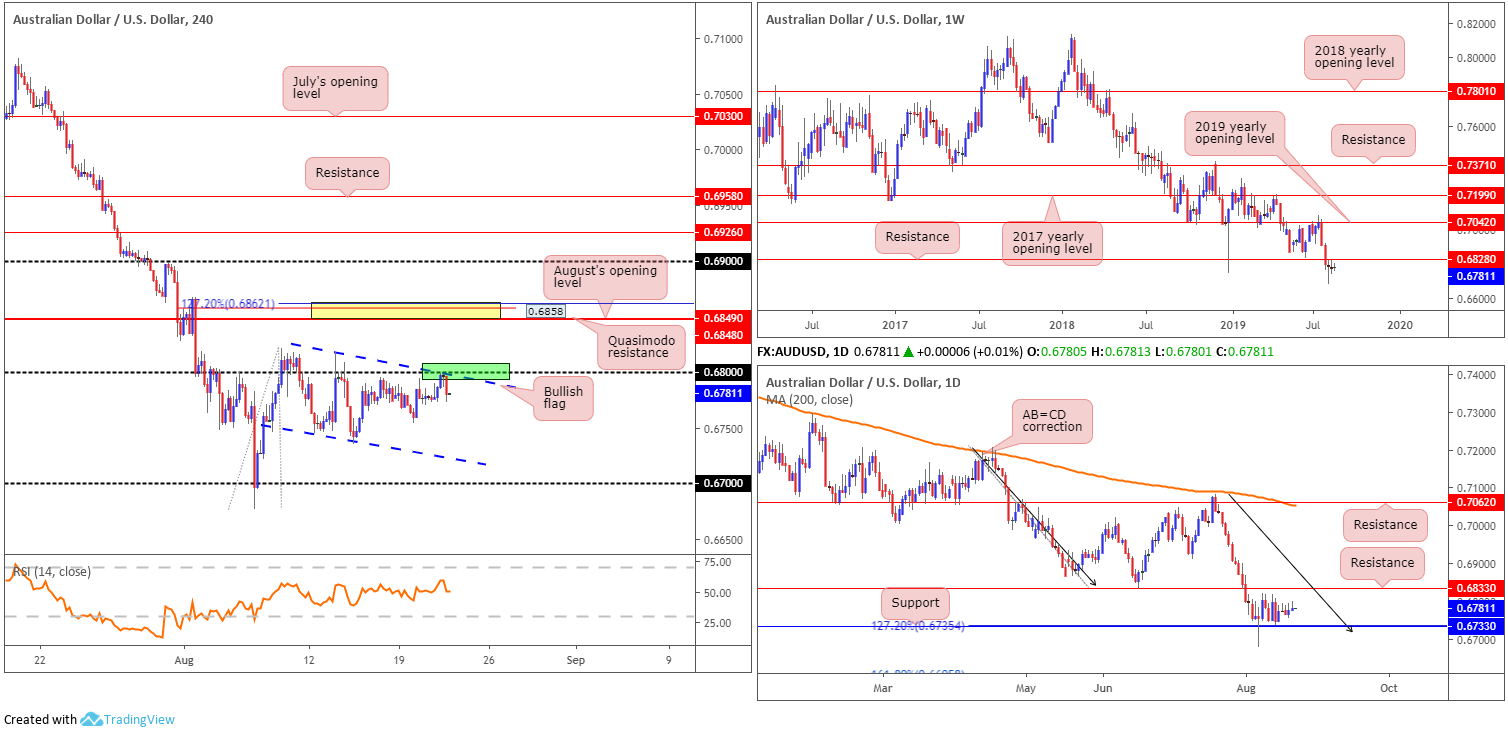
The Australian dollar eked out borderline gains against the greenback Wednesday, little changed following the Federal Open Market Committee’s minutes. Medium-term flows (H4) witnessed a run to highs of 0.6799, experiencing thin air just south of the 0.68 handle and upper flag limit taken from the high 0.6817.
Gains have been contained by 0.68 since August 9, while compressing within a bullish flag formation (0.6817/0.6745). Flags typically slope in the opposite direction from the trend, which is clearly not the case here but may still form part of a correction move if we break higher. Beyond 0.68, a tight area of resistance (yellow) resides between a 127.2% Fibonacci ext. point at 0.6862, a Quasimodo resistance at 0.6858 and August’s opening level at 0.6848.
The higher-timeframe position remains unchanged, according to our chart studies:
The weekly timeframe has its candles languishing beneath resistance at 0.6828, organised as two back-to-back indecision candles. The long-term downtrend, intact since the beginning of 2018, is unbroken, with further selling towards support at 0.6395 being a real possibility (not seen on the screen).
Meanwhile, on the daily timeframe, since elbowing beneath weekly support mentioned above at 0.6828, support at 0.6733, along with a 127.2% AB=CD (black arrows) formation at 0.6735, entered the fray and held things higher. Despite this, the pair remains deeply in bearish territory and may not have the firepower to cross swords with resistance at 0.6833 (June 18 low).
Areas of consideration:
Thanks to recent movement, areas of interest also remain in motion:
Although the target for the bullish flag configuration will come in higher, overlooking H4 resistance at 0.6862/0.6848 is chancy. Further to this, though, between 0.68 and the aforesaid H4 resistance zone, traders must contend with not only daily resistance at 0.6833, but also weekly resistance at 0.6828.
On account of the above, the research team feel longs above the current H4 flag formation/0.68 are challenging. Excessive resistance from all three timeframes analysed will likely hamper any upside attempt. With this taken on board, two sell zones remain in view:
- The point the upper limit of the H4 flag merges with 0.68 may prompt a selloff (green). With higher-timeframe structure positioned nearby, though, which could promote a fakeout above 0.68, waiting for additional candlestick confirmation to form before entering a trade is recommended (entry and risk parameters can be set according to the selected candlestick formation).
- The yellow H4 area of resistance between 0.6862/0.6848. Granted, while this zone is a touch above higher timeframe-resistance, a fakeout above these levels (likely flushing out greedy buy stops) to the said H4 zone is a strong possibility. Entry at 0.6848 is, therefore, valid, with a tight protective stop-loss order plotted above 0.6862, but if you prefer waiting for additional confirmation, a bearish candlestick pattern would suffice.
USD/JPY:
Up 0.37% on the day, the US dollar was a shade firmer on the Japanese yen Wednesday, though displayed limited response to July’s Federal Open Market Committee’s minutes.
Technically speaking, chart studies reveal structure remains unbroken across all three timeframes.
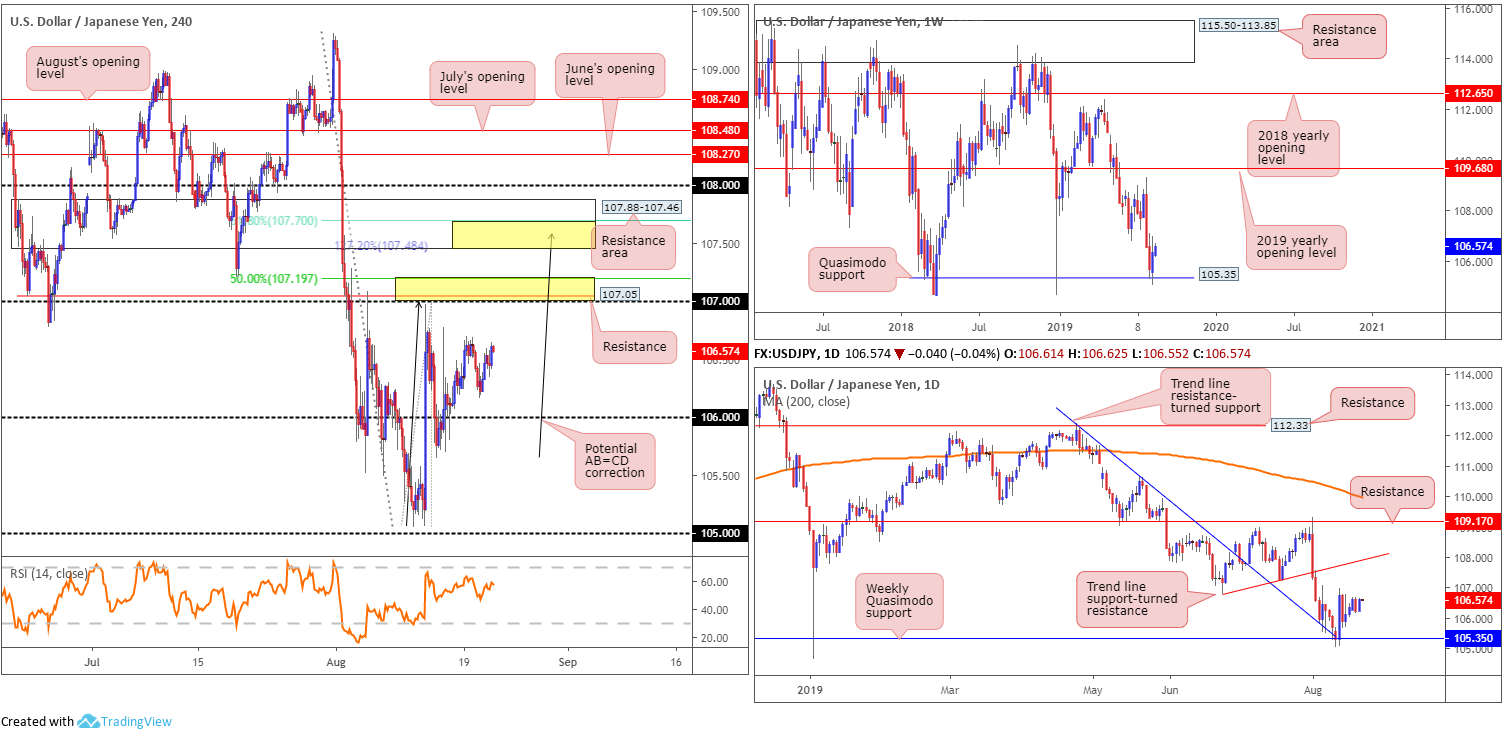
Weekly Quasimodo support at 105.35 – a level that already proved its worth by holding the unit higher at the beginning of the year – contained losses last week, encouraging a run higher that snapped a two-week losing streak. Outside of this base, limited support is evident until 100.61, whereas a push north has the 2019 yearly opening level at 109.68 to target.
In tandem with the weekly Quasimodo support, daily trend line resistance-turned support (extended from the high 112.40) also entered the mix last week. The convergence of these two higher-timeframe levels witnessed a strong recovery take shape on August 13. This foundation supports further buying on this scale, at least until we reach trend line support-turned resistance (etched from the low 106.78).
H4 action has the 106 handle in view as its next support, whereas to the upside resistance resides at 107.19/107, comprised of a 50.0% retracement value at 107.19, a resistance level at 107.05 and the round number 107 (lower yellow zone). Above here, we also have another area of resistance formed at 107.88-107.46, with specific emphasis on the 107.70/107.48 region (upper yellow zone), comprised of a 61.8% Fibonacci retracement value at 107.70 and an AB=CD (black arrows) 127.2% Fibonacci extension at 107.48.
Areas of consideration:
Outlook unchanged.
A reaction from 106 is a possibility today, along with a run towards 107.19/107. Psychological levels are prone to whipsaws, or more commonly referred to as ‘stop runs’, therefore waiting for additional bullish candlestick confirmation prior to committing funds is worth considering (entry/risk set according to candlestick range).
While the lower yellow H4 zone at 107.19/107 could contain price action, the research team still feels the area holding the ‘juice’ in this market is 107.88-107.46, given it merges closely with the daily trend line support-turned resistance. A short from the upper yellow zone held within at 107.70/107.48 is an ideal location to seek shorting opportunities, should we press this high.
USD/CAD:
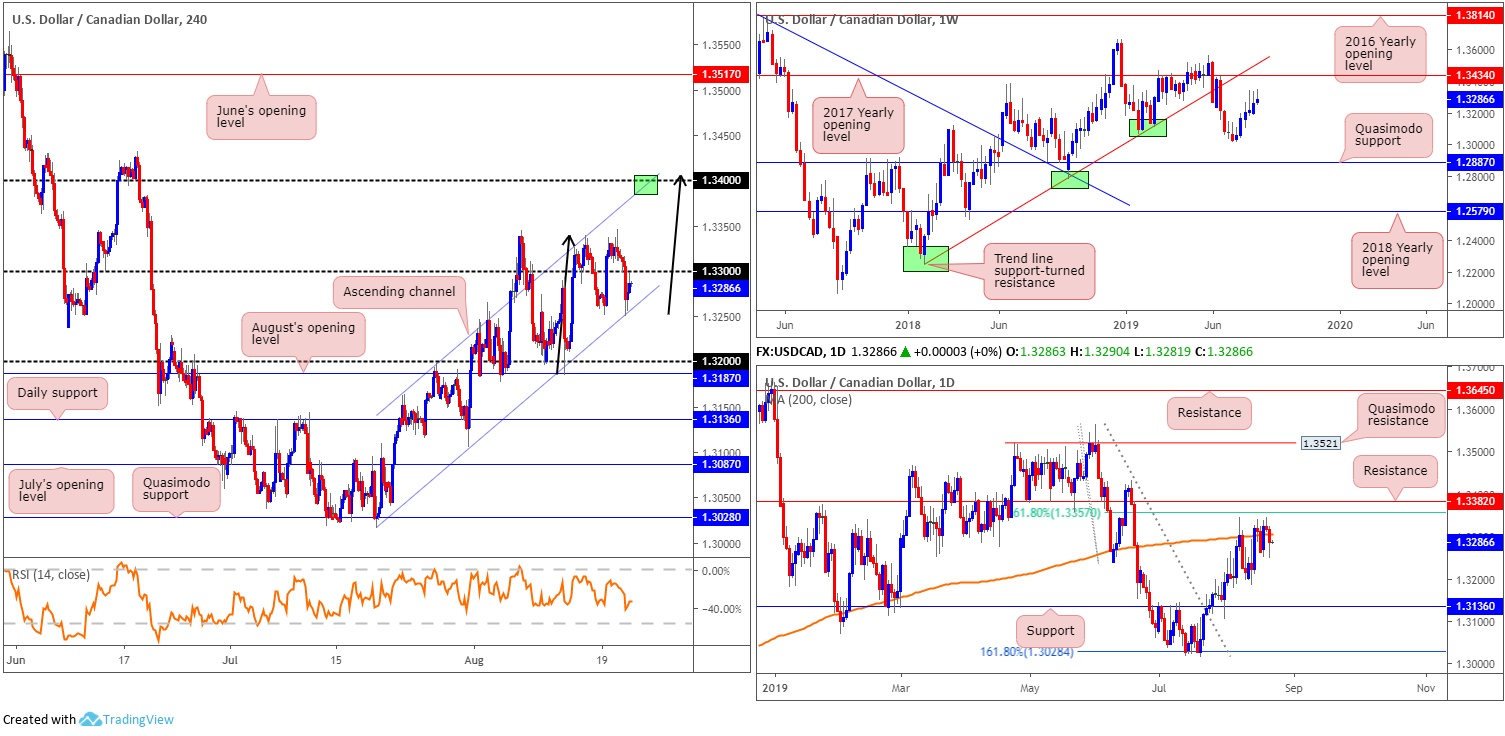
The Consumer Price Index (CPI) out of Canada rose 2.0% on a year-over-year basis in July, matching the increase in June, according to Statistics Canada. Prices increased year over year in all eight major components. On a seasonally adjusted monthly basis, the CPI increased 0.4% in July, following a 0.1% decline in June. The USD/CAD came under immediate pressure following the release Wednesday, dominating the 1.33 handle and testing channel support etched from the low 1.3015.
As evident from the H4 timeframe this morning, price action is defending the channel support though faces resistance at 1.33. A decisive move above 1.33 exhibits scope to approach channel resistance fixed from the high 1.3186 and 1.34. What’s also notable from a technical perspective is a possible ABCD correction (black arrows) forming that terminates a shade above 1.34.
The longer-term technical picture continues to top just south of the 2017 yearly opening level at 1.3434, closely shadowed by trend line support-turned resistance. Focus on the daily timeframe remains centred around the 200-day SMA (orange at 1.3307), traced close by resistance drawn from 1.3382 and a closely converging 61.8% resistance at 1.3357.
Areas of consideration:
Additional buying, according to the weekly timeframe, is a possibility until we reach 1.3434. Therefore, daily resistances mentioned above at 1.3307, 1.3357 and 1.3382 may give way. A way of verifying buyer intent is on the back of a H4 close above 1.33, perhaps unbolting the door towards channel resistance/1.34. In the event this comes to fruition, a long above 1.33 is an option, either on the breakout candle, or on a possible retest motion. In any case, using the candlestick structure to base entry and risk levels from is likely the method of choice for many traders.
USD/CHF:
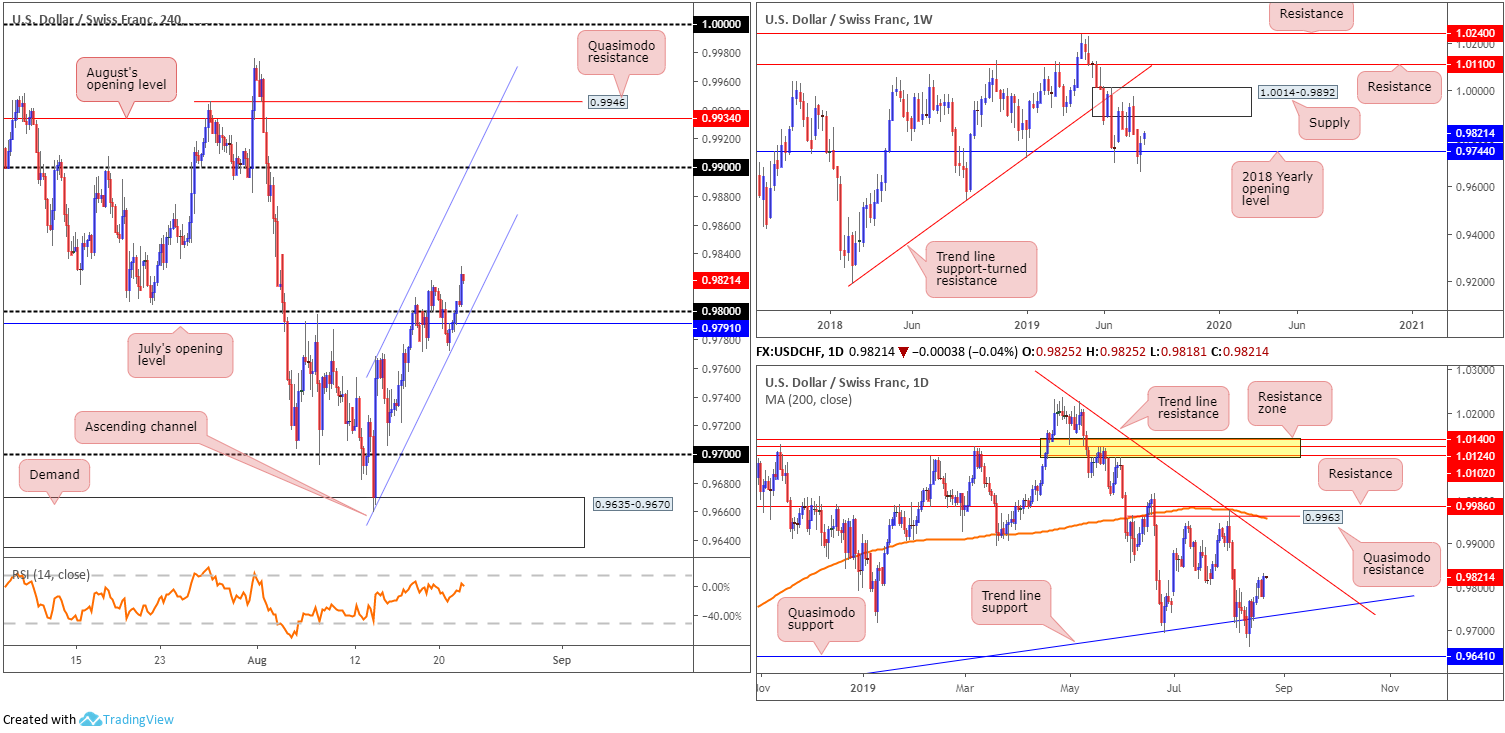
After dethroning 0.98 to the upside, July’s Federal Open Market Committee’s minutes provided fresh impetus to the USD/CHF market Wednesday, lifting the unit to near-three-week highs at 0.9831. Traders may also want to acknowledge the H4 candles are compressing within an ascending channel formation (0.9659/0.9768), which may continue to form as price approaches the 0.99 neighbourhood.
In terms of higher-timeframe technical structure, weekly price found stable ground at the 2018 yearly opening level drawn from 0.9744, tilting towards supply coming in at 1.0014-0.9892. Another factor bolstering the buyers is daily structure recently finding a floor off trend line support extended from the low 0.9542. Note also yesterday’s daily candle produced a bullish engulfing pattern, closing nearby its highs on the day. The next upside target can be seen at trend line resistance pencilled in from the high 1.0226.
Areas of consideration:
Chart studies on all three timeframes analysed reveal an upside bias, with generous upside to be had it seems. The H4 displays a clear runway to 0.99, the daily timeframe to also around 0.99 in the form of a trend line resistance and weekly price eyeing the lower boundary of supply at 0.9892.
Entering at current price is an option, with protective stop loss orders sited beyond July’s opening level at 0.9791. The risk equates to a little more than 30 points, though upside offers in excess of at least 70 points to the first upside objective.
Conservative traders, on the other hand, may opt to wait and see if another retest of H4 channel support occurs, preferably in the shape of a bullish candlestick signal, before initiating a trade. Not only will this provide additional support, the candlestick formation will likely offer traders a path to healthier risk/reward, assuming entry/risk levels are based on the back of its structure.
Dow Jones Industrial Average:
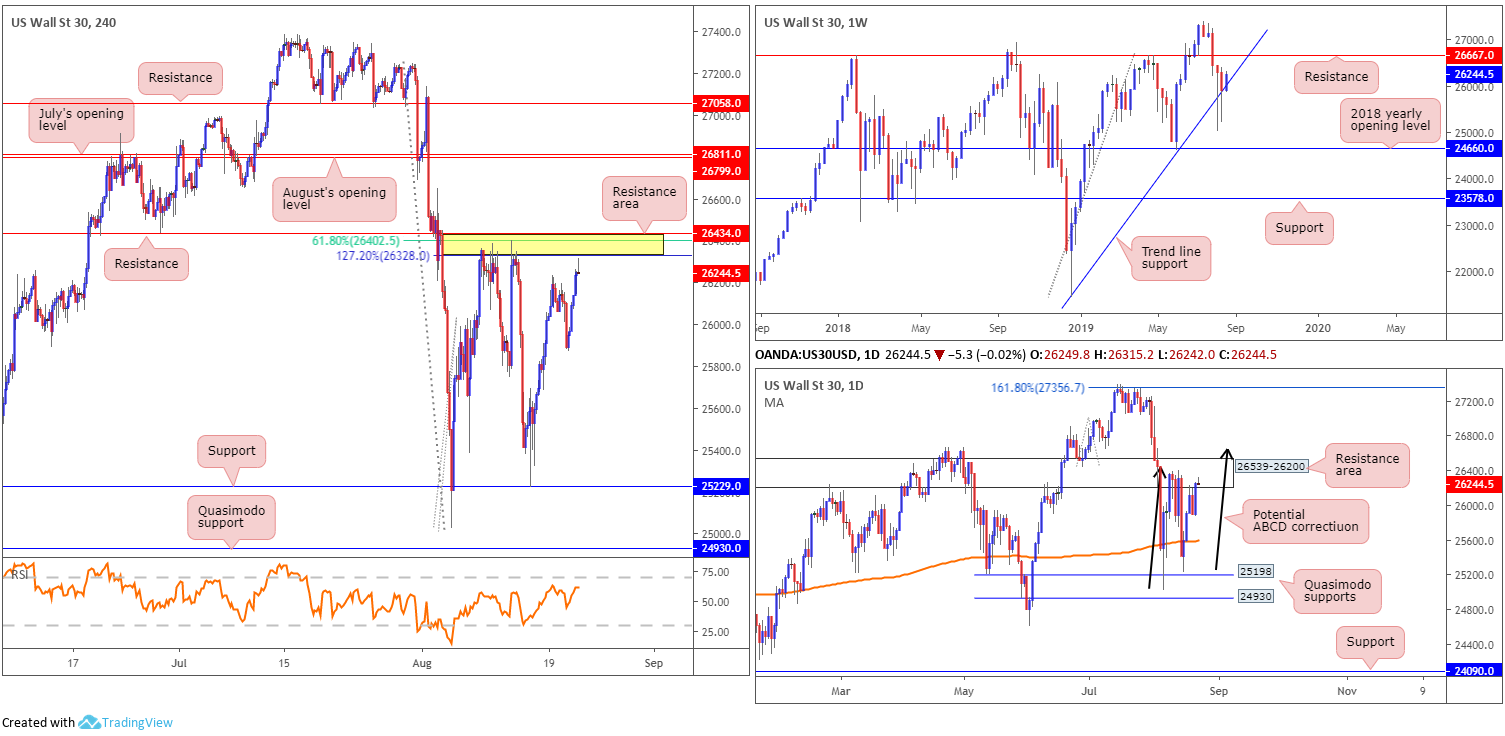
Amidst fresh optimism over consumer spending countering recent worries over economic growth, US equities reclaimed Tuesday’s losses Wednesday and extended gains following the release of minutes from the Federal Reserve’s July monetary policy meeting. The Dow Jones Industrial Average added 240.29 points, or 0.93%; the S&P 500 also added 23.92 points, or 0.82% and the tech-heavy Nasdaq 100 advanced 68.75 points, or 0.90%.
Technical chart studies focus the spotlight on H4 action, now trading within touching distance of a familiar resistance zone at 26434/26328 (comprised of resistance at 26434, a 127.2% Fibonacci ext. point at 26328 and a 61.8% Fibonacci retracement value at 26402). Beyond here, traders must contend with July and August’s opening levels at 26811 and 26799, respectively, whereas a rejection from 26434/26328 may steer the index to yesterday’s low at 25871, followed by support seen at 25229.
Price action on the daily timeframe is currently bounded by a Quasimodo support coming in at 25198 and a resistance area forged at 26539-26200, which, as you can see, entered the mix recently. What’s notable is the said resistance zone is sited just south of weekly resistance at 26667, which happens to fuse closely with a daily ABCD correction (black arrows). It is also worth noting the current daily resistance area merges with the said H4 zone.
Areas of consideration:
While there’s a chance weekly price may make a play for resistance at 26667 from the current trend line support (extended from the low 21452), the odds of a reaction being seen from the H4 resistance area at 26434/26328 is strong, though positioning protective stop-loss orders beyond the daily resistance zone at 26539-26200 is recommended. This simply adds another layer of protection from a whipsaw through the narrow H4 resistance area.
XAU/USD (GOLD):
Aside from a minor technical addition on the H4 timeframe, bullion’s technical landscape remains unchanged this morning, therefore much of the following will air thoughts expressed in recent reports.
From the weekly timeframe:
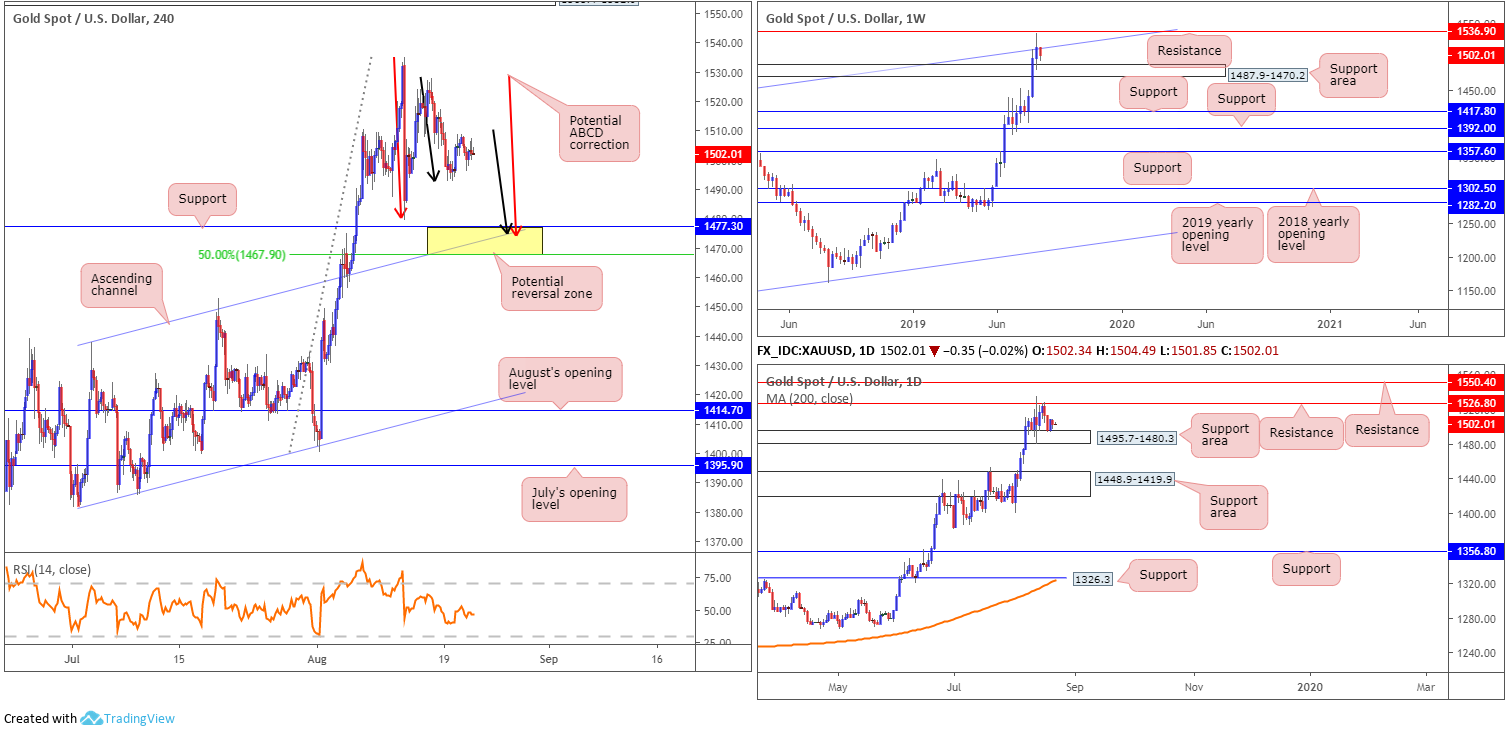
Kicking things off with a look at the weekly timeframe this morning, we can see the yellow metal trades marginally beneath channel resistance (etched from the high 1375.1), targeting a support area at 1487.9-1470.2. Overhead, it is also worth keeping a tab on resistance at 1536.9.
The daily timeframe:
The daily timeframe has price action rebounding from a support area coming in at 1495.7-1480.3 (glued to the top edge of the weekly support area), with the possibility of a run materialising towards resistance at 1526.8.
The H4 timeframe:
Across the page on the H4 timeframe, eyes likely remain on the 1467.9/1477.3 area for potential longs. Comprised (yellow) of a potential ABCD correction at 1473.8 (red arrows), another potential ABCD correction (black arrows) at the same level, a channel resistance-turned support extended from the high 1437.7 and a 50.0% retracement ratio at 1467.9, 1467.9/1477.3 stands a good chance of holding price action higher if tested. In addition, it might also be worth noting the H4 support area is sited around the lower edge of the weekly support area mentioned above at 1487.9-1470.2, though is positioned outside of the borders of the daily support area at 1495.7-1480.3.
Areas of consideration:
Entry at 1477.3 is an option at the H4 support area, with a protective stop-loss order placed at 1465.2. Traders wanting to add a little more confirmation may opt to wait and see if H4 price chalks up a candlestick signal before committing funds to the market. That way, buyer intent is visible, as well as having a base (the candlestick structure) to set entry and risk levels.
In terms of initial upside targets, the research team suggests considering the 38.2%/61.8% Fibonacci retracements of the A-D legs, once the ABCD formation completes.
The accuracy, completeness and timeliness of the information contained on this site cannot be guaranteed. IC Markets does not warranty, guarantee or make any representations, or assume any liability regarding financial results based on the use of the information in the site.
News, views, opinions, recommendations and other information obtained from sources outside of www.icmarkets.com.au, used in this site are believed to be reliable, but we cannot guarantee their accuracy or completeness. All such information is subject to change at any time without notice. IC Markets assumes no responsibility for the content of any linked site.
The fact that such links may exist does not indicate approval or endorsement of any material contained on any linked site. IC Markets is not liable for any harm caused by the transmission, through accessing the services or information on this site, of a computer virus, or other computer code or programming device that might be used to access, delete, damage, disable, disrupt or otherwise impede in any manner, the operation of the site or of any user’s software, hardware, data or property.


