Key risk events today:
Australia Employment Change and Unemployment Rate; BoJ Outlook Report, Monetary Policy Statement and Press Conference; ECB Monetary Policy Statement, Main Refinancing Rate and Press Conference; Philly Fed Manufacturing Index; US Unemployment Claims; BoE Gov. Bailey Speaks; New Zealand Inflation (CPI q/q).
(Previous analysis as well as outside sources – italics).
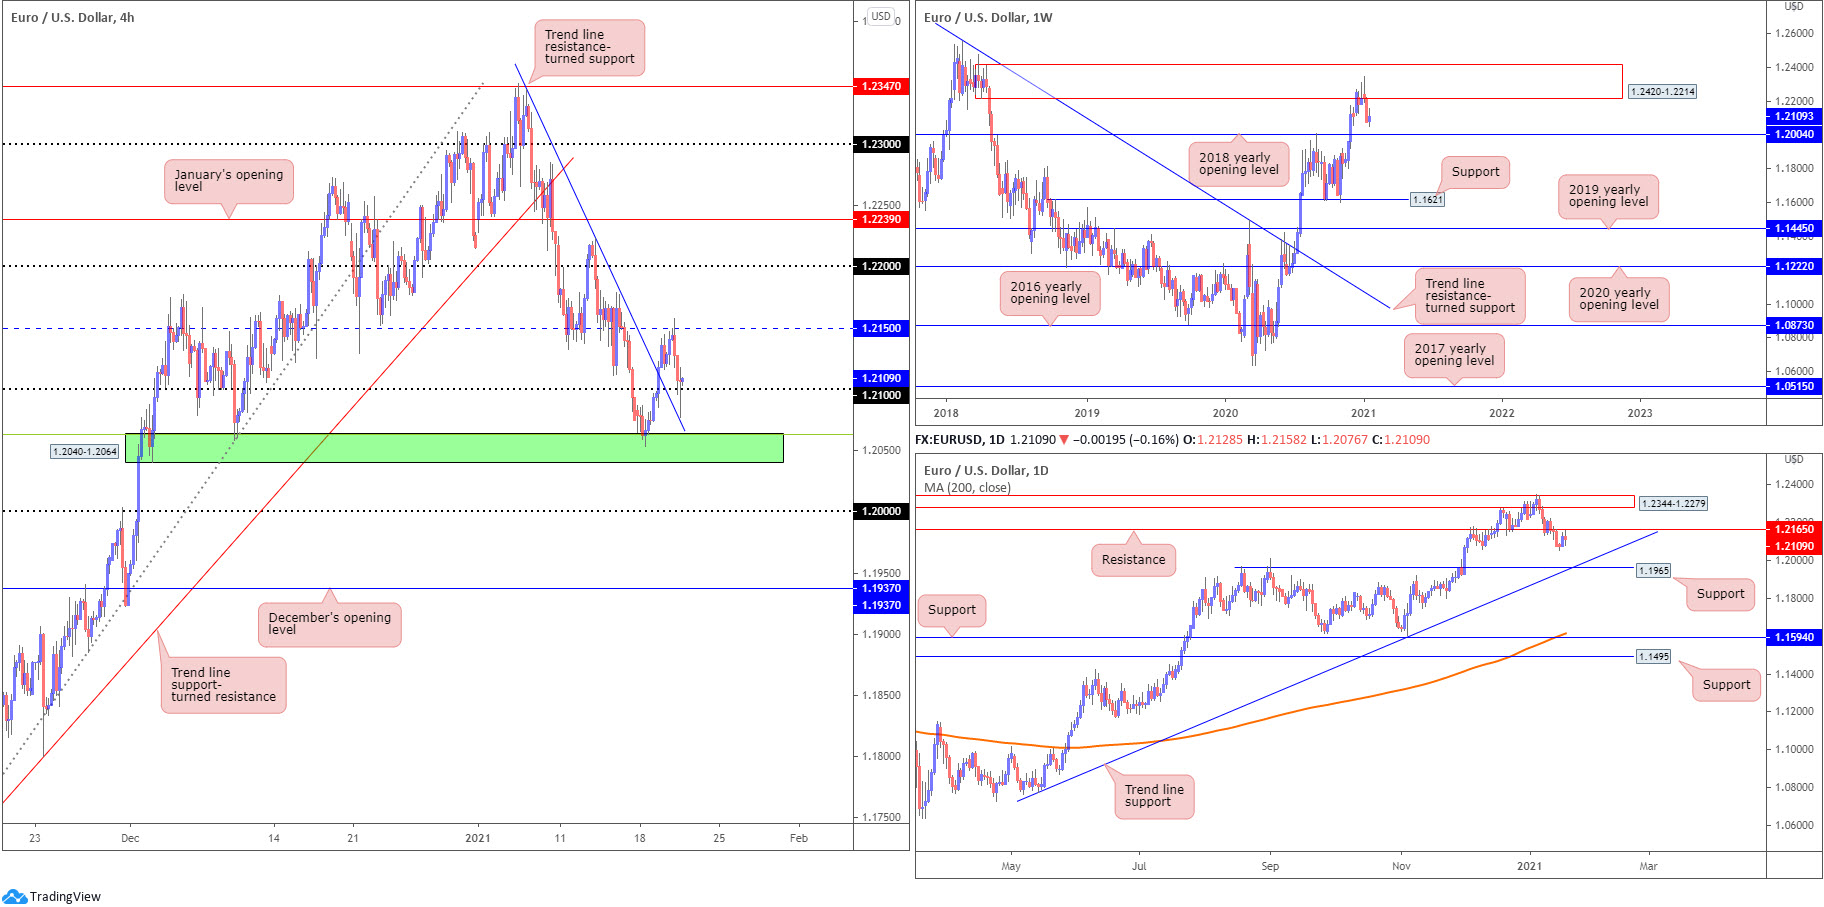
EUR/USD:
Areas of consideration:
- Following a 1.2150 resistance rejection on Wednesday, H4 swept through the 1.21 figure to test trend line resistance-turned support, taken from the high 1.2344. The round number and trend line support combination, therefore, could entice a short-term bullish scenario today.
- While H4 overthrowing resistance at 1.2150 helps confirm an upside bias, traders are urged to pencil in daily resistance at 1.2165. This is an obstacle that may halt upside attempts.
- H4 demand at 1.2040-1.2064 (converging with a 38.2% Fib level at 1.2062) is an area to remain watchful of, though lacks higher timeframe convergence.
- The 2018 yearly opening value at 1.2004 plotted on the weekly scale might be of interest, given the barrier converges with the key figure 1.20 on the H4. Weekly supply is another nearby zone worth keeping an eye on at 1.2420-1.2214. The 1.22 figure on the H4, therefore, may serve as interesting resistance.
- Daily support at 1.1965 and merging trend line support, extended from the low 1.0774, are levels that will likely call for attention should 1.20 on the H4 give way. Traders may also acknowledge December’s opening value nearby at 1.1937 (H4).
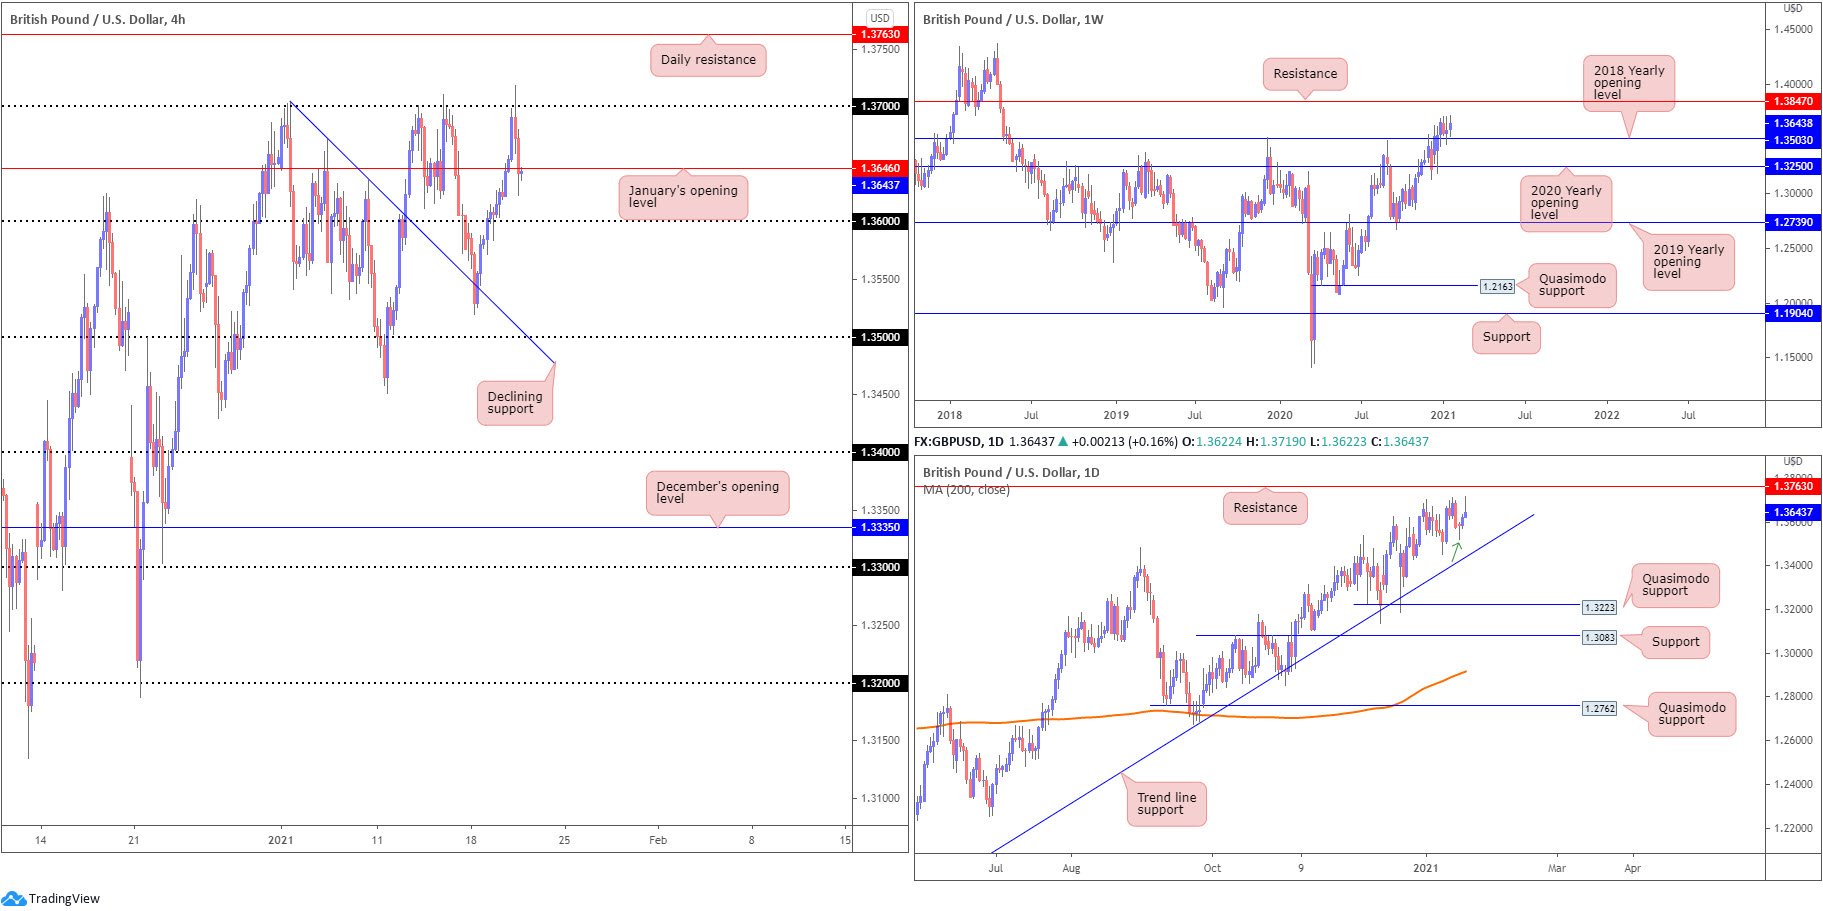
GBP/USD:
Areas of consideration:
- Long-term flow—Weekly support at 1.3503 holding (2018 yearly opening value), in a market trending higher, places long-term buyers in a favourable position. In terms of resistance on the weekly timeframe, buyers could take aim at 1.3847.
- Price action on the daily timeframe, despite recently establishing a bullish pivot reversal formation (green arrow), formed a clear-cut shooting star pattern on Wednesday—a bearish signal. Levels to be conscious of on the daily chart are trend line support, taken from the low 1409, and resistance at 1.3763.
- 37 proved itself once again on Wednesday as an effective resistance, forcing H4 flow under January’s opening value at 1.3646 and shining the spotlight on 1.36 today as possible support. Should price eventually overthrow 1.37, daily resistance mentioned above at 1.3763 is in sight. Therefore, a bullish theme could emerge north of 1.37.
- Weekly support at 1.3503 and daily trend line support is an area of confluence that may stir traders should the levels make an appearance. This also draws in the 1.35 figure on the H4.
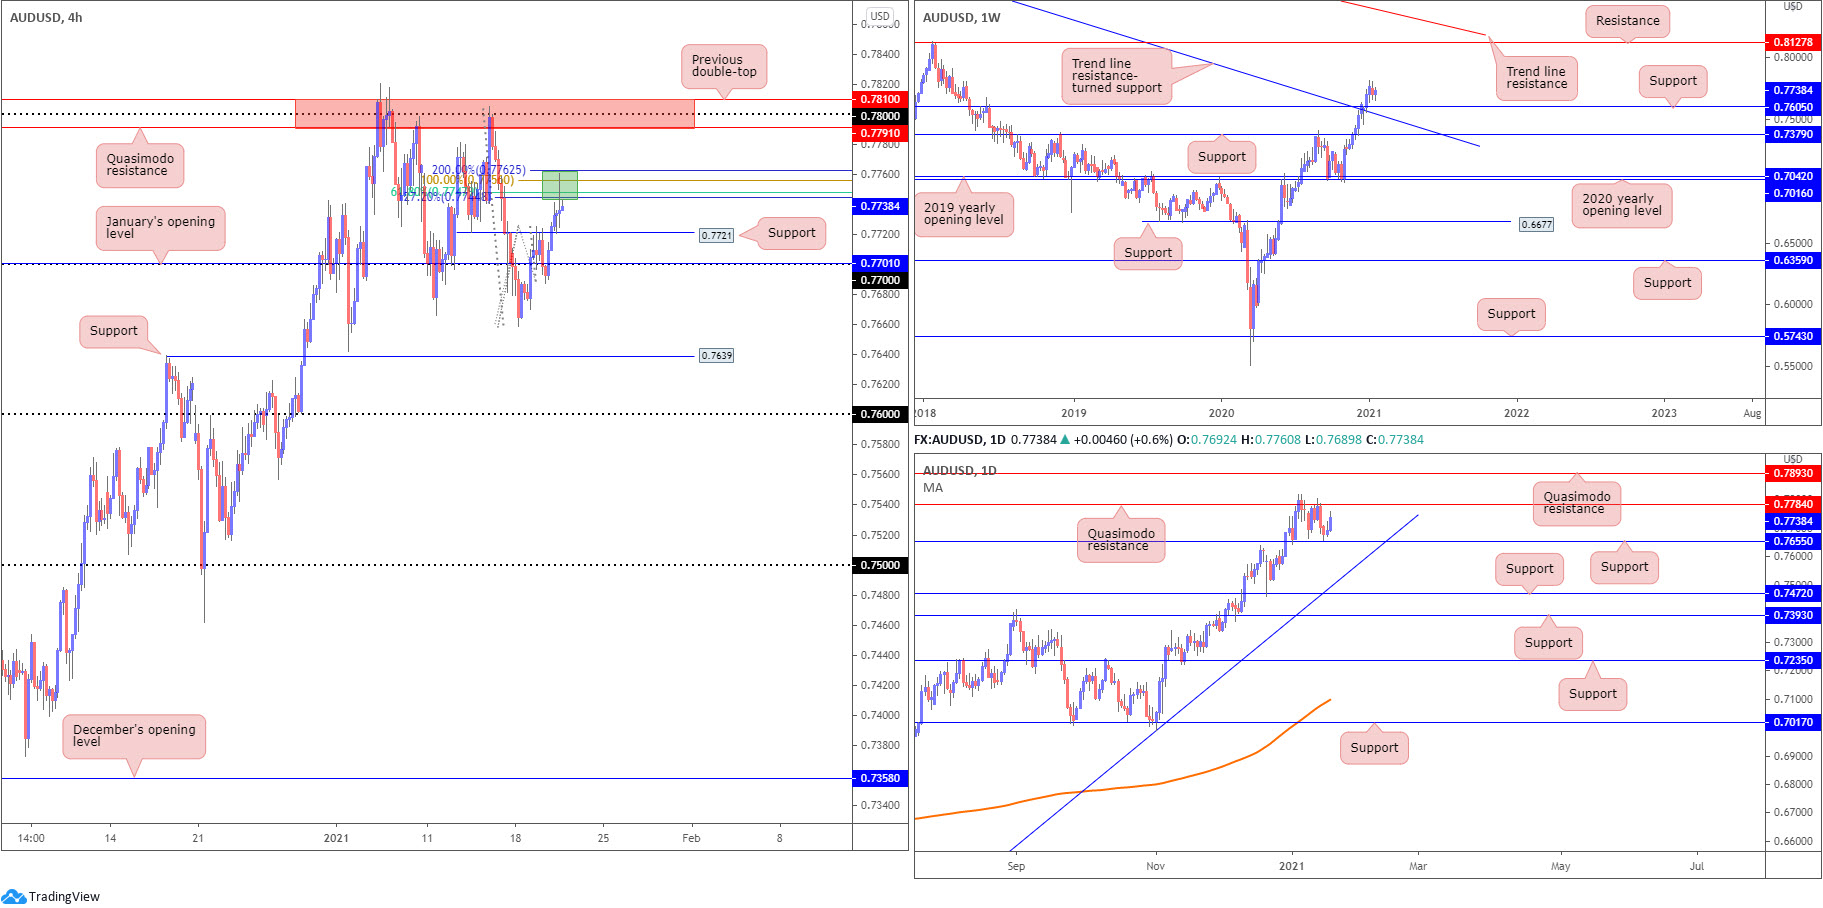
AUD/USD:
Areas of consideration:
- After taking out H4 resistance at 0.7721 on Wednesday (now a serving support), H4 shook hands with a Fibonacci resistance zone drawn from 0.7762-0.7744 (green). Above, H4 resistance between 0.7810 and 0.7791 remains a noteworthy base, joining closely with daily Quasimodo resistance at 0.7784. Below 0.7721, 0.77 and January’s opening value at 0.7701 are seen as nearby support (H4).
- Trend has remained firmly to the upside since early 2020. In addition to this, the weekly timeframe shows price has room to reach as far north as resistance at 0.8127. Though before pushing higher, a retest at support drawn from 0.7605 (previous weekly Quasimodo resistance) could take shape. Consequently, 0.76 on the H4 scale is interesting, a level not only mingling with weekly support, but also converging with a 127.2% H4 Fibonacci extension point at 0.7606.
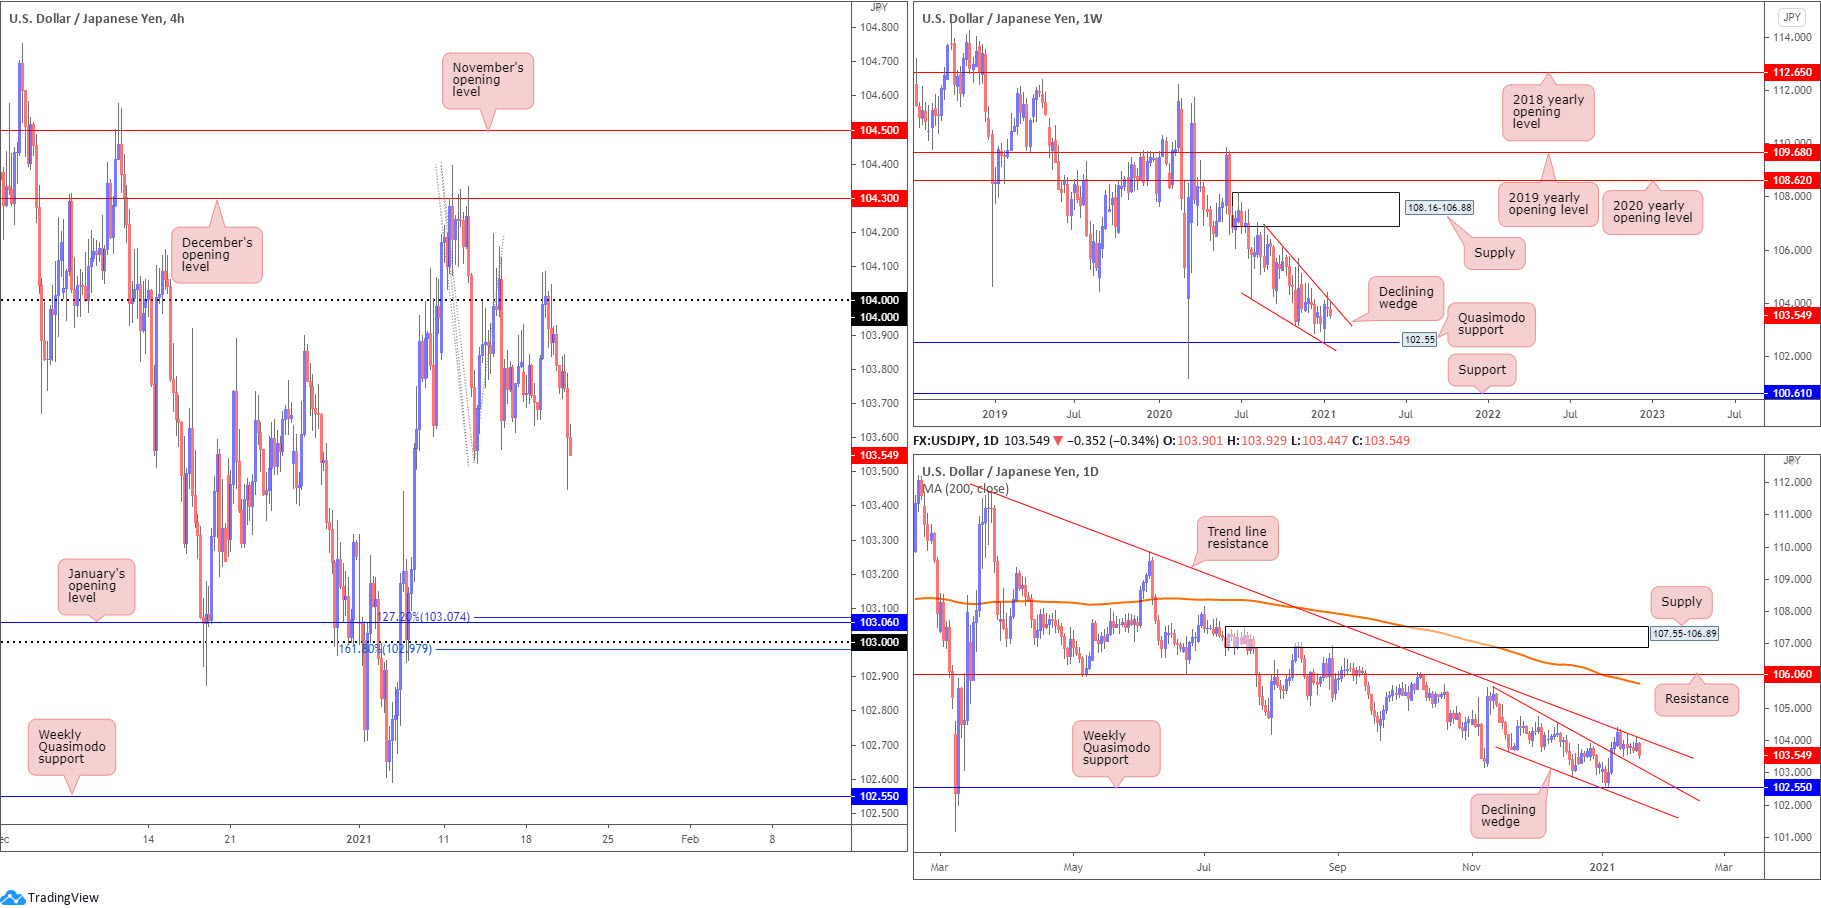
USD/JPY:
Areas of consideration:
- Since connecting with the underside of weekly supply at 108.16-106.88 in August (2020), price has gradually shifted lower and developed a weekly declining wedge (106.94/104.18). Notably, price recently connected with the upper edge of this pattern, which also fuses with daily trend line resistance, extended from the high 111.71.
- Technically, the higher timeframe picture elevated the appeal of 104 as a resistance on the H4. Breaching 103.52 (January 13 low) may induce further selling, targeting the upper boundary of the penetrated declining wedge (currently around 103.10) on the daily timeframe (taken from the high 105.67), followed by January’s opening value at 103.06 and the 103 figure (H4). Traders will also acknowledge the 127.2% Fibonacci extension point at 103.07 and a 161.8% Fibonacci projection point at 102.97.
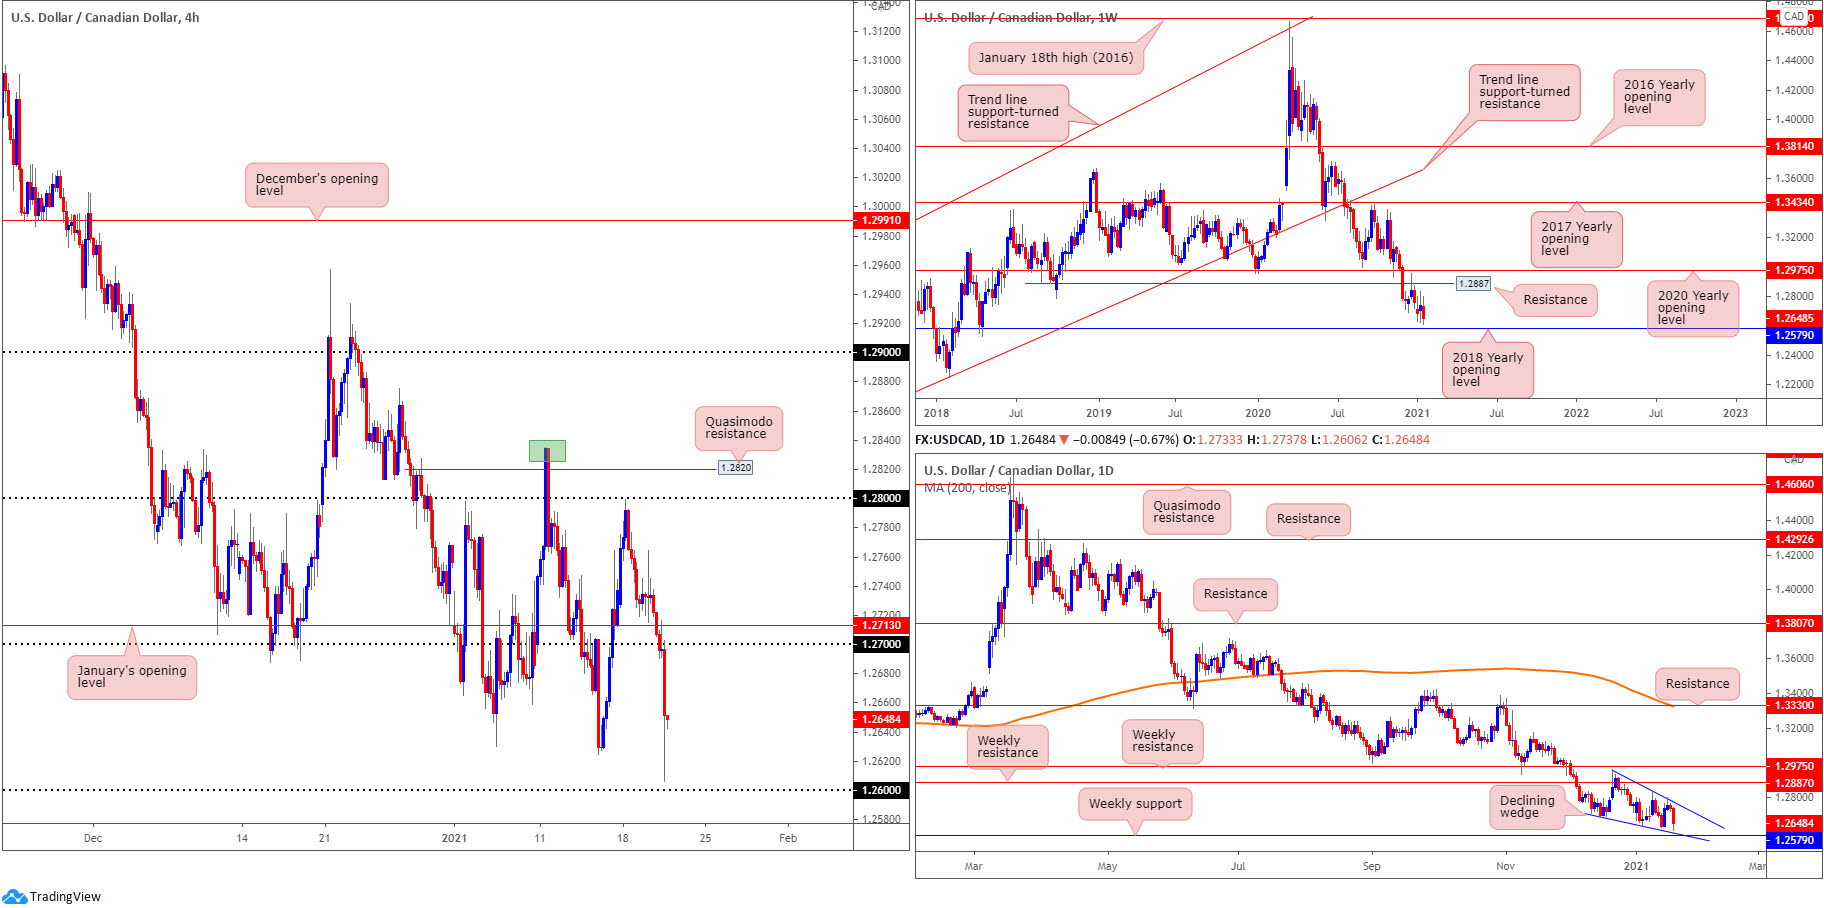
USD/CAD:
Areas of consideration:
- In a market trending lower since March 2020, weekly price is on course to cross swords with the 2018 yearly opening value at 1.2579. This follows the retest of weekly resistance at 1.2887 in late December, a previous Quasimodo support level.
- On the daily timeframe, the declining wedge (1.2957/1.2688) is a pattern worth monitoring, forming in between the weekly support and resistance levels mentioned above.
- After USD/CAD chewed through 1.27 on Wednesday, H4 price refreshed multi-month lows ahead of the 1.26 figure. A retest at 1.27 could be in store today, sheltered just under January’s opening value at 1.2713. Also, it’s important to recognise that beyond 1.26, the weekly support level at 1.2579 (2018 yearly opening value) is seen.
The accuracy, completeness and timeliness of the information contained on this site cannot be guaranteed. IC Markets does not warranty, guarantee or make any representations, or assume any liability regarding financial results based on the use of the information in the site.
News, views, opinions, recommendations and other information obtained from sources outside of www.icmarkets.com.au, used in this site are believed to be reliable, but we cannot guarantee their accuracy or completeness. All such information is subject to change at any time without notice. IC Markets assumes no responsibility for the content of any linked site.
The fact that such links may exist does not indicate approval or endorsement of any material contained on any linked site. IC Markets is not liable for any harm caused by the transmission, through accessing the services or information on this site, of a computer virus, or other computer code or programming device that might be used to access, delete, damage, disable, disrupt or otherwise impede in any manner, the operation of the site or of any user’s software, hardware, data or property.


