
Key risk events today:
UK Retail Sales m/m; ECB Monetary Policy Meeting Accounts; Philly Fed Manufacturing Index; Crude Oil Inventories.
(Previous analysis as well as outside sources – italics).
EUR/USD:
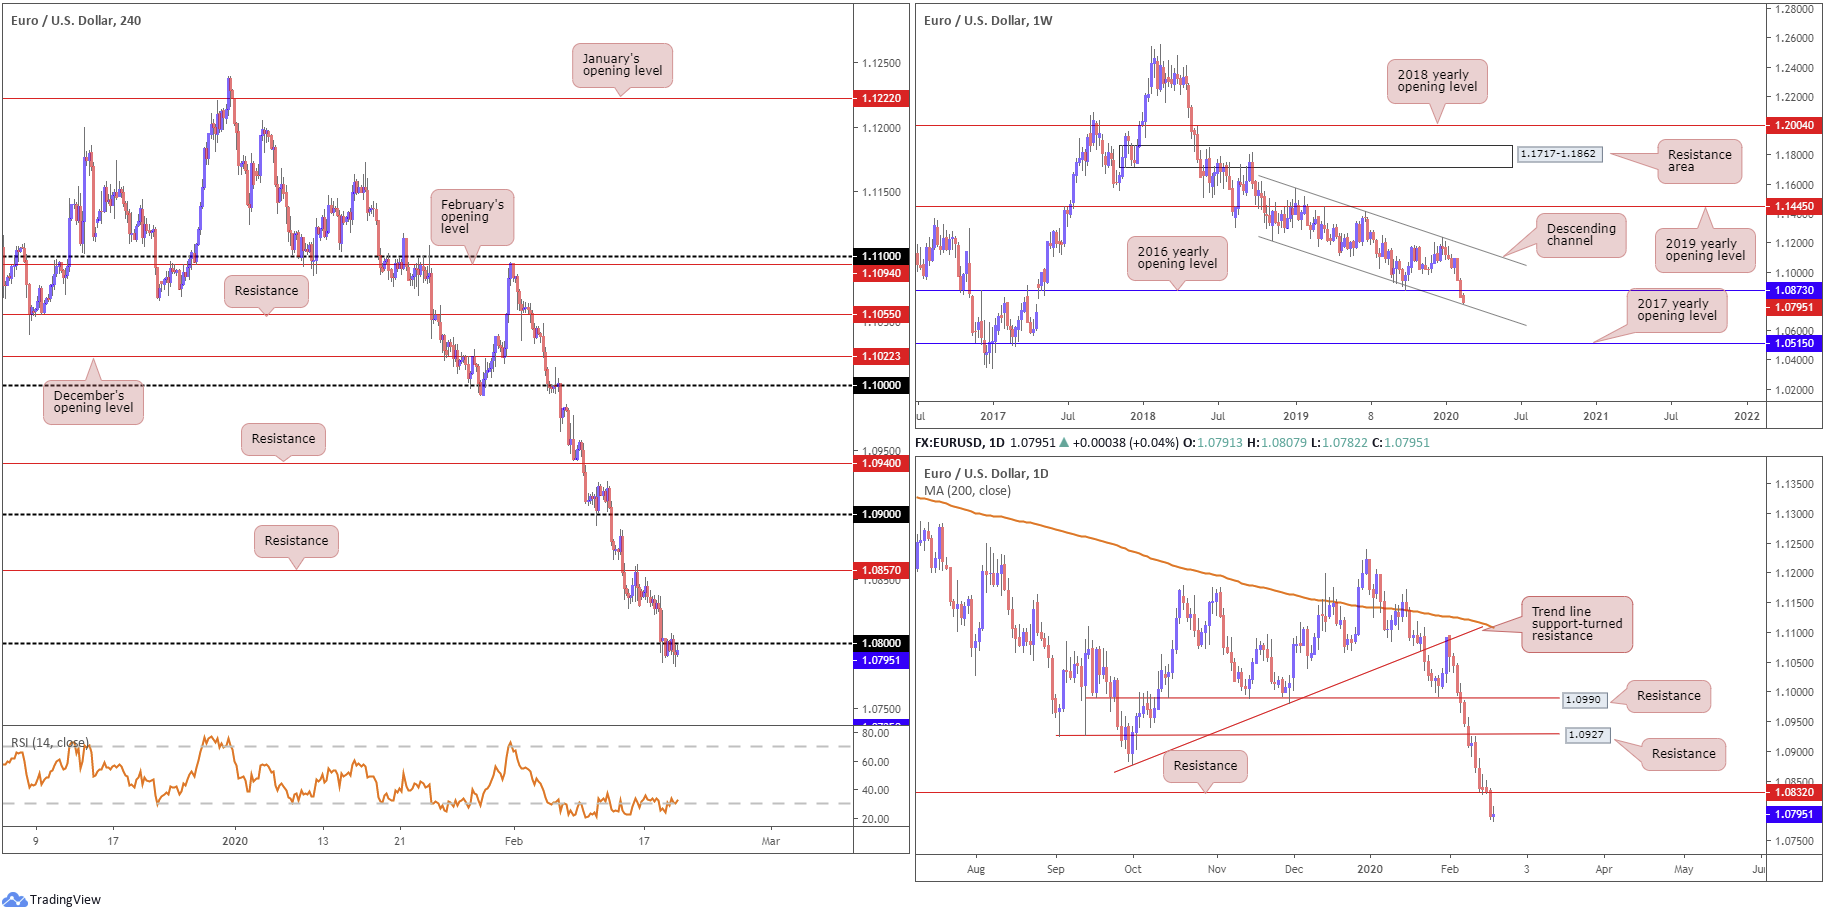
EUR/USD continues to echo a bearish stance, capped at the underside of the 1.08 handle on the H4 timeframe. The US dollar index continued marching higher Wednesday, scoring highs at 99.71, levels not seen since May 2017. Continuation to the upside could deliver the 100.00 handle. On the data front, upbeat US PPI and US building permits figures provided additional impetus to the already robust buck. FOMC Meeting Minutes, nonetheless, generated a limited reaction.
Technically, we now have weekly price crossing paths with channel support, taken from the low 1.1109, after engulfing the 2016 yearly opening level from 1.0873 last week. Daily flow, on the other hand, has price trading below support priced in at 1.0832, now a serving resistance. The next port of call, in terms of supportive structure on the daily timeframe, falls in at 1.0677.
The H4 timeframe, as briefly highlighted above, shows the unit gripping the underneath of 1.08. While the next support on the H4 scale can be found at 1.0735, traders need to acknowledge the prospect of a move forming off weekly channel support. Indicator-based traders may also want to note the relative strength index (RSI) has remained oversold since February 6th.
Areas of consideration:
Those who read Wednesday’s technical briefing may recall the following:
A dip through 1.08, triggering sell-stop liquidity, to the aforementioned channel support on the weekly timeframe is certainly a scenario worth keeping an eye out for. A test at the weekly channel support followed up with a close above 1.08 would, for most price-action based traders, be considered a reliable countertrend signal, with daily resistance at 1.0832 positioned as the initial upside target.
The above post remains intact, therefore, a H4 close back above 1.08 is eyed today.
GBP/USD:
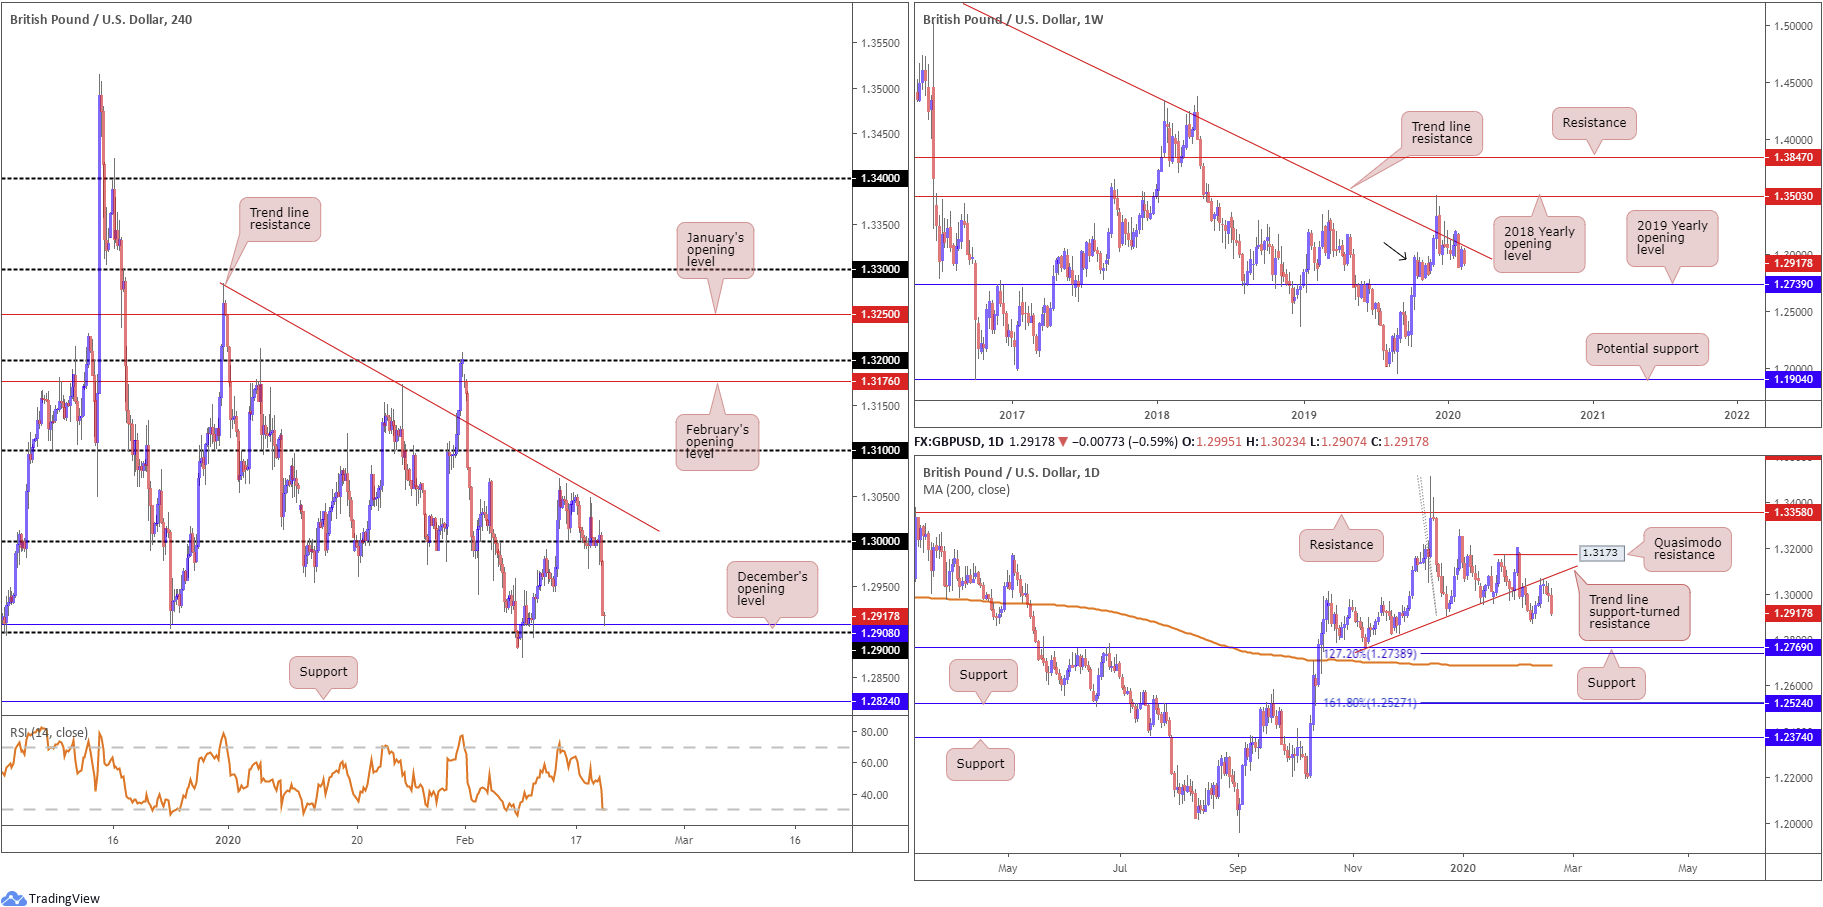
Despite firmer-than-forecast UK inflation data Wednesday, sterling failed to sustain recovery gains north of the key figure 1.30. USD strength ultimately weighed on the pound, drawing price action to December’s opening level at 1.2908, sited a whisker above the 1.29 handle. What’s also notable from the H4 timeframe is the relative strength index (RSI) seen entering oversold territory. Beneath 1.29, the 1.2872 February 10th low is in sight, though the more logical support resides around 1.2824.
On a wider perspective, we have the weekly timeframe languishing beneath long-standing trend line resistance, pencilled in from the high 1.5930, though demand around the 1.2939 region is also still in motion (black arrow). Continued downside may imply a break of the said demand, tripping sell stops and testing the 2019 yearly opening level at 1.2739. A break higher, on the other hand, could see the 2018 yearly opening level enter the fight at 1.3503.
Last week, on the daily timeframe, ended at the underside of a trend line support-turned resistance, extended from the low 1.2768. Although sellers stepped in on Monday and appeared poised to challenge lower levels, daily price signified hesitance on Tuesday. Wednesday, however, sent the unit lower and concluded within striking distance of the 1.2872 February 10th low that we highlighted above on the H4 scale. Past this region, further selling may set the stage for a run to support fixed at 1.2769, a 127.2% Fibonacci extension at 1.2738 and the 200-day SMA (1.2688). Note the said SMA has been flattening since mid-October 2019.
Areas of consideration:
Ultimately, the higher timeframes suggest we could be in for more losses in this market, with daily support at 1.2769 in line as the initial downside target.
A H4 close below 1.29 today, therefore, could be in store. Traders then have the choice of entering short on the back of the breakout candle’s close or waiting and seeing if a retest at 1.29 occurs before pulling the trigger. The first take-profit target can be found at H4 support mentioned above from 1.2824.
AUD/USD:
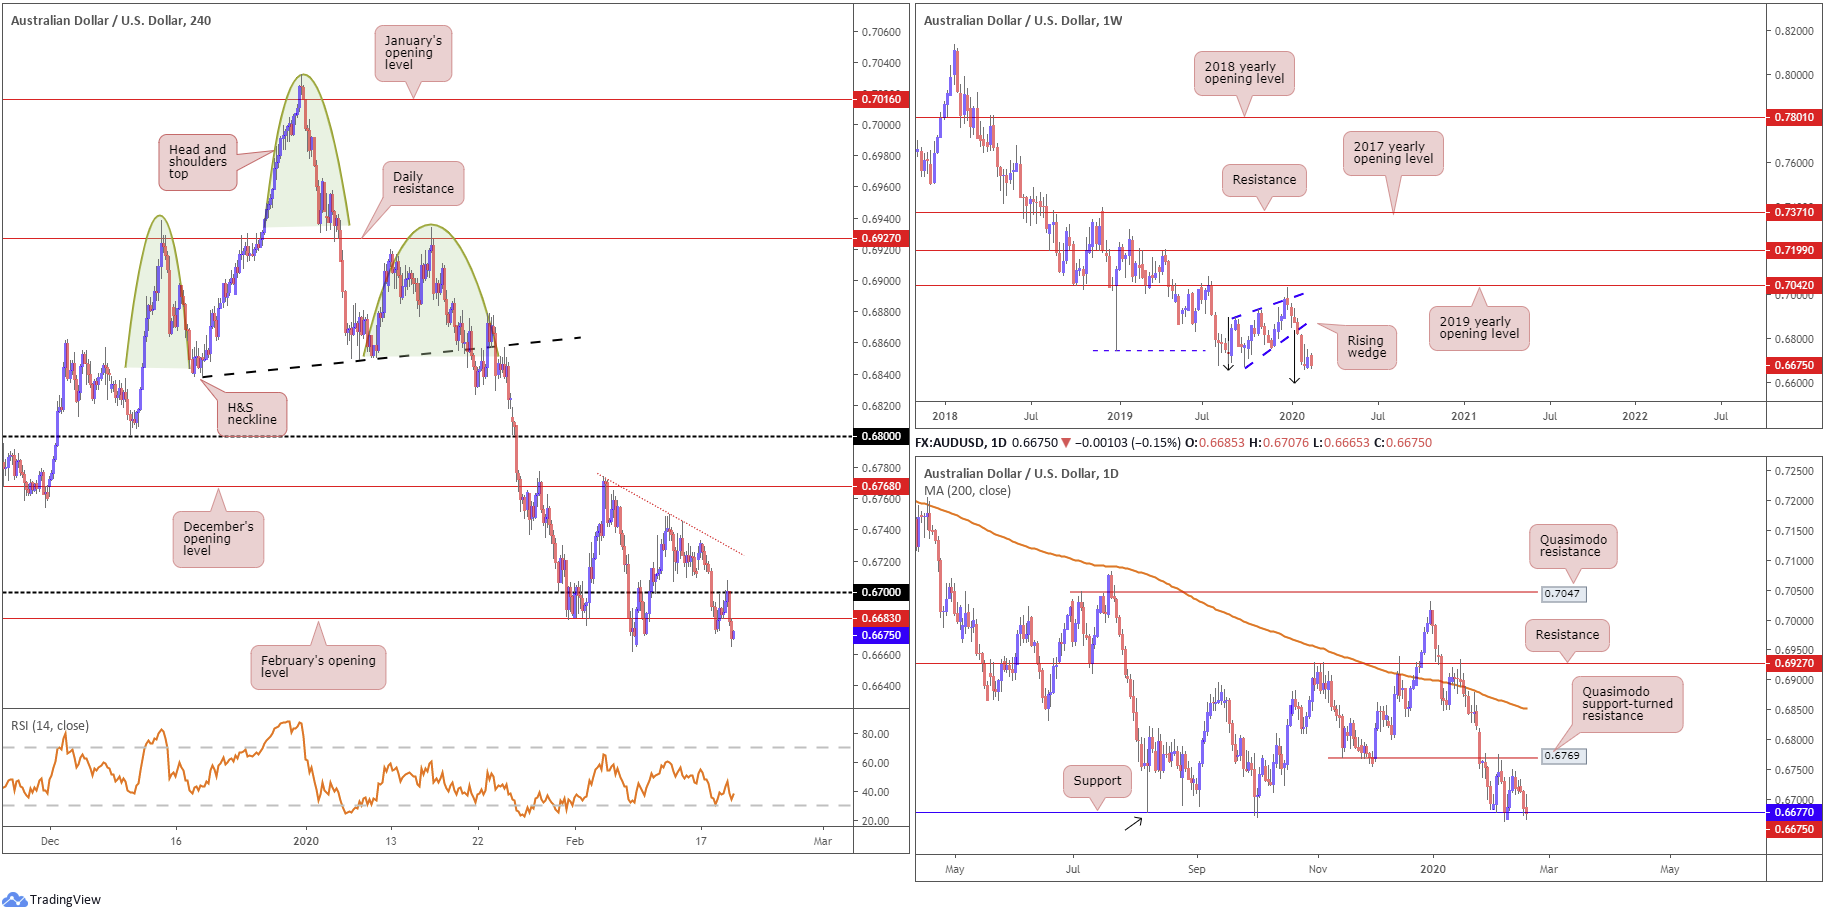
Unable to escape the US dollar’s clutches, the Australian dollar pencilled in a retest at the underside of 0.67 amid early London hours Wednesday and gripped lower levels. H4 price trades south of February’s opening level at 0.6683 going into Thursday, echoing the possibility of surpassing the 0.6662 February 7th low to the 0.66 handle (not visible on the screen).
The story on the weekly timeframe remains unchanged. Since registering a bottom in late September at 0.6670 (2019), weekly price carved out a rising wedge formation, typically considered a continuation pattern within a trending environment. The past six weeks witnessed price decline back into the rising wedge and extend beyond the lower boundary. With the primary downtrend having been in full force since topping at 0.8135, in early 2018, further downside is possible, despite last week’s modest recovery. Assuming a close beneath the 0.6670 September 30th low, the rising wedge take-profit (black arrows – calculated by taking the height of the base and adding it to the breakout point) is seen at 0.6599, followed by support at 0.6359 (not visible on the screen).
The key observation on the daily timeframe is support coming in at 0.6677, which entered view following a failed attempt to reach Quasimodo support-turned resistance at 0.6769. The next support target beyond 0.6677, in the event of further selling, falls in around 0.6508 (not visible on the screen).
Areas of consideration:
Weekly price invites further selling, according to our chart studies, suggesting a move south of 0.67 on the H4 timeframe to 0.66 (not visible on the screen). Daily price could, on the other hand, defend support at 0.6677.
Either scenario is possible, though further selling being the more likely theme given the primary downtrend and the weekly timeframe’s structure usually taking precedence over the lower timeframes. As a result, keep eyes on February’s opening level at 0.6683 for retest scenarios today, though consider waiting for additional candlestick confirmation to form before pulling the trigger as daily price could still attempt a recovery off support off 0.6677.
Well done to any readers who shorted 0.67 as this was a noted level of interest in Wednesday’s analysis.
USD/JPY:
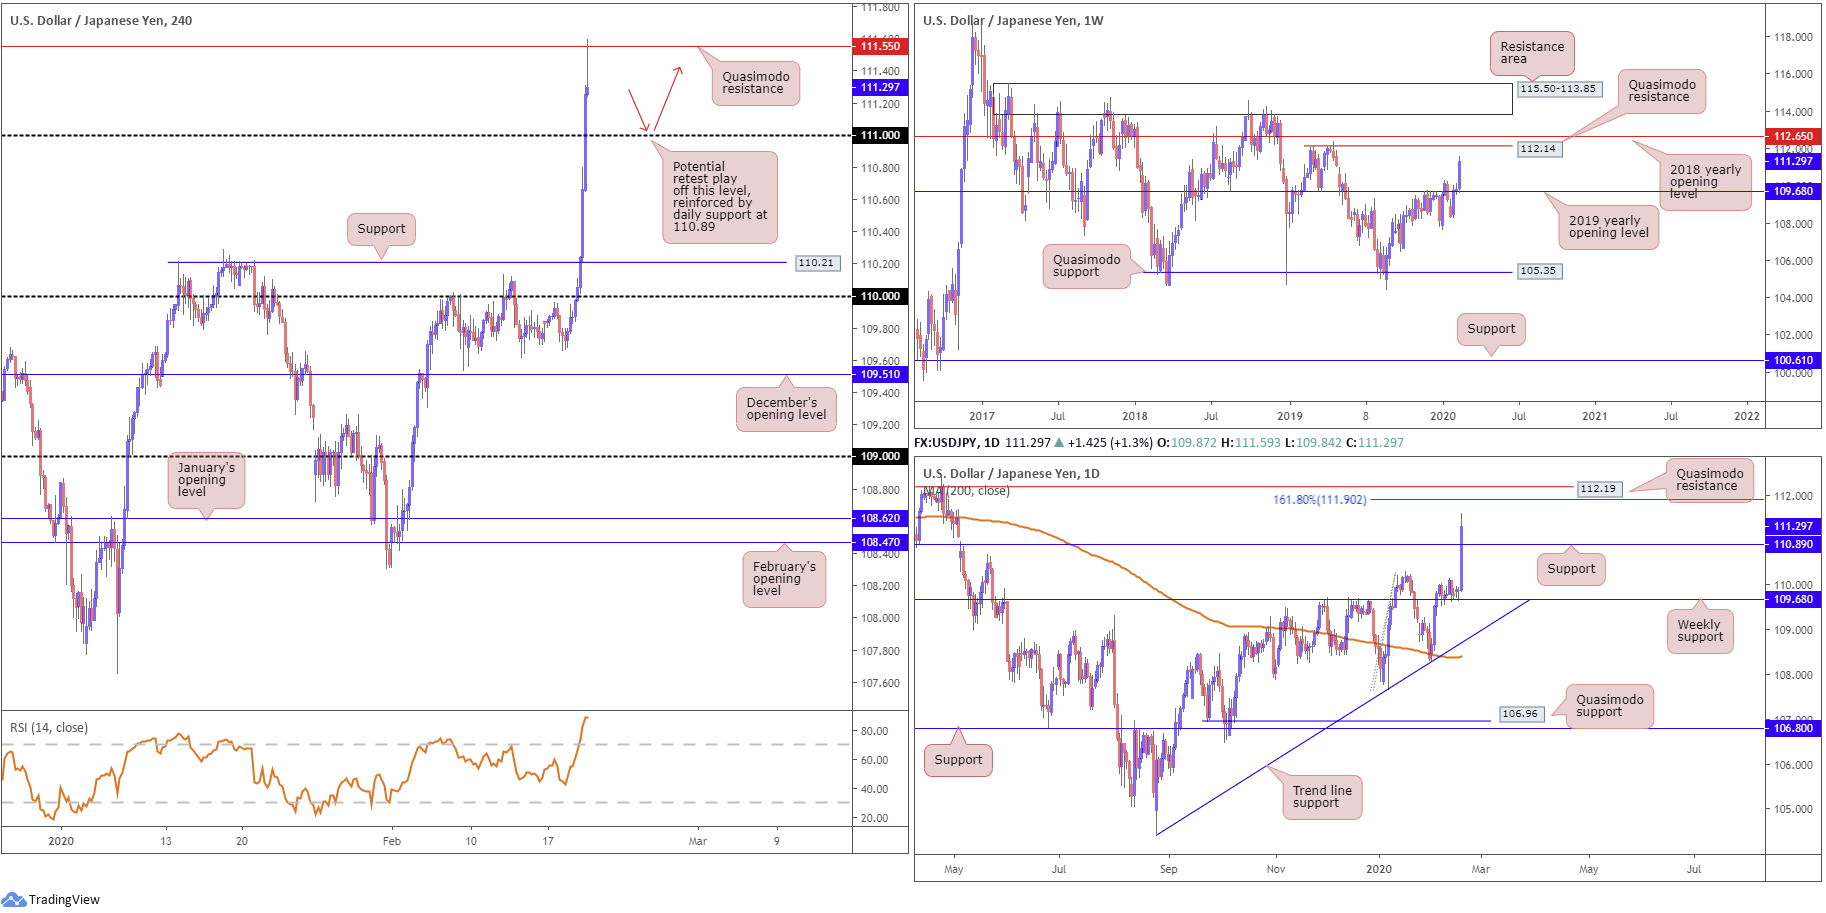
The Japanese yen, a marked underperformer, took on the brunt of the unwinding of safe-haven flows Wednesday, with USD/JPY rallying to highs at 111.59, levels not seen since May 2019. A number of key technical resistances yielded, including the 110/11 handles, along with daily resistance plotted at 110.89, now a serving support level. The relative strength index (RSI) is also seen trading off highs at 90.00, which is considered extremely overbought.
While H4 price is fading Quasimodo resistance drawn from early May 2019 at 111.55, higher-timeframe charts exhibit scope to explore higher ground. The daily timeframe has eyeballs on the 161.8% Fibonacci extension at 111.90, closely shadowed by Quasimodo resistance at 112.19. Converging closely with the said Quasimodo is another layer of Quasimodo resistance on the weekly timeframe at 112.14, though is seen circling a few points below the 2018 yearly opening level plotted at 112.65.
Areas of consideration:
The reaction off the current H4 Quasimodo resistance will likely be a short-lived move to 111, before continuing higher, according to the market’s position on the higher timeframes.
111, therefore, is a potential support worthy of attention today for long opportunities, targeting the 161.8% Fibonacci extension on the daily timeframe at 111.90 as the initial upside take-profit level. Round numbers are notoriously prone to whipsaws; waiting for additional confirmation to form before committing is recommended, though is, of course, trader dependent. It is also worth pointing out daily support at 110.89 inhabits ground just south of 111, so a whipsaw is highly likely to be seen into this level before turning higher.
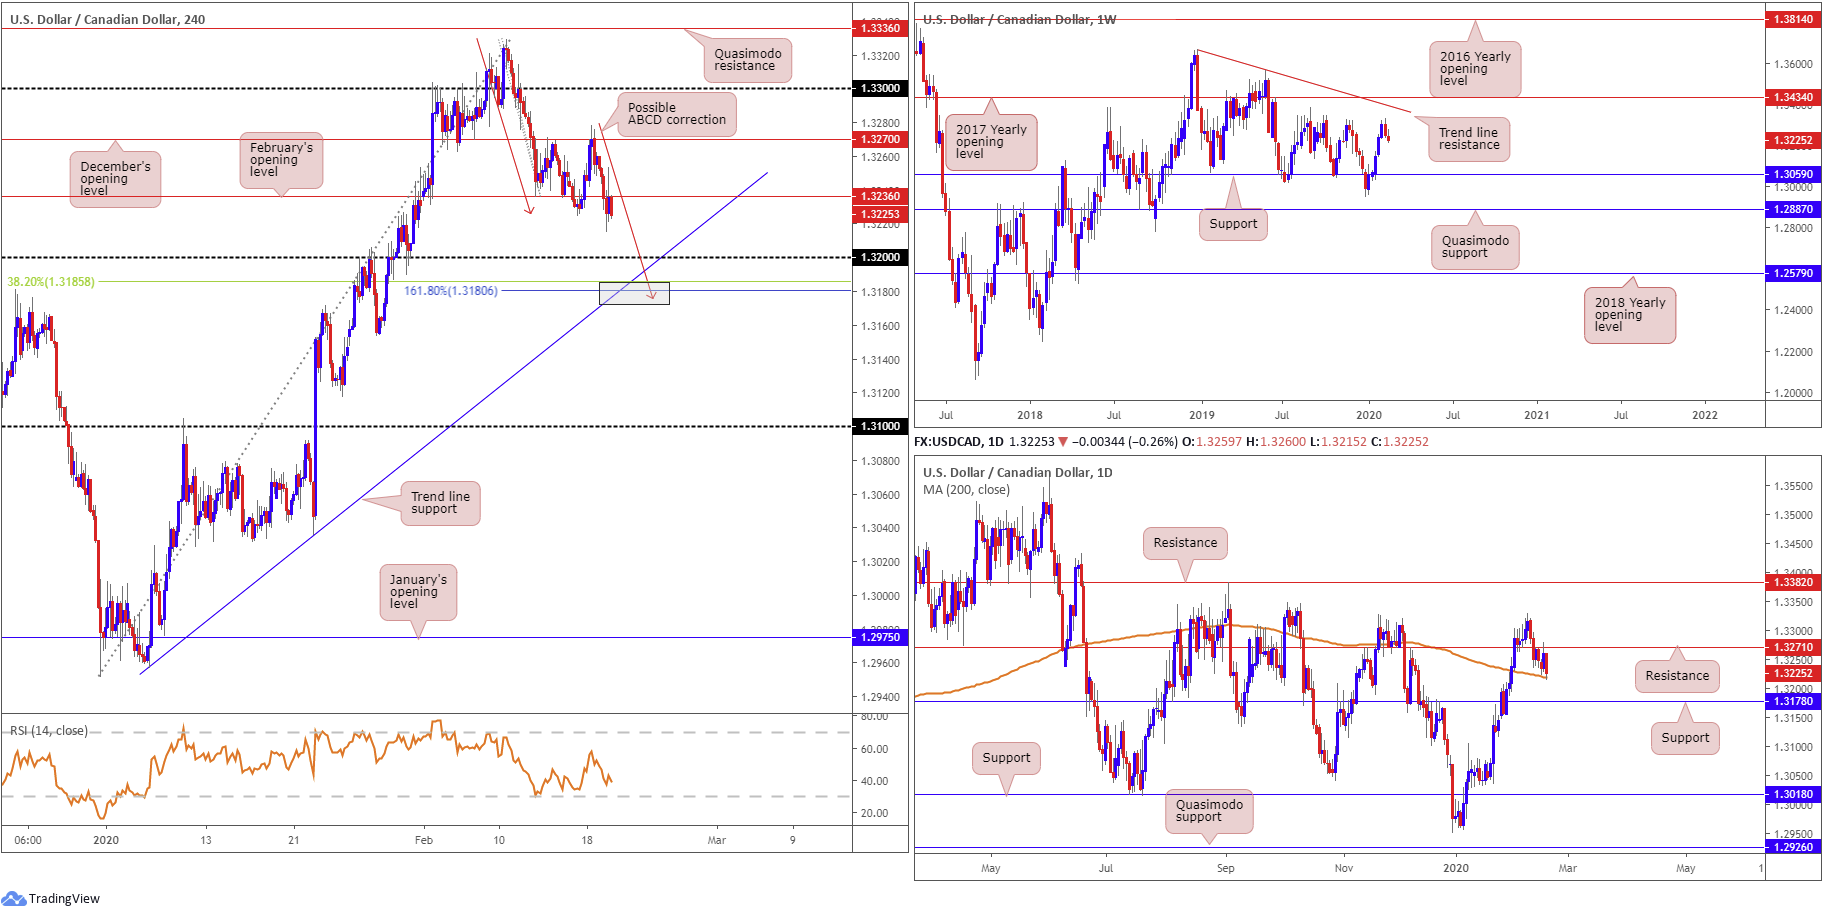
USD/CAD:
The US dollar smothered Tuesday’s gains against the Canadian dollar Wednesday, down more than 30 points, or 0.24%. Despite broad-based USD strength, WTI gained in excess of 2.00%, capping USD strength and weighing on USD/CAD into the close. On the data front, the Consumer Price Index (CPI) rose 2.4% on a year-over-year basis in January, up from a 2.2% gain in December. Excluding gasoline, the CPI rose 2.0% in January (Statistics Canada).
Technically speaking, February’s opening level at 1.3236 gave way and is, as of writing, holding as resistance. The move exposed 1.32 on the H4 timeframe, though also shined the spotlight on a possible 161.8% ABCD (red arrows) correction, terminating south of the round number at 1.3180. Also worthy of note is the closely converging trend line support, etched from the low 1.2957 and a 38.2% Fibonacci retracement at 1.3185 (grey zone).
Further afield, we can see weekly price remains pretty much unchanged, in terms of structure. Price halted just south of tops around 1.3340 last week. Additional resistance resides at a trend line formation (1.3661) and the 2017 yearly opening level at 1.3434. Support can be found around the 1.3059 neighbourhood.
Price action on the daily timeframe recently overthrew support at 1.3271 and retested the level as resistance on Tuesday. The unit challenged the 200-day SMA (orange – 1.3218) as potential support Wednesday, with a break perhaps unlocking the trapdoor to a well-rounded support from 1.3178.
Areas of consideration:
For traders who read Wednesday’s technical briefing you may recall the following:
Owing to yesterday’s response off December’s opening level at 1.3270 on the H4 and from daily resistance at 1.3271, a break south of February’s opening level at 1.3236 may excite intraday selling today, targeting 1.32 and the H4 ABCD correction around 1.3180. However, caution to the downside is warranted knowing the 200-day SMA, currently circling the 1.3219ish region, could also offer support.
Sellers have shown interest beneath February’s opening level, but with the 200-day SMA entering the fight, downside could be hampered.
In the event we do continue lower, buying opportunities off 1.3180ish are likely on the watchlists; however, most will want to view a close back above 1.32 before committing.
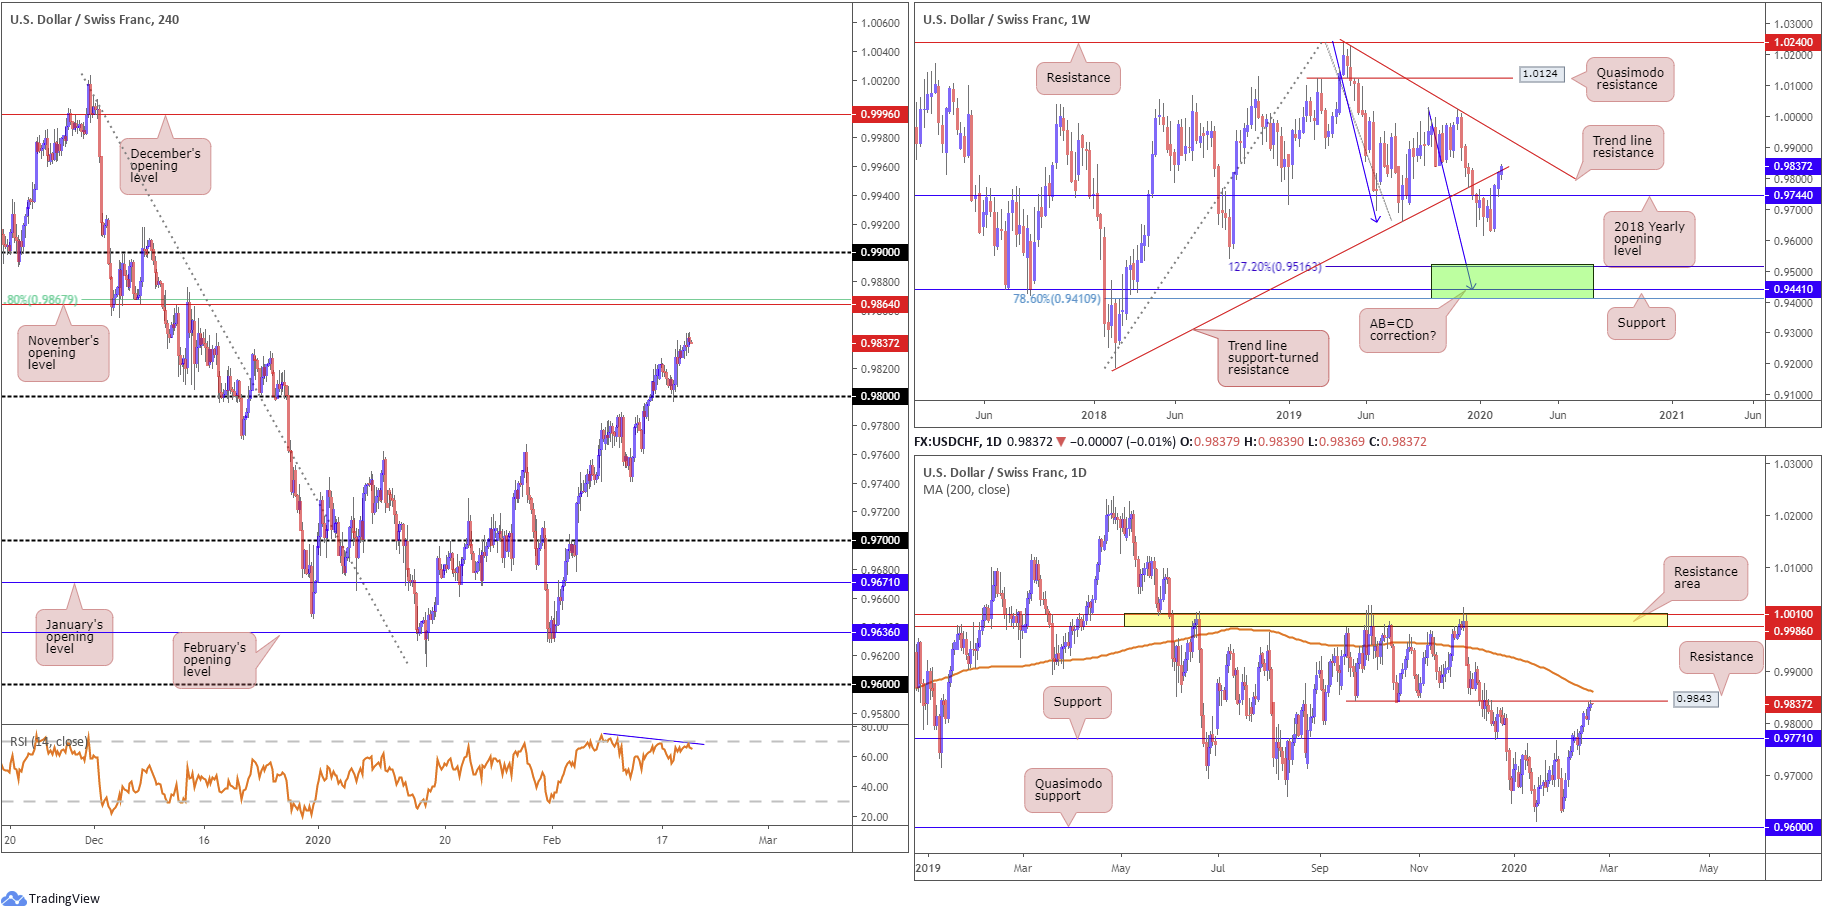
USD/CHF:
USD/CHF modestly built on Tuesday’s upside Wednesday, extending recovery gains off the 0.98 retest, based on the H4 timeframe.
From the weekly timeframe, traders can see the trend line support-turned resistance, drawn from the low 0.9187, is under pressure. Trend line resistance, etched from the high 1.0236, is next in line in terms of long-term resistance targets.
On to the daily timeframe, broad-based USD bidding lifted the pair to resistance at 0.9843 yesterday, positioned a few points beneath the 200-day SMA (orange – 0.9863). This follows last week’s break of resistance at 0.9771, now a serving support base. Continued bidding through the said resistances may encourage additional US dollar upside to a resistance area coming in at 1.0010/0.9986.
Back to the H4 timeframe, the next port of call, with respect to resistances can be seen at November’s opening level from 0.9864. What’s interesting is this level also comes with a 61.8% Fibonacci retracement at 0.9867 and the said 200-day SMA on the daily timeframe. Indicator-based traders may also wish to acknowledge we still view the relative strength index (RSI) as producing bearish divergence (blue level).
Areas of consideration:
Traders long the 0.98 retest on the H4 timeframe have likely reduced risk to breakeven after price tested daily resistance at 0.9843. Ultimately, though, the next upside target on the H4 timeframe rests at 0.9864.
Not only is 0.9864 an upside target for any longs in this market, the level represents a potential sell zone. Aligning closely with the 200-day SMA and a H4 61.8% Fibonacci retracement, a pullback from here is considered high probability, targeting at least 0.9830ish as the initial downside base, followed by 0.98.
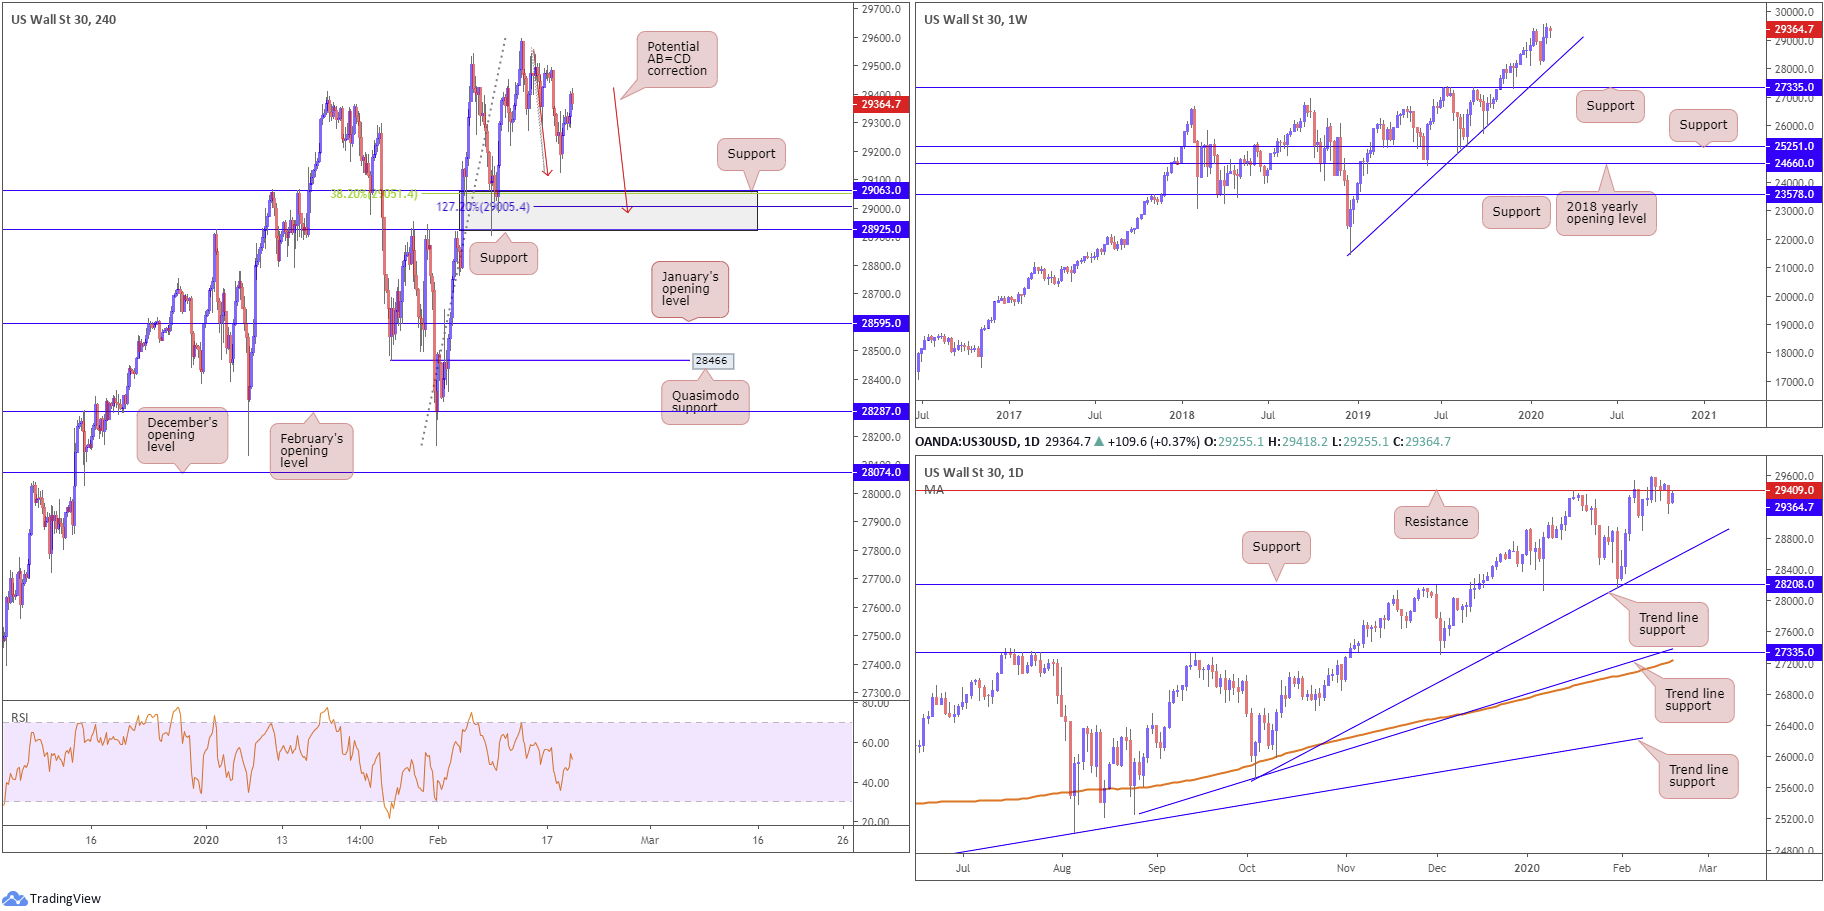
Dow Jones Industrial Average:
Major US benchmarks shook off their latest virus-induced loss and recovered ground, with the Nasdaq 100 leading the way Wednesday. The Dow Jones Industrial Average added 115.84 points, or 0.40%; the S&P 500 gained 15.87 points, or 0.47% and the tech-heavy Nasdaq 100 ended higher by 88.92 points, or 0.92%.
Technical developments on the H4 timeframe remain focused on a support area coming in at 28925/29063 (grey), which houses a 38.2% Fibonacci value at 29051. Recent activity also underlined a possible 127.2% AB=CD (red arrows) correction at 29005. South of 28925/29063, January’s opening level at 28595 is in the offing, as is Quasimodo support at 28466.
Further out, the weekly candles remain in a healthy position north of trend line support, taken from the low 21452. Outside of the aforementioned trend line, support rests at 27335.
Closer analysis of price on the daily timeframe has current action retesting the lower boundary of a recently broken support at 29409. Should sellers strengthen their grip, trend line support, extended from the low 25710, may enter view, with a break possibly clearing the pathway to support coming in at 28280. Yet, a jump back through the said level may be interpreted as an early cue we’re heading to all-time highs at 29595.
Areas of consideration:
In the event daily price holds south of resistance at 29409, this will likely guide H4 candles to the support area at 28925/29063 which represents a reasonably solid buy zone.
Traders who feel threatened by the fact the daily timeframe shows room to push through the current H4 support zone could seek further confirmation before pulling the trigger. This could be something as simple as a bullish candlestick signal, to a more complex harmonic bullish pattern on the lower timeframes. It’s trader dependent.
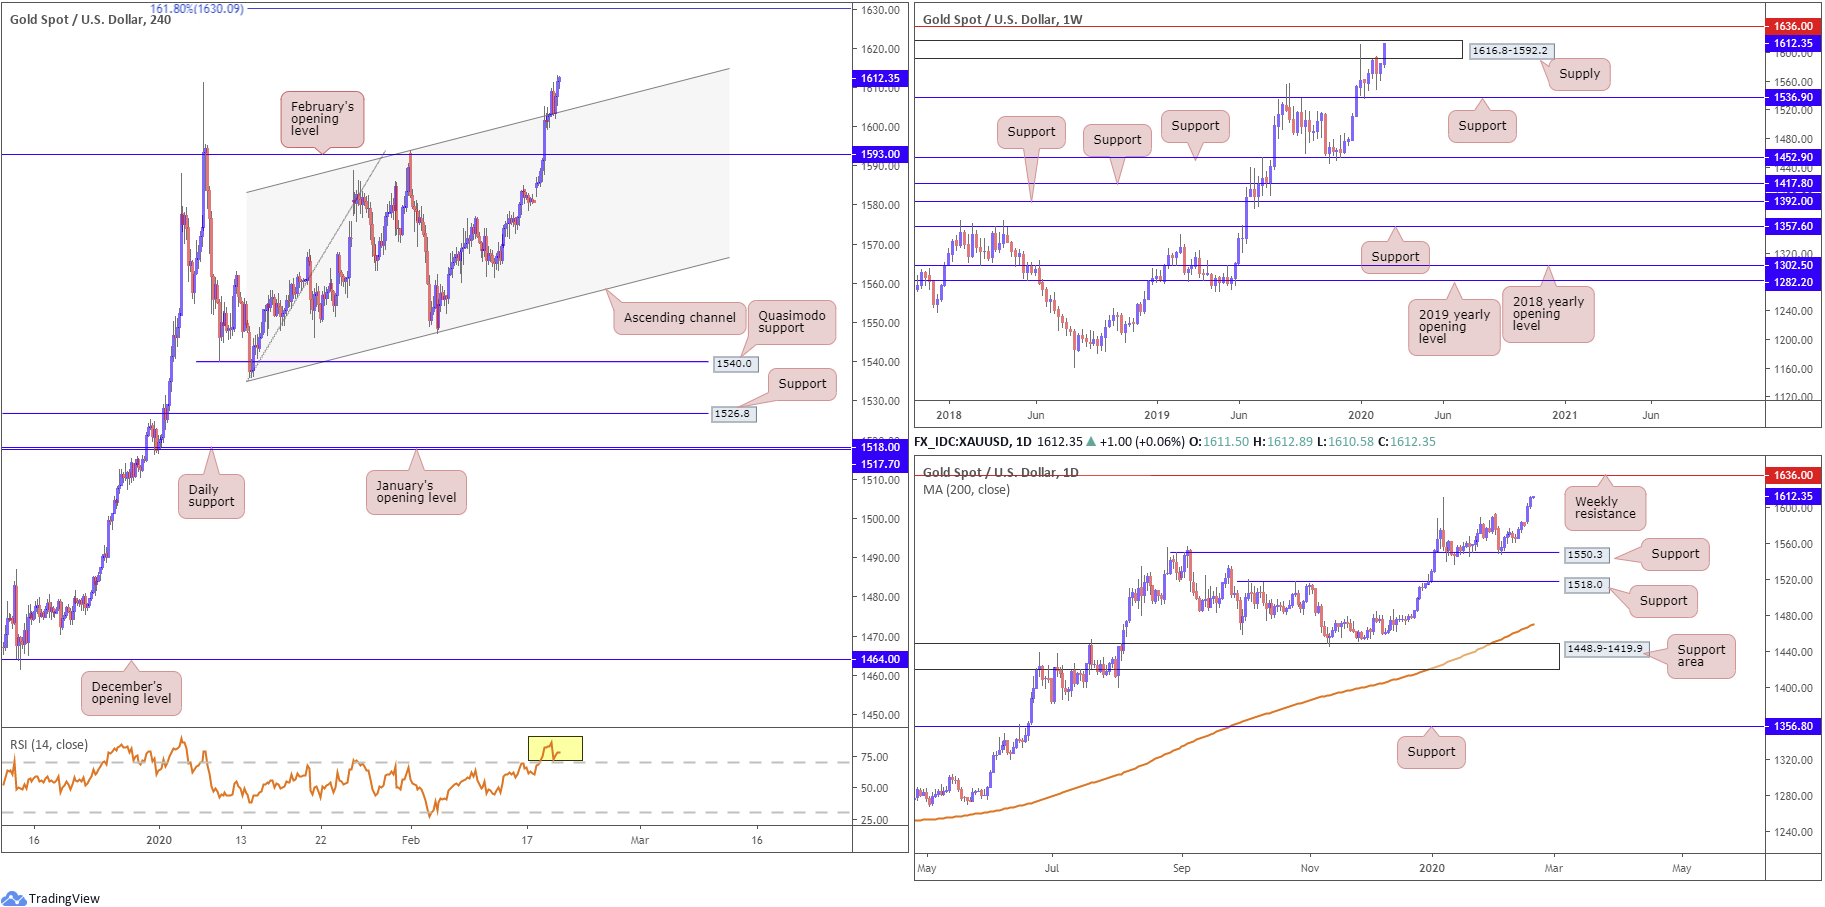
XAU/USD (GOLD):
Despite XAU/USD spot recording its second successive gain Wednesday and clocking levels not seen since 2013, momentum moderately slowed. Reasonably healthy USD bidding is likely weighing on bullion, as is the positive shift in risk perception across US equity benchmarks.
The technical picture on the weekly timeframe has price lodged within the upper limit of supply at 1616.8-1592.2, with price poised to rupture the top edge of the zone and draw in nearby resistance at 1636.0.
Closer analysis of price movement on the daily timeframe places the yellow metal marginally north of the 1611.3 January 8th high, exposing the resistance level on the weekly timeframe at 1636.0.
Activity on the H4 timeframe recently firmed above channel resistance, taken from the high 1593.9, and retested the ascending line as support. A continuation to the upside from here has a 161.8% Fibonacci extension point to target at 1630.0, sited just a few points south of the weekly resistance highlighted above at 1636.0.
Areas of consideration:
With weekly supply having its upper limits tested, and the primary trend strongly facing north, longs off the current H4 channel support could be an option today, targeting the 161.8% Fibonacci extension point at 1630.0. Aggressive trade management is recommended, however; weekly sellers may still reside within the current supply zone – getting caught on the wrong side of this could be horrid.
The accuracy, completeness and timeliness of the information contained on this site cannot be guaranteed. IC Markets does not warranty, guarantee or make any representations, or assume any liability regarding financial results based on the use of the information in the site.
News, views, opinions, recommendations and other information obtained from sources outside of www.icmarkets.com.au, used in this site are believed to be reliable, but we cannot guarantee their accuracy or completeness. All such information is subject to change at any time without notice. IC Markets assumes no responsibility for the content of any linked site.
The fact that such links may exist does not indicate approval or endorsement of any material contained on any linked site. IC Markets is not liable for any harm caused by the transmission, through accessing the services or information on this site, of a computer virus, or other computer code or programming device that might be used to access, delete, damage, disable, disrupt or otherwise impede in any manner, the operation of the site or of any user’s software, hardware, data or property.


