
Key risk events today:
Swiss banks are closed in observance of Swiss National Day; UK Manufacturing PMI; BoE Inflation Report; MPC Official Bank Rate Votes, Monetary Policy Summary and Official Bank Rate; UK Asset Purchase Facility; MPC Asset Purchase Facility Votes; BoE Gov Carney Speaks; US ISM Manufacturing PMI.
EUR/USD:
Wednesday witnessed the Federal Reserve slash interest rates by 25bps – the market had been pricing in a small chance of a 50bps cut – consequently lifting the US dollar index to highs of 98.68, levels not seen since May 2017. Despite the Fed cutting rates, an action that would normally contribute to dollar weakness, the dollar strengthened. Desks justified the move due to the cut being supportive of global growth, where the dollar would likely benefit. Among other things, during the press conference Powell stated the central bank would never move rates because of political factors or to prove its independence.
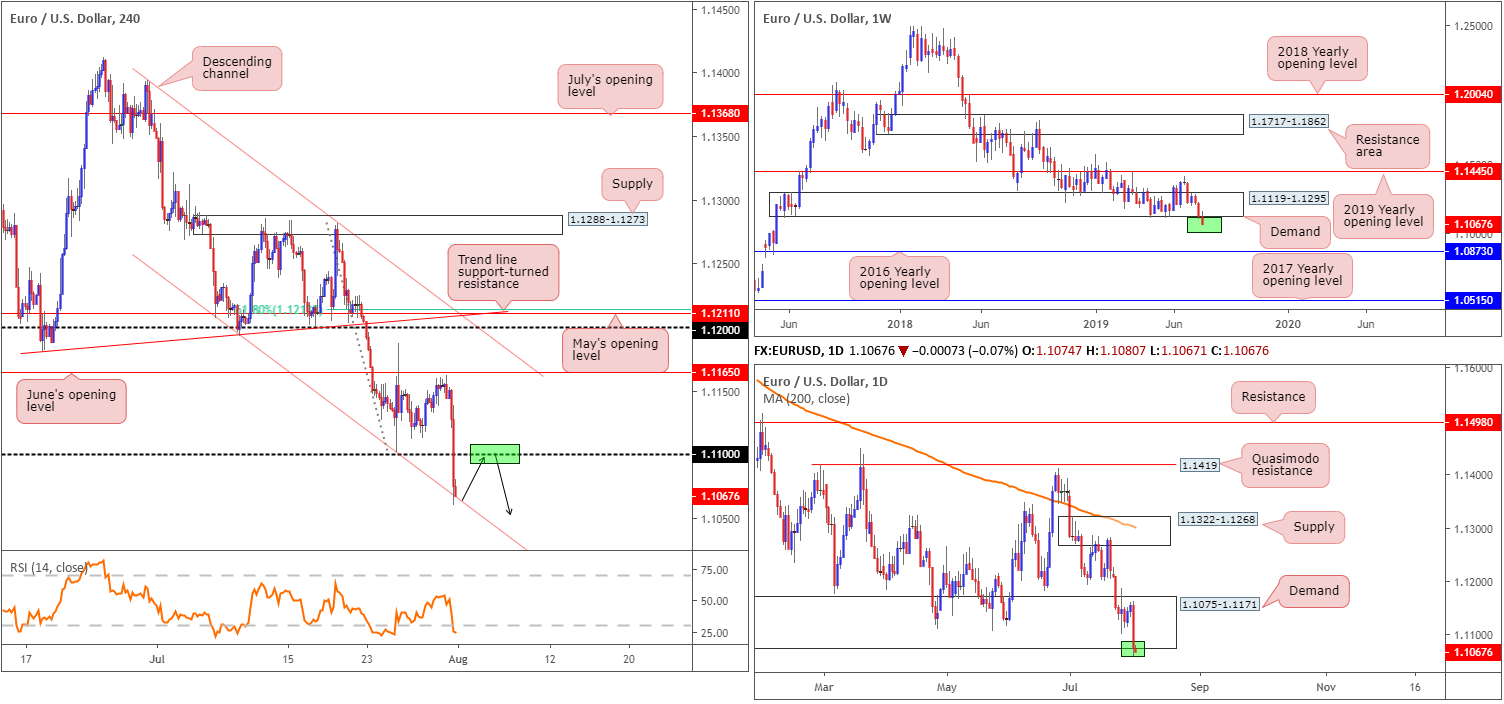
Recent movement, according to the technical studies, has left the EUR/USD in a vulnerable position. From the weekly timeframe, we can see price action tripping long-term sell stops beneath demand at 1.1119-1.1295. In the event further selling is observed, the 2016 yearly opening level at 1.0873 (support) is next in the firing range.
In conjunction with weekly flow, daily price also clipped the lower edge of a demand area coming in at 1.1075-1.1171, an area seen hugging the underside of the current weekly demand zone. Further downside from here this week may entail making a run for demand at 1.0860-1.0954 (not seen on the screen).
A closer reading of price action on the H4 timeframe saw the candles dip their toes beneath 1.11, which, as you can see, cleared the path towards channel support extended from the low 1.1207. Considering both weekly and daily timeframes engulfing long-standing demand areas, the response from the aforementioned channel support is likely to be limited, with the next support target set around the 1.10 handle (not visible on the screen).
Areas of consideration:
In view of recent moves, two scenarios could potentially play out:
- A reaction from the H4 channel support is observed which allows the candles to retest 1.11. Coupled with a H4 bearish candlestick configuration (entry and risk can be determined according to this structure) and the position of higher-timeframe price (see above), a short from here targeting 1.10 appears a reasonable possibility.
- Failure to advance off the aforementioned H4 channel support will lead to a H4 close lower. This, by and of itself, is a signal to sell in the direction of 1.10, be it using the breakout candle itself or waiting for the retest to occur and attempting to enter on the back of the retesting candle’s structure.
GBP/USD:
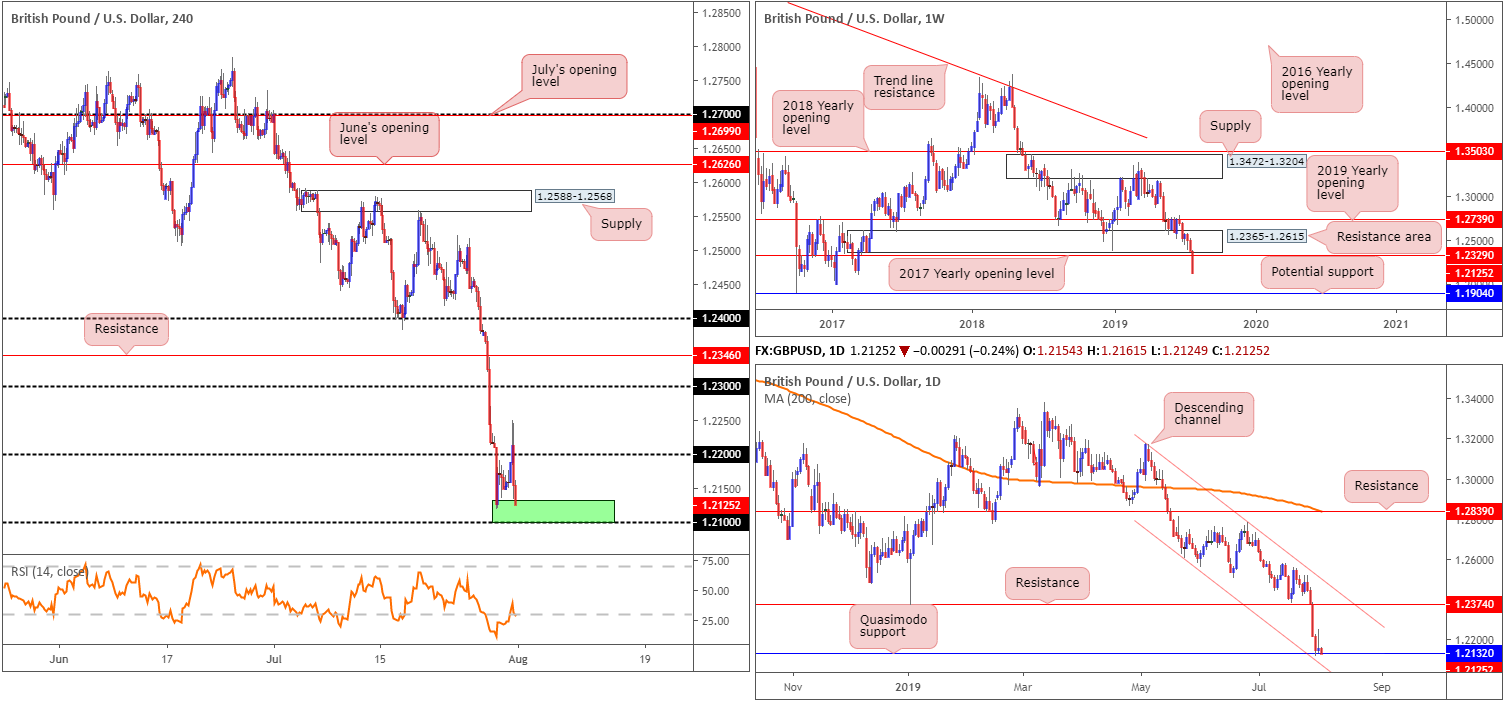
A robust H4 close back beneath 1.22, despite clocking highs of 1.2249 Wednesday, sidelined hopes of a GBP recovery. The US dollar firmed up following a less-dovish than anticipated US Fed, despite slashing interest rates by 25bps.
Technically, this positions the H4 candles just north of the 1.21 handle.
On the weekly timeframe, price action suggests further losses could be in store. The current weekly candle is establishing ground beneath its 2017 yearly opening level at 1.2329, with limited support visible on this timeframe until 1.1904, a standout low clocked in early October of 2016. The story on the daily timeframe has price testing Quasimodo support at 1.2132, which happens to converge closely with a channel support extended from the low 1.2605.
Areas of consideration:
For traders who read yesterday’s briefing you may recall the piece had the following to say regarding a possible bounce higher:
Although concerns surrounding Brexit are weighing on the pair right now, the space between the 1.21 handle on the H4 timeframe and the daily Quasimodo support at 1.2132/channel support extended from the low 1.2624 (green zone) is interesting for a possible bounce higher today. To be on the safe side, traders are urged to wait and see if the H4 candles chalk up a bullish candlestick signal out of 1.21/1.2132 prior to pulling the trigger (entry and risk levels can be determined according to the candlestick’s structure), targeting 1.22 as the initial take-profit zone.
Should price continue southbound:
Should the unit continue pressing lower and take out 1.21, as the weekly timeframe suggests, a sell either on the breakout or a retest could also be an idea, targeting daily Quasimodo support at 1.2037, followed by key figure 1.20 (not visible on the screen).
AUD/USD:
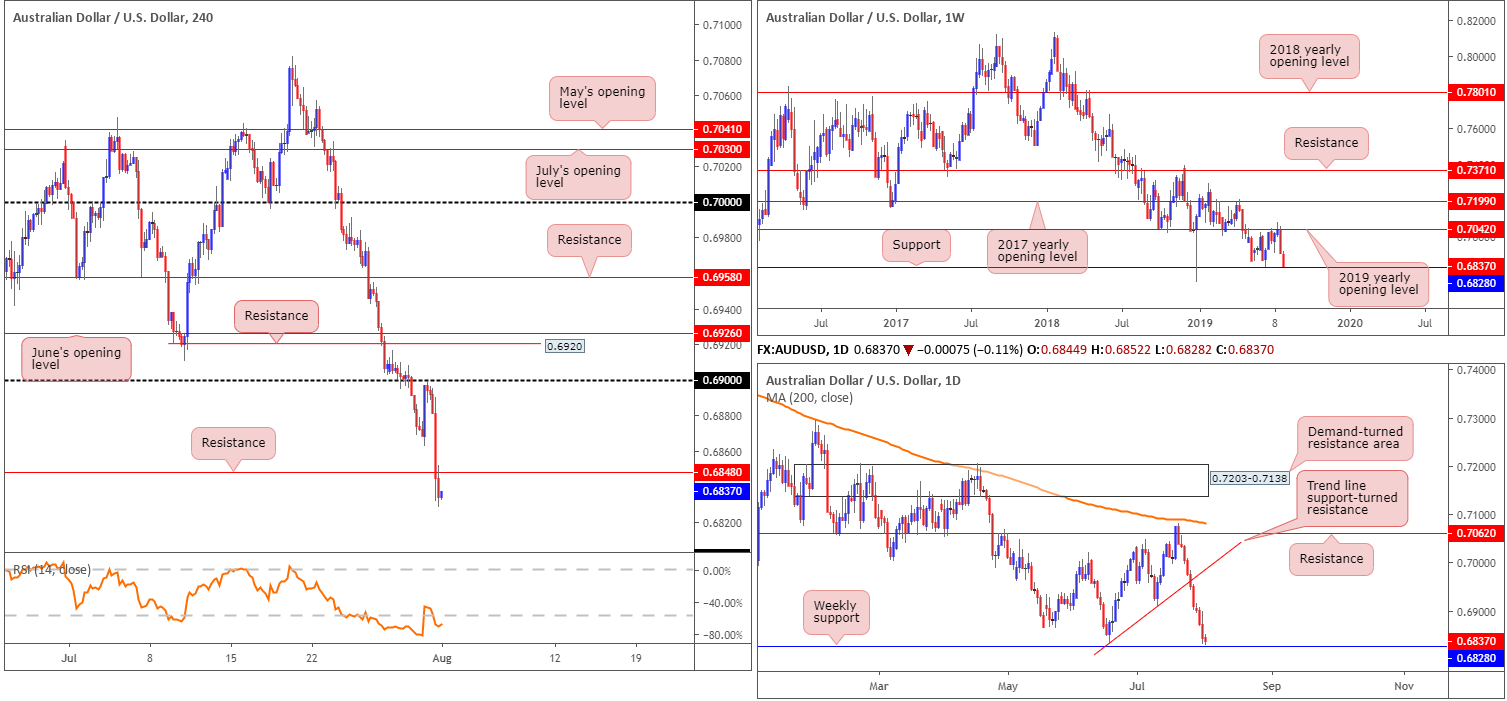
Following a to-the-point retest at 0.69, the Australian dollar fell sharply against the US dollar Wednesday, influenced by the Federal Reserve slashing interest rates by 25bps. As highlighted in the EUR/USD analysis, despite the Fed cutting rates, an action that would normally contribute to dollar weakness, the dollar strengthened. Desks justified the move due to the cut being supportive of global growth, where the dollar would likely benefit. Among other things, during the press conference Powell stated the central bank would never move rates because of political factors or to prove its independence.
While recent selling has likely excited momentum traders, particularly after crunching beneath H4 support at 0.6848 (now acting resistance), traders are urged to tread carefully. This is due to higher-timeframe price inching its way towards notable support coming in at 0.6828, a barrier that’s offered strong support and resistance since June 2003.
Areas of consideration:
Owing to weekly support meandering close by at 0.6828, shorting this market is chancy. Those looking for countertrend trades off the noted weekly support, however, may opt to wait and see if a H4 close can form back above H4 resistance at 0.6848. This helps confirm buyer intent, likely unlocks the door towards to 0.69 as an initial target and provides structure to base entry and risk from using the breakout candle.
USD/JPY:
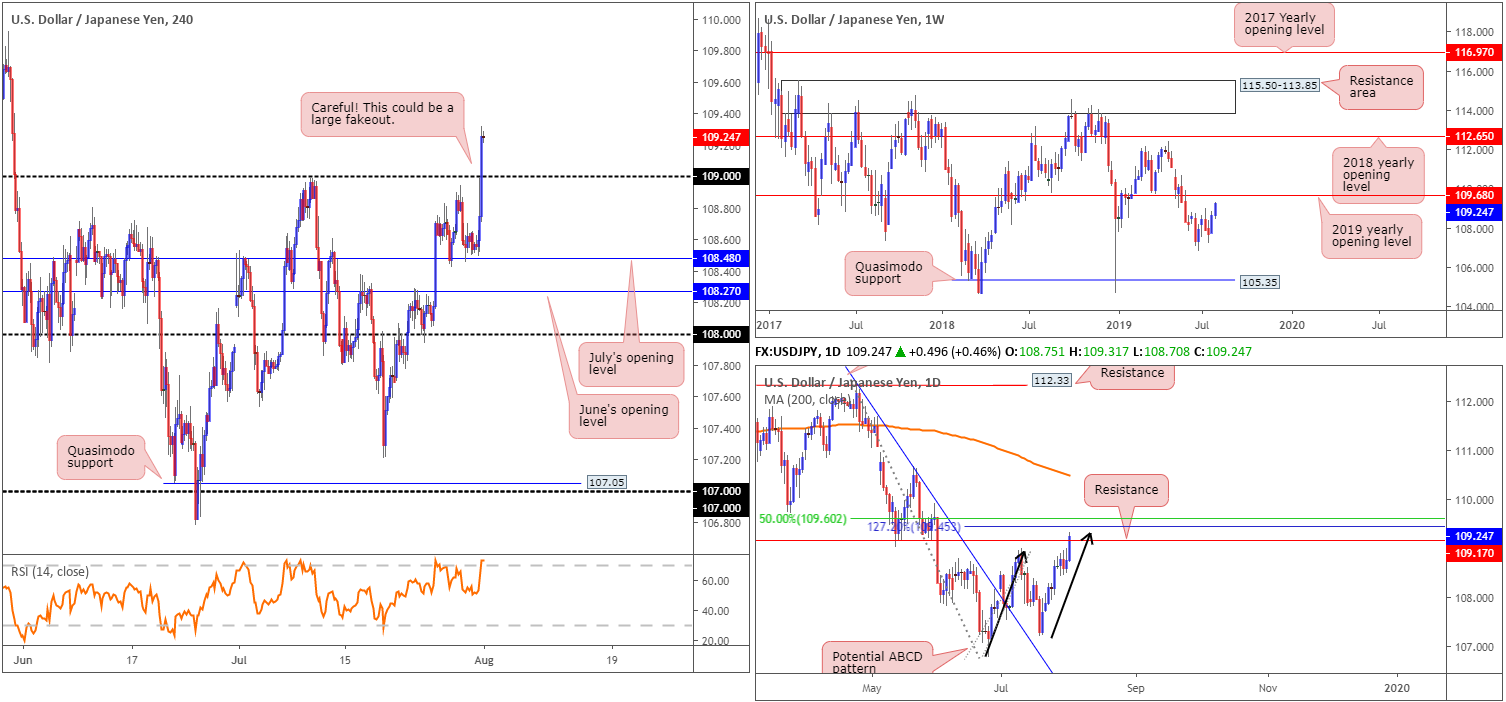
On the back of recent Fed movement, the US dollar benefitted, lifting the USD/JPY pair beyond 109 in strong fashion. Although considered a bullish indicator and likely has traders buying the breakout, trouble may be on the horizon.
Extracted from Wednesday’s briefing:
Weekly price has the 2019 yearly opening level at 109.68 offering viable resistance this week. Daily price, on the other hand, houses resistance at 109.17, which comes together with a nearby 127.2% ABCD (black arrows) bearish formation at 109.45 and a 50.0% retracement value at 109.60. This, alongside the 2019 yearly opening level at 109.68 on the weekly timeframe, forms a reasonably tight area of resistance to focus on (109.17/109.68).
Areas of consideration:
Having seen 109.68/109.17 denote a strong area of resistance, longer-term sellers may look to make an appearance here. Traders interested in this zone may opt to wait and see if a H4 close beneath 109 takes shape before pulling the trigger. Not only does this help confirm seller intent, it unlocks the door to H4 support at 108.48 (July’s opening level) and provides entry and risk parameters based on the breakout candle’s structure.
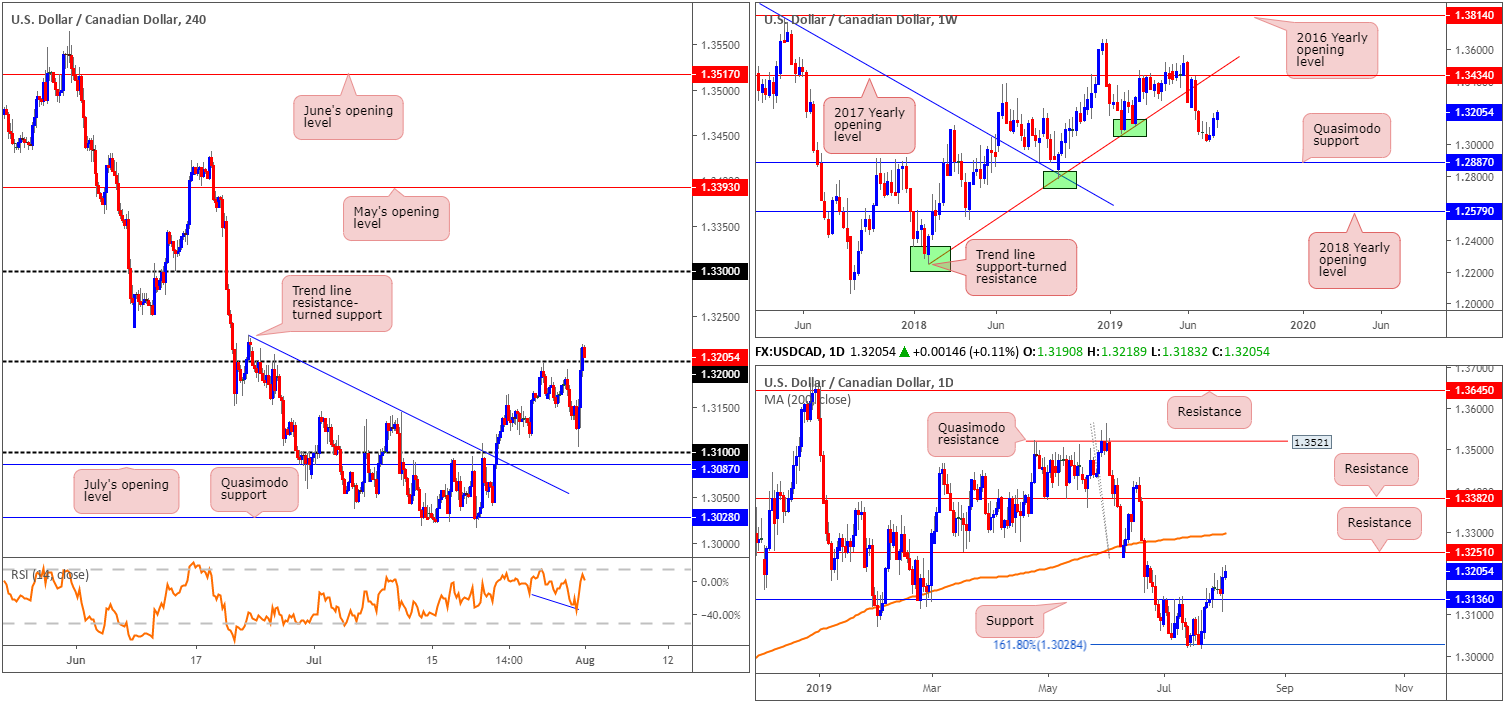
USD/CAD:
The US dollar continued to explore higher ground Wednesday as traders cheered the Fed’s not-so-dovish cut. This – coupled with WTI turning south – propelled the USD/CAD higher and overthrew the 1.32 handle by the day’s end. With buy stops likely filled above this figure, the market may observe another wave of buying materialise towards daily resistance drawn from 1.3251, closely followed by a potential move to the 1.33 handle.
Areas of consideration:
Keeping it simple this morning, a long could be something to consider should the H4 candles retest 1.32 as support, preferably in the shape of a bullish candlestick signal (entry and risk can be determined according to its structure). As underlined above, the first take-profit target can be set at daily resistance (1.3251), followed by 1.33 on the H4 timeframe.
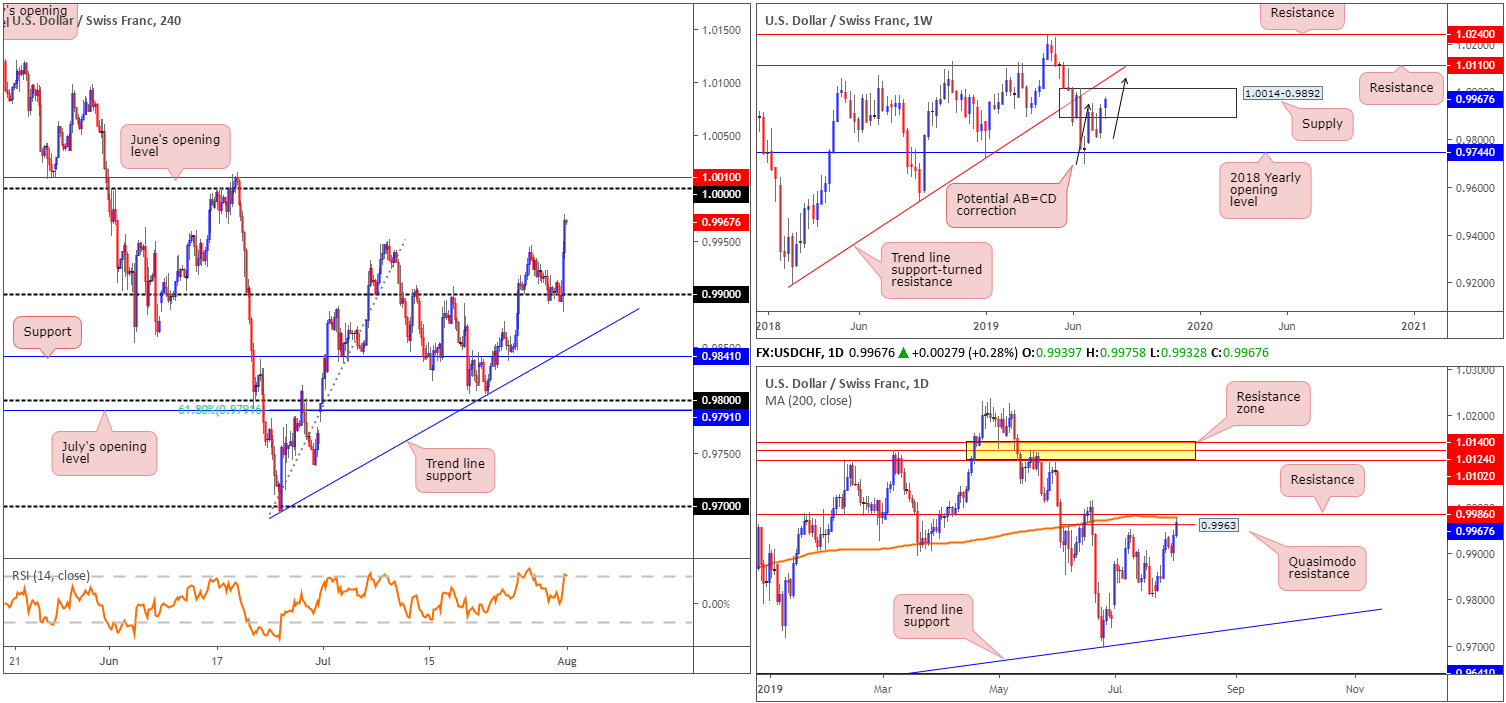
USD/CHF:
Immediately following the Federal Reserve slashing interest rates by 25bps Wednesday, the USD/CHF advanced northbound, clocking levels not seen since mid-June. Technically speaking, the 0.99 handle on the H4 timeframe held steady and provided a platform for buyers to enter the market. According to the H4 scale, further buying is possible, targeting 1.0000 (parity), which happens to be closely shadowed by June’s opening level at 1.0010.
Before reaching 1.0000, though, traders must contend with potential resistance on the daily timeframe. This forms by way of a Quasimodo resistance at 0.9963, the 200-day SMA (currently trading around 0.9978) and resistance coming in at 0.9986. It might also be worth noting weekly price remains within the walls of a supply zone at 1.0014-0.9892, though so far price action is probing higher and might eventually break north to complete an AB=CD pattern around 1.0055 (merges with trend line support-turned resistance taken from the low 0.9187).
Areas of consideration:
While many traders will be eyeing 1.0000 for potential selling opportunities/take-profit targets today, we know there’s a chance price action may turn lower before reaching this figure, given daily action engaging with a resistance area at 0.9986/0.9963. In cases such as these, it’s always best to let price action lead the way: wait and see if/where a bearish candlestick pattern forms. This not only helps identify seller intent it also provides a structure to base entry and risk levels from.
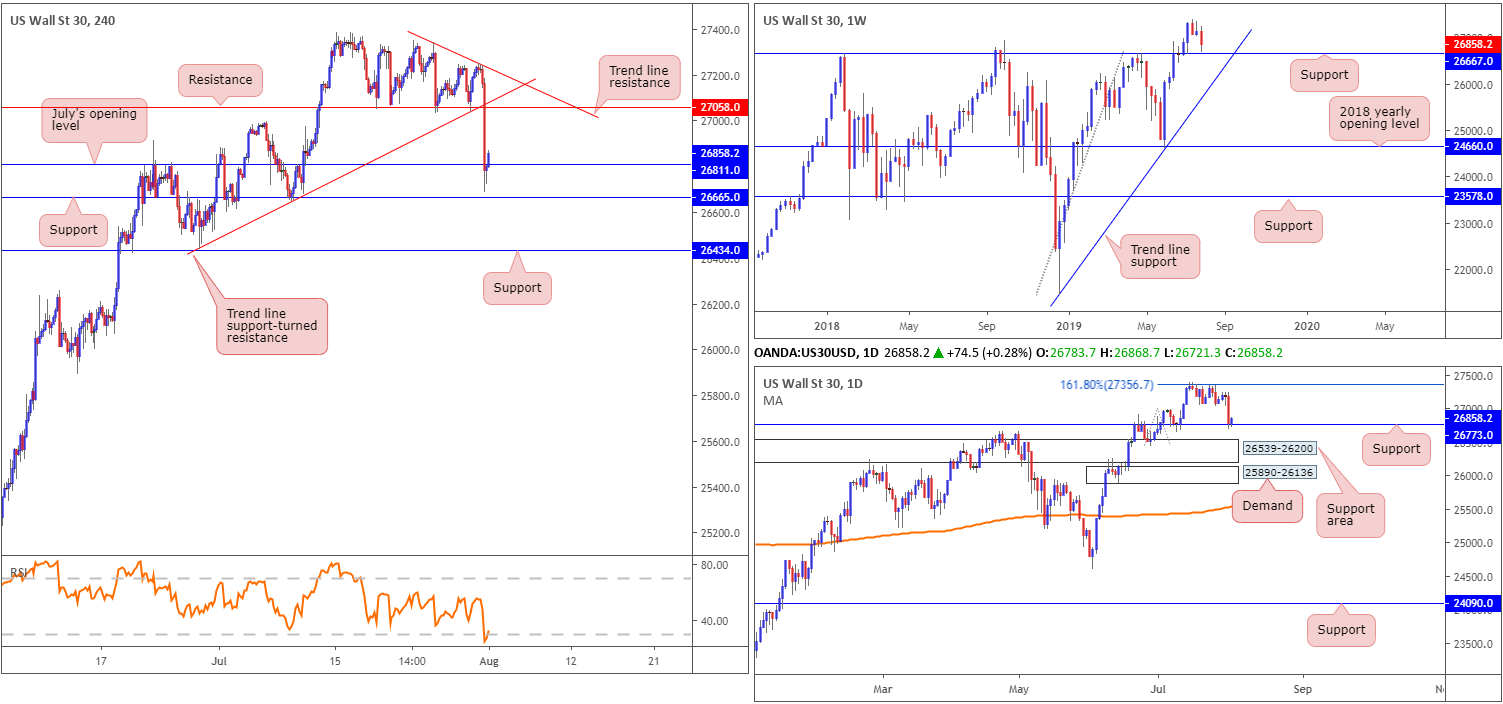
Dow Jones Industrial Average:
US stock indexes closed sharply lower Wednesday after the Federal Reserve signalled caution on future interest-rate cuts shortly after the central bank lowered rates by 25bps for the first time in a decade. The Dow Jones Industrial Average erased 333.75 points, or 1.23%; the S&P 500 lost 32.80 points, or 1.09% and the Nasdaq declined 103.69 points, or 1.30%.
According to the H4 timeframe this morning, price action is attempting to print a recovery back above July’s opening level drawn from 26811. This is after marginally surpassing the level and coming within a few points of connecting with support at 26665. Further buying from this point has resistance at 27058 to target, which happens to merge close by a trend line resistance taken from the high 27341.
On more a broader perspective, however, daily support entered the mix yesterday at 26773, after spending the last couple of weeks trying to dethrone resistance (161.8% Fibonacci ext.) at 27356. In addition to this, it might also be worth noting weekly price is meandering just north of support coming in at 26667.
Areas of consideration:
Should the current H4 candle close as is: strongly above July’s opening level at 26811, a long on the close of this candle with a protective stop-loss order planted beneath its tail could be an option. This trade, as highlighted above, has the backing of daily support at 26773, with the initial take-profit zone set at H4 resistance 27058.
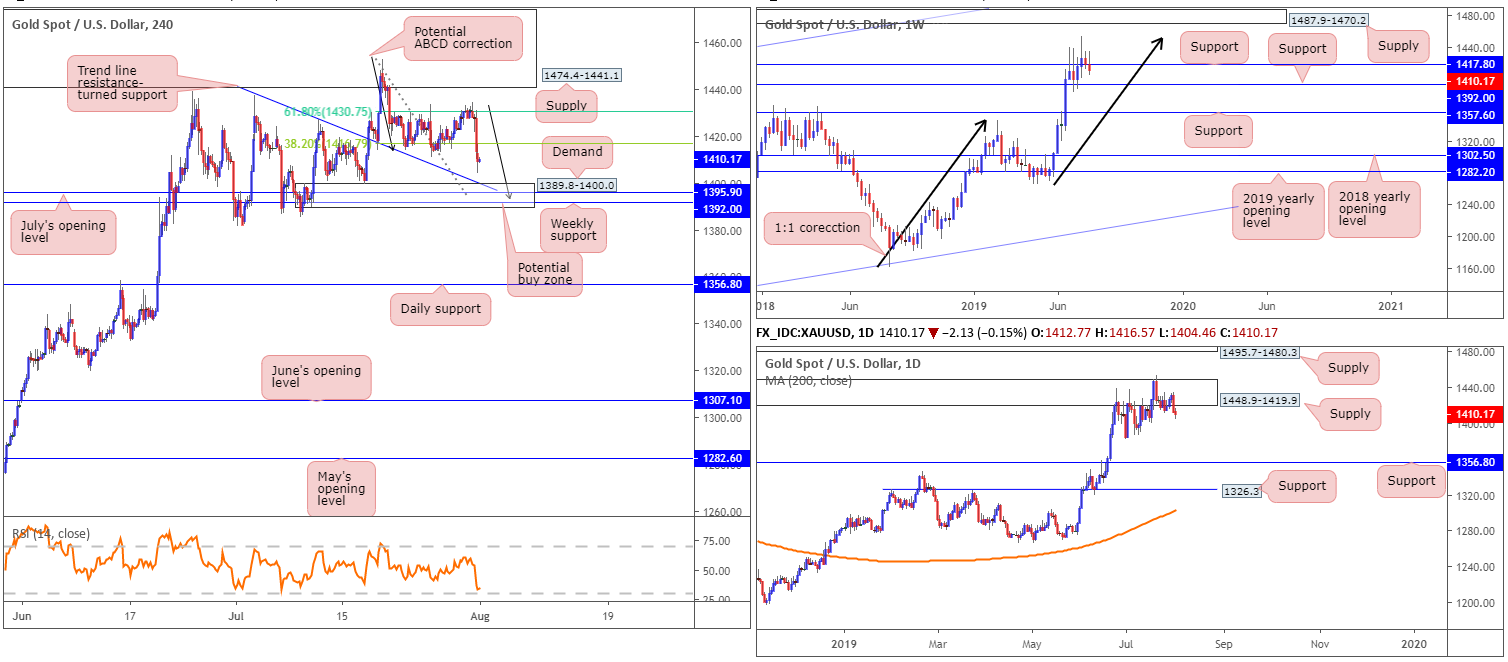
XAU/USD (GOLD):
Bullion spun off into a phase of selling Wednesday, weighed on by a robust US dollar following the not-so-dovish Fed rate cut.
Consequent to recent selling, weekly price is trading south of support at 1417.8, potentially eyeing a run to another layer of support nearby at 1392.0. The technical landscape on the daily timeframe continues to air a bearish vibe following a break of the top edge of a supply zone at 1448.9-1419.9 in recent trading. While this move was likely enough to trip a portion of the stop-loss orders, it’s unlikely to have cleared the path north to supply at 1495.7-1480.3, given the follow-through selling that has emerged. As for downside targets on this scale, the research team notes to be aware of the 1381.9 July 1 low, followed by support at 1356.8.
H4 traders may wish to acknowledge since crossing swords with a rather large supply zone at 1474.4-1441.1, the price of gold has been gradually declining against the US dollar. In terms of neighbouring support, we have trend line resistance-turned support (extended from the high 1437.7) merging with a striking area of demand coming in at 1389.8-1400.0. Within this zone, July’s opening level at 1395.5 resides as support, as well as weekly support underlined above at 1392.0. What’s also notable is a potential ABCD (black arrows) correction that terminates within the demand’s walls around 1393.6.
Areas of consideration:
H4 demand highlighted above at 1389.8-1400.0 is in focus today for possible long opportunities, thanks to the local and higher-timeframe confluence it brings with it. Entry can be found at the top edge of the zone around 1400.0, with protective stop-loss orders positioned just beneath the lower edge at around 1388.6. As for the first take-profit target, traders may wish to take the 38.2% of legs A-D (a common technique using the ABCD formation), followed by the 61.8% value (always best to let the D leg complete first, however).
The accuracy, completeness and timeliness of the information contained on this site cannot be guaranteed. IC Markets does not warranty, guarantee or make any representations, or assume any liability regarding financial results based on the use of the information in the site.
News, views, opinions, recommendations and other information obtained from sources outside of www.icmarkets.com.au, used in this site are believed to be reliable, but we cannot guarantee their accuracy or completeness. All such information is subject to change at any time without notice. IC Markets assumes no responsibility for the content of any linked site.
The fact that such links may exist does not indicate approval or endorsement of any material contained on any linked site. IC Markets is not liable for any harm caused by the transmission, through accessing the services or information on this site, of a computer virus, or other computer code or programming device that might be used to access, delete, damage, disable, disrupt or otherwise impede in any manner, the operation of the site or of any user’s software, hardware, data or property.


