
Key risk events today:
RBA Gov Lowe Speaks; SNB Monetary Policy Assessment and Policy Rate; Philly Fed Manufacturing Index.
(Previous analysis as well as outside sources – italics).
EUR/USD:
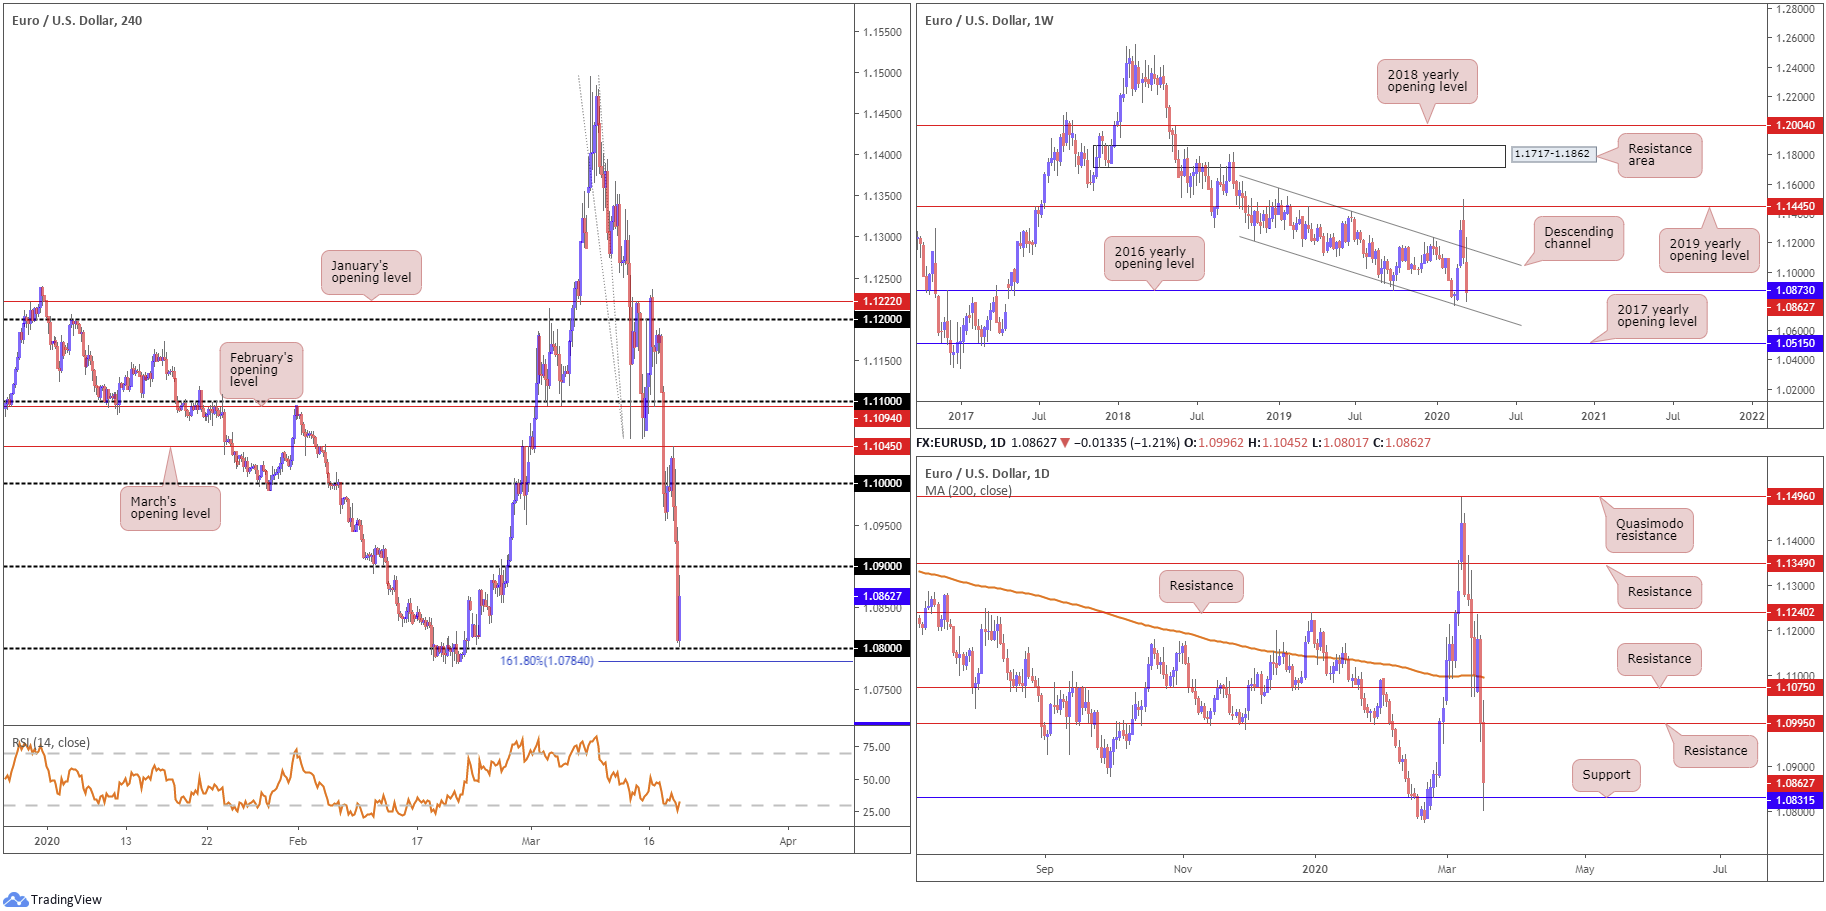
The euro ceded further ground against the US dollar Wednesday, shedding more than 100 points. The US dollar index, or DXY, remained on the offensive, reaching highs at 101.74, levels not seen since March 2017.
Thanks to the recent slide, weekly support at 1.0873, the 2016 yearly opening level, made an appearance, sited just north of channel support, extended from the low 1.1215. Note the primary trend, seen clearly on the weekly timeframe, has drifted south since 2018.
Daily flow, on the other hand, crossed paths with support priced in at 1.0831, a level extended from May 2015. Resistance stands at 1.0995 on the daily timeframe, followed by another layer of resistance at 1.1075. Traders will also note the 200-day SMA (orange – 1.1096) marginally turned south after flattening at the beginning of March.
Across the page on the H4 timeframe, price action extended its position south of the widely watched key figure 1.10 yesterday, overthrowing 1.09 and coming within striking distance of the 1.08 handle and a 161.8% Fibonacci extension point at 1.0784. It might also interest some traders to note the relative strength index (RSI) dipped within oversold waters, though has since mildly recovered and is showing signs of exiting for higher ground.
Areas of consideration:
Technically, there’s a lot of pain in this market right now. After forming a higher peak at 1.1495, some likely viewed this as bullish confirmation and have been attempting longs throughout the recent corrective slide. With price now testing the origin of the move higher, essentially around the 1.08 region. A move beneath 1.08 will potentially finish most long positions.
As for possible scenarios going forward, buyers are likely making a last-ditch attempt off 1.08ish, knowing weekly support is in motion at 1.0873 and daily support made a show at 1.0831. A H4 close above 1.09 will help confirm buyer intent, targeting daily resistance at 1.0995. Irrespective of the entry technique off 1.08, though, traders likely view the 1.0777 February 20th low as the cut-off point, therefore this is where most protective stop-loss orders will be positioned.
GBP/USD:
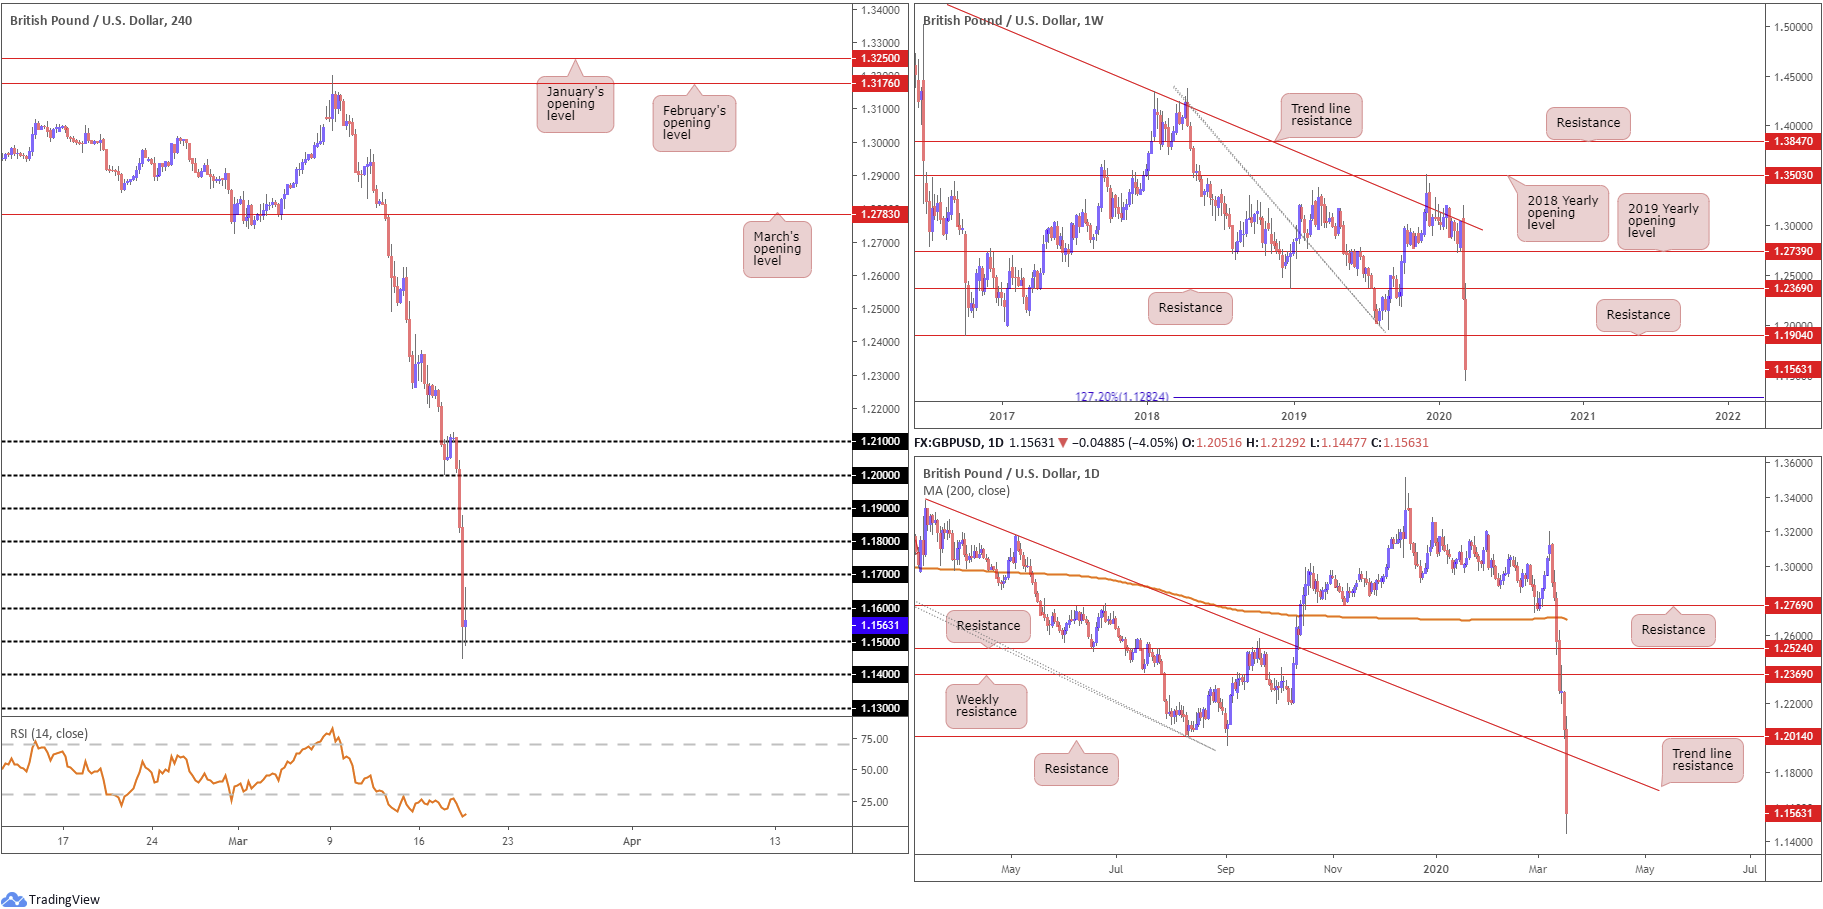
Standing as the worst performer among G10 currencies, sterling fell sharply against the buck Wednesday, losing more than 450 points and registering fresh multi-year lows.
Currently down more than 5.5% on the week, weekly support at 1.1904 offered little respite, with long-term flow eyeing the 127.2% Fibonacci extension point at 1.1282 as the next possible downside target. Before reaching this far south, however, traders may want to pencil in the possibility of a retest at 1.1904.
The daily timeframe houses a similar support target at 1.1282, the weekly 127.2% Fibonacci extension. Daily structure, though, reveals possible resistance emerging off a trend line formation, taken from the high 1.3380. It should also be noted the 200-day SMA value at 1.2690 is turning lower after remaining flat since November 2019.
Amidst rampant demand for dollars, short-term flow tested 1.15 and hauled the relative strength index (RSI) deeper into oversold ground Wednesday, currently trading off 15.00. 1.16 is seen holding, as we write, with the possibility of 1.14 entering the fight today in the event of further selling. The precipitous decline yesterday left little technical structure to work with on the H4, therefore focus shifts to psychological levels for now.
Areas of consideration:
Although holding off 1.15 on the H4, both weekly and daily timeframes exhibit scope to approach 1.1282, essentially the 1.13 handle. As such, a H4 close beneath 1.15 could spark further selling in this market, targeting moves beyond 1.14 to 1.13. Conservative traders may opt to wait and see if a retest at 1.15 materialises before pulling the trigger; others may be satisfied with short entries on the breakout candle south of 1.15.
AUD/USD:
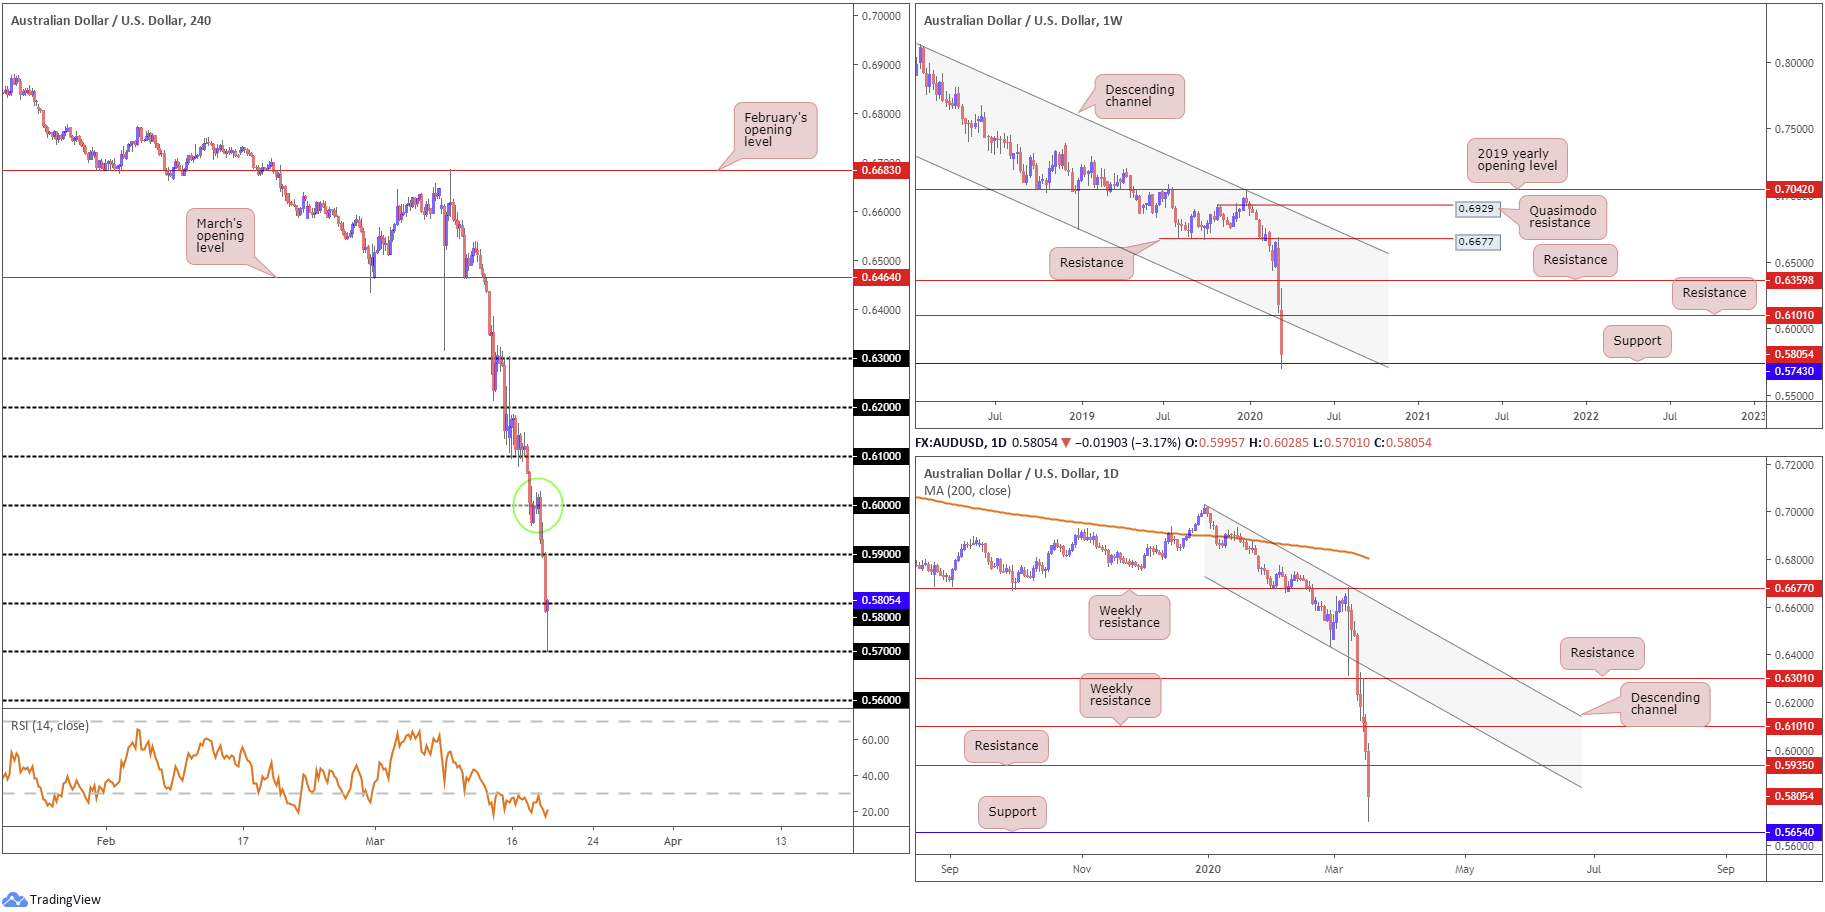
Down more than 6% on the week, AUD/USD continued to explore lower ground Wednesday as investors strongly bid USD in a rush for liquidity.
The market registered a fresh seventeen-year low at 0.5701, with weekly sellers embracing support at 0.5743. A rejection could pave the way for an approach to channel support-turned resistance, taken from the low 0.6744. Meanwhile, on the daily timeframe, price action displays room to test support coming in at 0.5654, with resistance standing at 0.5935.
The story on the H4 timeframe has price bottoming just north of 0.57, shaped by way of a hammer candlestick pattern (a bullish signal at troughs) and threatening to reclaim 0.58. 0.59 is seen next on tap in terms of resistance above 0.58, with supply (green circle) hugging the key figure 0.60 at 0.6027-0.5958. Indicator-based traders may also wish to note the relative strength index (RSI) remains toying with oversold levels, unable to exit above 30.00.
Areas of consideration:
A H4 close above 0.58 may entice aggressive buyers, particularly if the candle closes at highs and forms a hammer candlestick signal. This is further bolstered by the fact we’re coming from support at 0.5743 on the weekly timeframe. Upside targets rest at 0.59, followed by 0.5935, the daily resistance level, and then H4 supply at 0.6027-0.5958.
In view of the recent slide, traders will naturally adopt a cautious tone to longs right now. Therefore, some will want to see at least a retest at 0.58 develop before pulling the trigger.
USD/JPY:
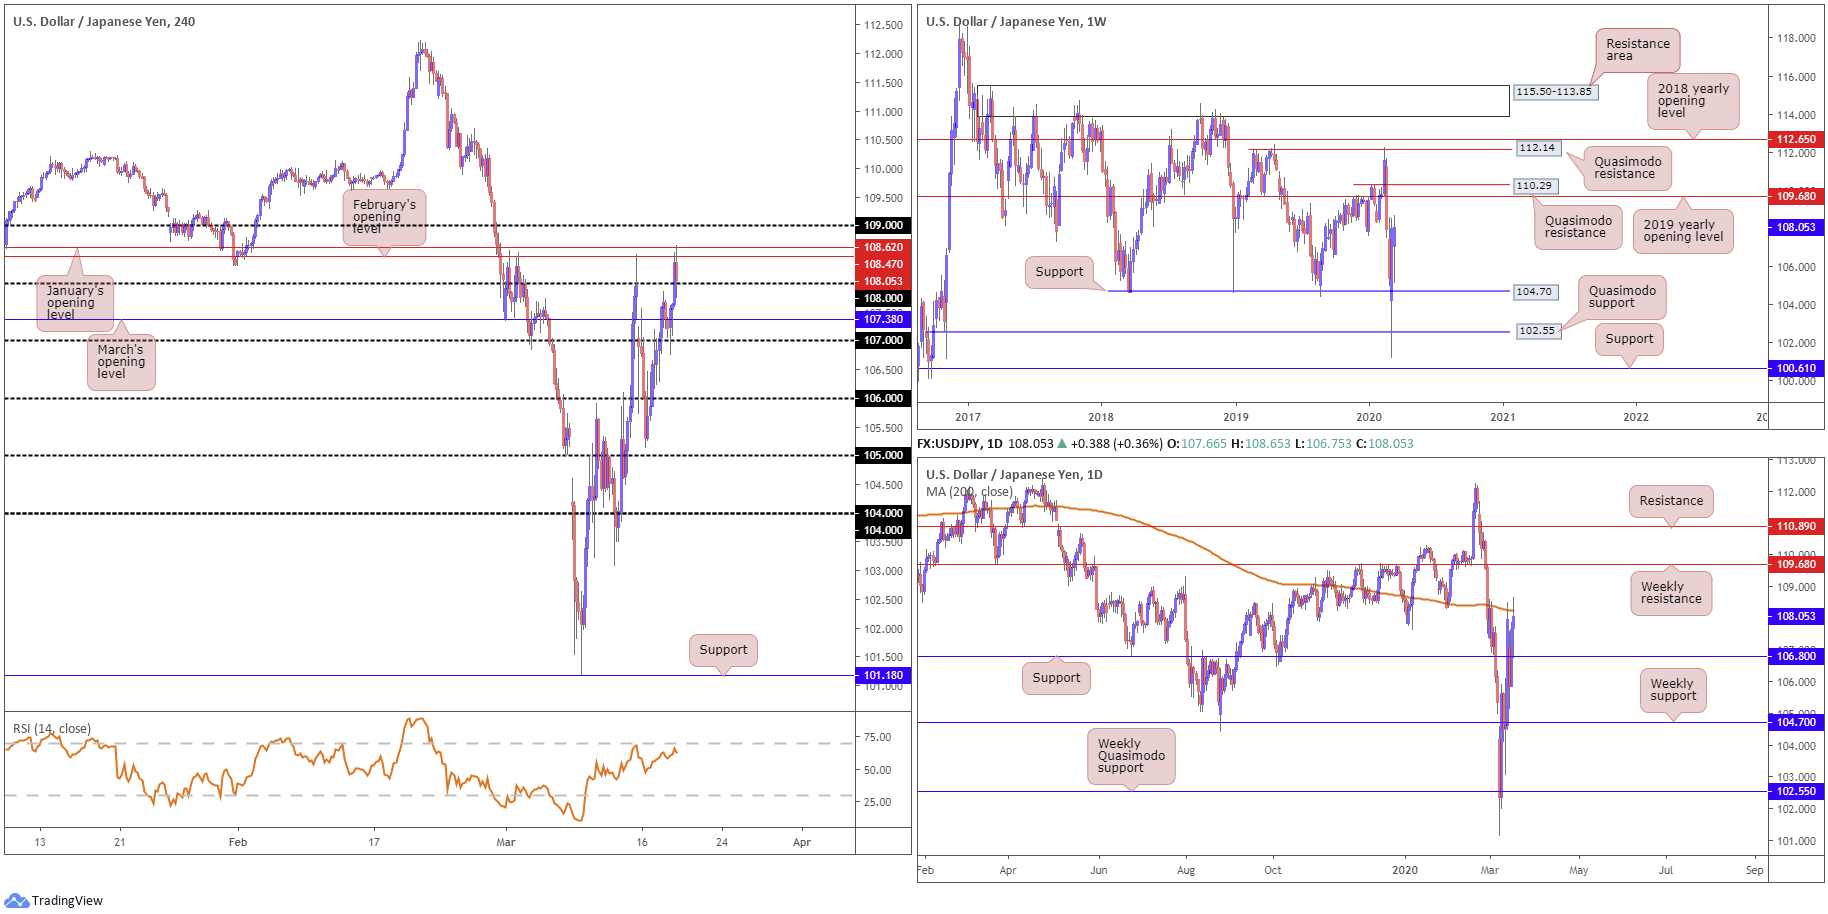
Despite global equities tanking Wednesday, USD/JPY extended Tuesday’s recovery and clocked highs at 108.65. According to many analysts, the dollar’s rally is likely a return of its safe-haven status.
H4 price retested 107 in early European trade and reclaimed March’s opening level at 107.38. The day ended fading session highs off February and January’s opening levels at 108.47 and 108.62, respectively, seen a touch beneath the 109 handle. The relative strength index (RSI) for those who follow momentum oscillators, will note the indicator hovers a touch south of overbought terrain.
Weekly support remains in view at 104.70, with eyes on the 2019 yearly opening level at 109.68 as resistance, followed by a Quasimodo formation at 110.29. Meanwhile, on the daily timeframe, price nudged above resistance at 106.80 (now a serving support) in recent trading and tested the 200-day SMA (orange – 108.23). A break of this dynamic value exposes 109.68 based on the weekly timeframe, highlighted above.
Areas of consideration:
Clearing 109 would be a strong cue we’re headed for weekly resistance at 109.68.
Resistance, based on the H4 timeframe between February and January’s opening levels at 108.47/108.62, coupled with the 200-day SMA on the daily timeframe, pose a problem for further upside in this market. While we cannot rule out the possibility of fresh upside attempts, a move back through 108, given the current resistances in motion, will likely entice keen sellers, with eyes on March’s opening level at 107.38 as the initial downside target.
USD/CAD:
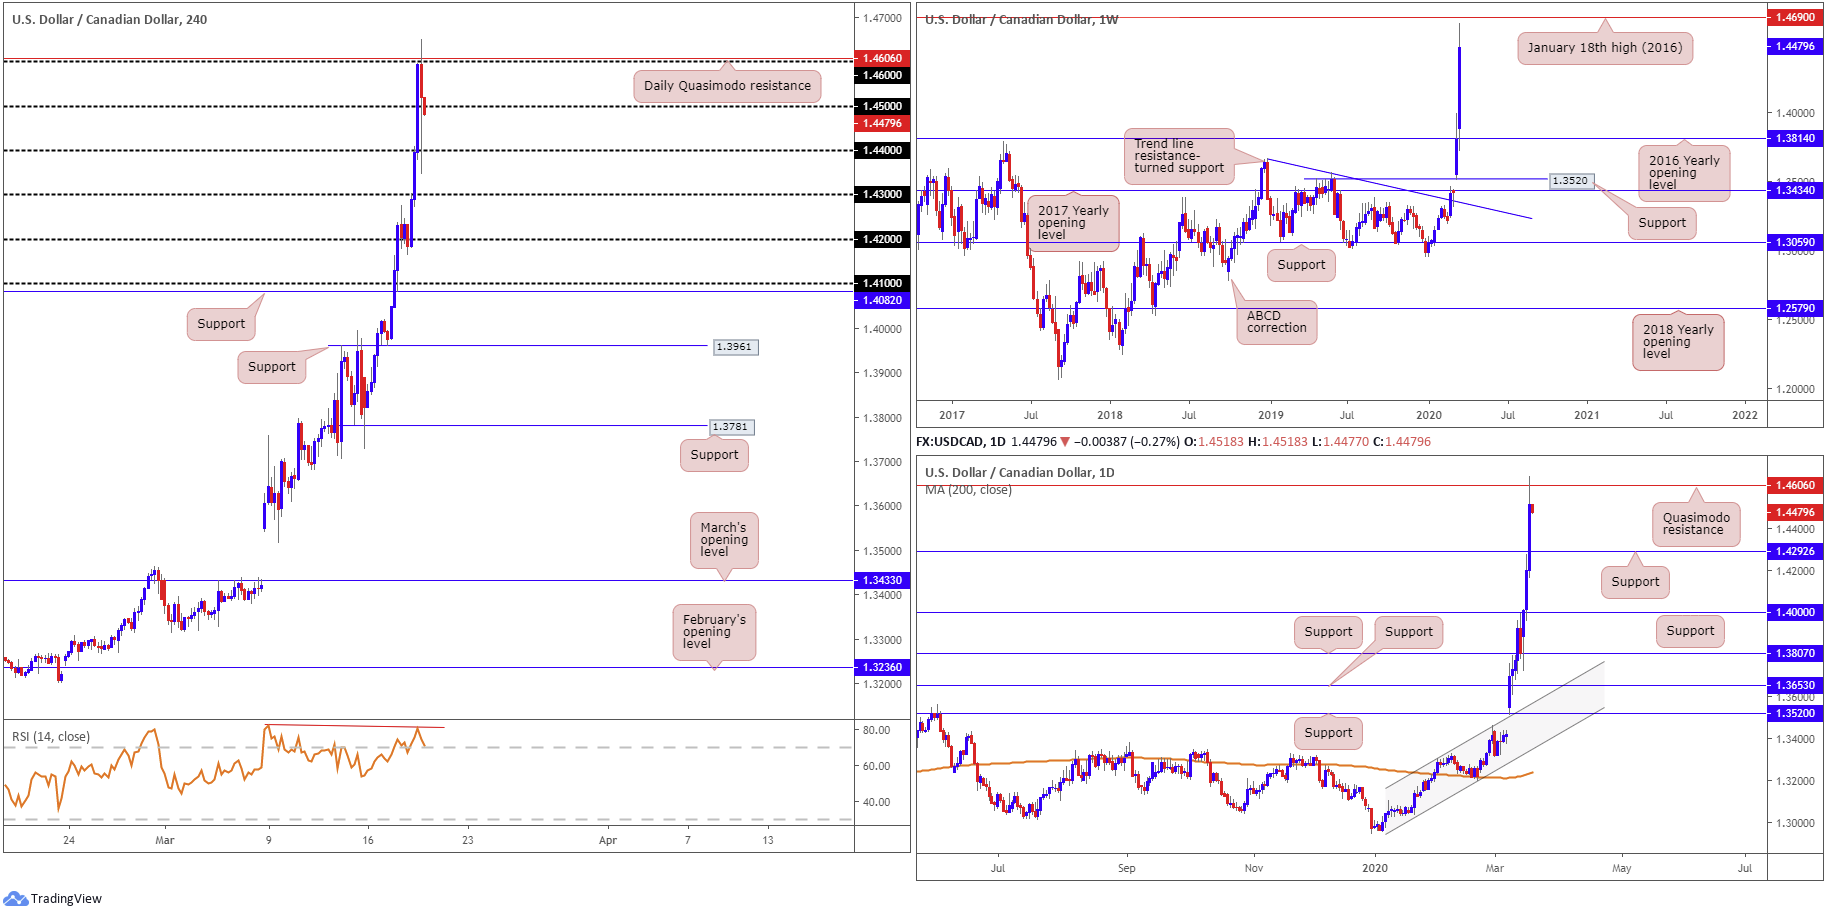
The US dollar added more than 2% vs. the Canadian dollar Wednesday, amid rampant USD bidding and WTI selling off heavily. Soured risk appetite was the key driver, with the US dollar retaining pole position as a safe haven.
Daily Quasimodo resistance at 1.4606 elbowed its way into the spotlight, dovetailing closely with the 1.46 handle on the H4 timeframe and confirmed by RSI bearish divergence. A sharp pullback from the said levels occurred in recent hours, though was unable to sustain downside south of 1.45/4.
The said daily Quasimodo formation is key to this market, located a touch beneath the 1.4690 January 18th high (2016), positioned on the weekly timeframe.
Areas of consideration:
A H4 close below 1.45 today will likely arouse seller interest to 1.44 and possibly 1.43, closely shadowed by daily support at 1.4292. The recent pullback to lows at 1.4349 likely did a good job of clearing most buyers in this vicinity, therefore the path south, theoretically, should be clear.
Conservative sellers may seek additional confirmation before committing; this could be something as simple as a retest at the underside of 1.45. Other traders may feel the evidence presented – daily Quasimodo resistance at 1.4606 entering the fold – may be enough to justify a short on a H4 candle close beneath 1.45.
USD/CHF:
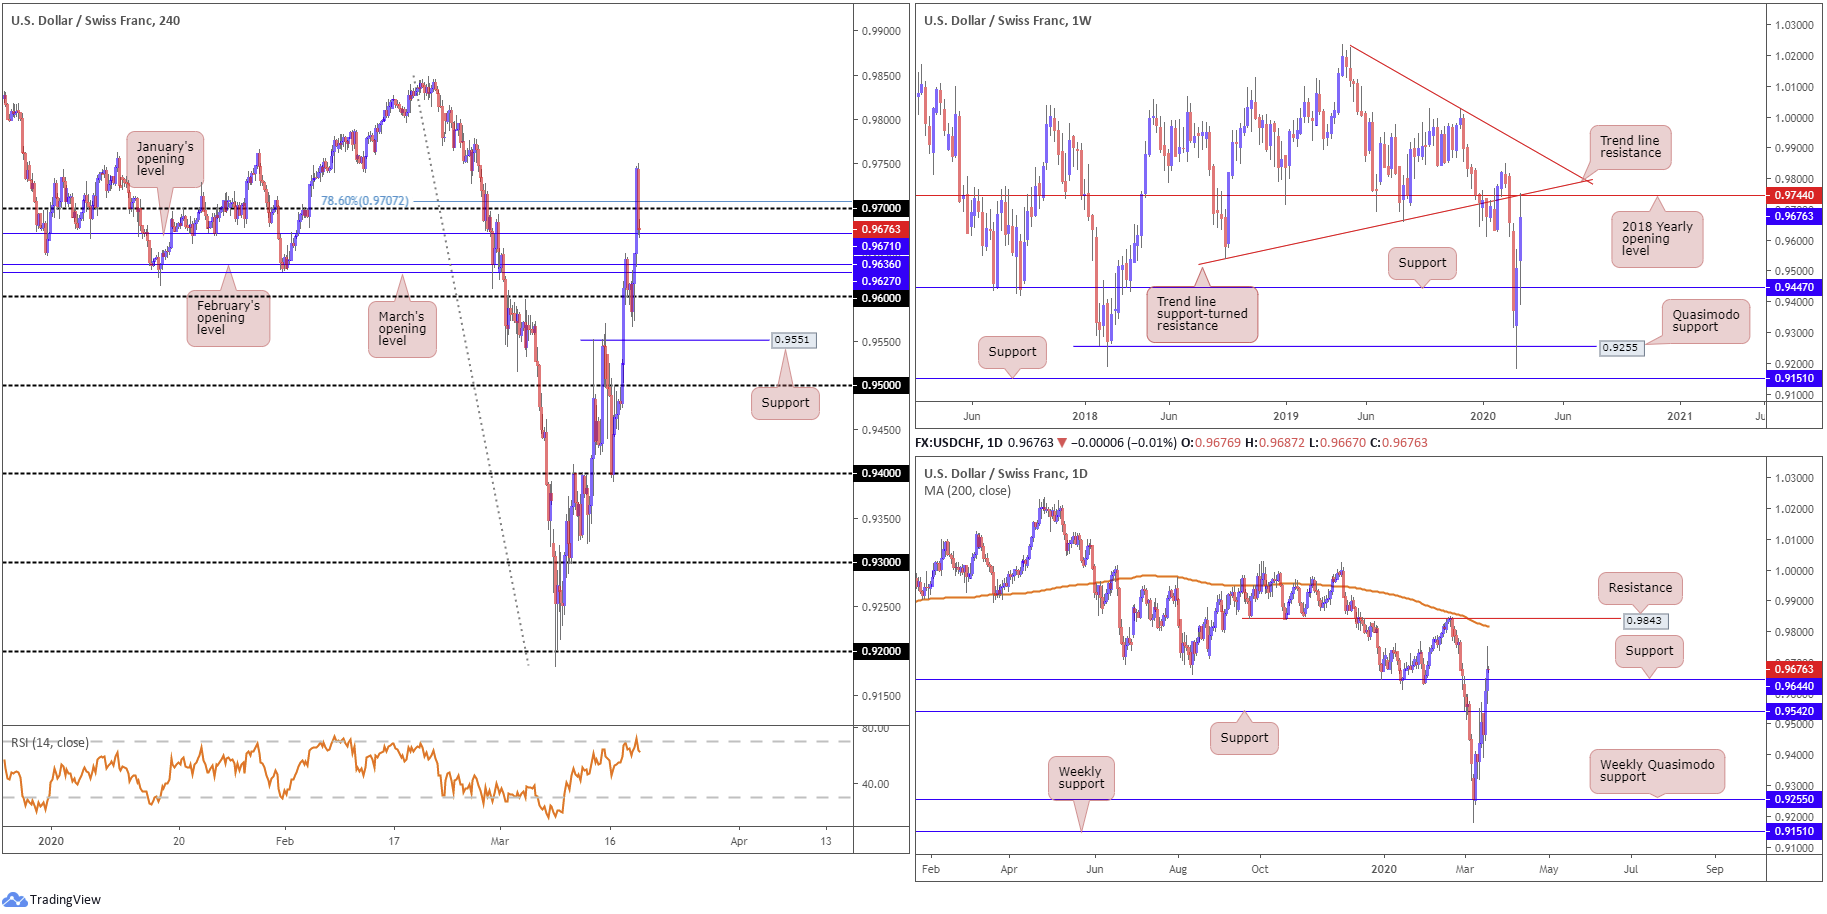
Broad USD bidding dominated market movement Wednesday, pulling USD/CHF northbound and eventually surpassing 0.97 (and a 78.6% Fibonacci retracement at 0.9707) to highs of 0.9750. Likely fuelled on the back of buy-stop liquidity above 0.97, traders faded session highs and regained 0.97 to the downside into the close. January’s opening level at 0.9671 may offer the market a temporary floor today, though failure here shines the spotlight back on March and February’s opening levels at 0.9627 and 0.9636, respectively.
Further out on the weekly timeframe, we recently touched gloves with the 2018 yearly opening level at 0.9744 and converging trend line support-turned resistance, taken from the low 0.9542. Elsewhere, nevertheless, daily activity recently conquered resistance priced in at 0.9644 (now a serving support level), suggesting scope to move as far north as resistance fixed from 0.9843, lurking close by the 200-day SMA (orange – 0.9817).
Areas of consideration:
Resistance consumed on the daily timeframe at 0.9644 is likely viewed as a bullish indicator, but given weekly price crossing paths with reasonably heavyweight resistance, upside is likely to be hindered from here.
As a result of the above, H4 supports, based on the noted monthly opening levels at 0.9627, 0.9636 and 0.9671 are unlikely to deliver much. While this may be the case, selling into the said monthly levels, despite weekly price suggesting moves lower, is just as chancy as let’s remember we also have daily support in play at 0.9644.
Therefore, neither a long nor short seems appealing at the moment.
Dow Jones Industrial Average:
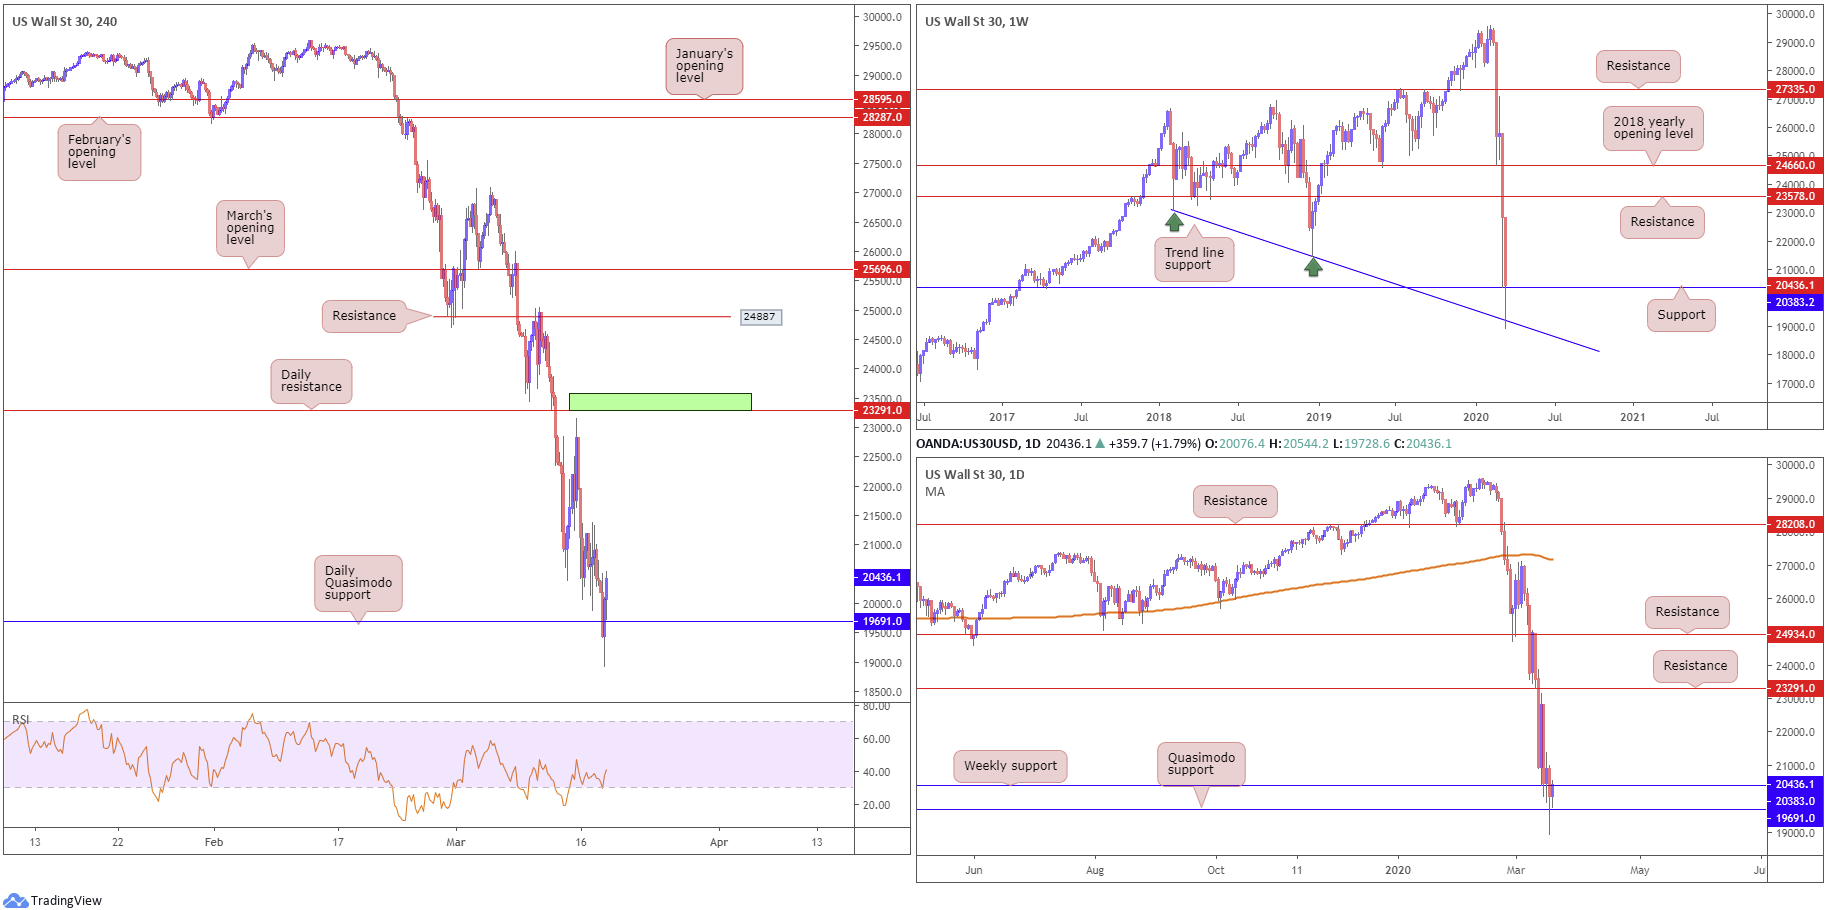
Global equities plummeted Wednesday as the economic fallout from the pandemic outpaced response from governments and central banks. The Dow Jones Industrial Average shed 1338.46 points, or 6.30%; the S&P 500 also lost 131.07 points, or 5.18%, and the tech-heavy Nasdaq 100 ended lower by 298.77 points, or 4.00%.
From a technical standpoint, price action on the weekly timeframe overthrew support at 20383 and embraced trend line support, pencilled in from the low 23055. As of writing, price is holding north of the said support level. Daily movement has the index holding off Quasimodo support at 19691, which also represents support on the H4 timeframe.
Areas of consideration:
The combination of weekly support at 20383, shadowed closely by daily Quasimodo support at 19691 and a reasonably solid H4 bull candle may be enough to encourage further upside today.
In the event further recovery materialises, traders may recall the H4 zone marked in green between 23578/23291, which represents weekly and daily resistances, an area sellers may have on the radar for potential shorting opportunities, in the event we get back to these levels.
XAU/USD (GOLD):
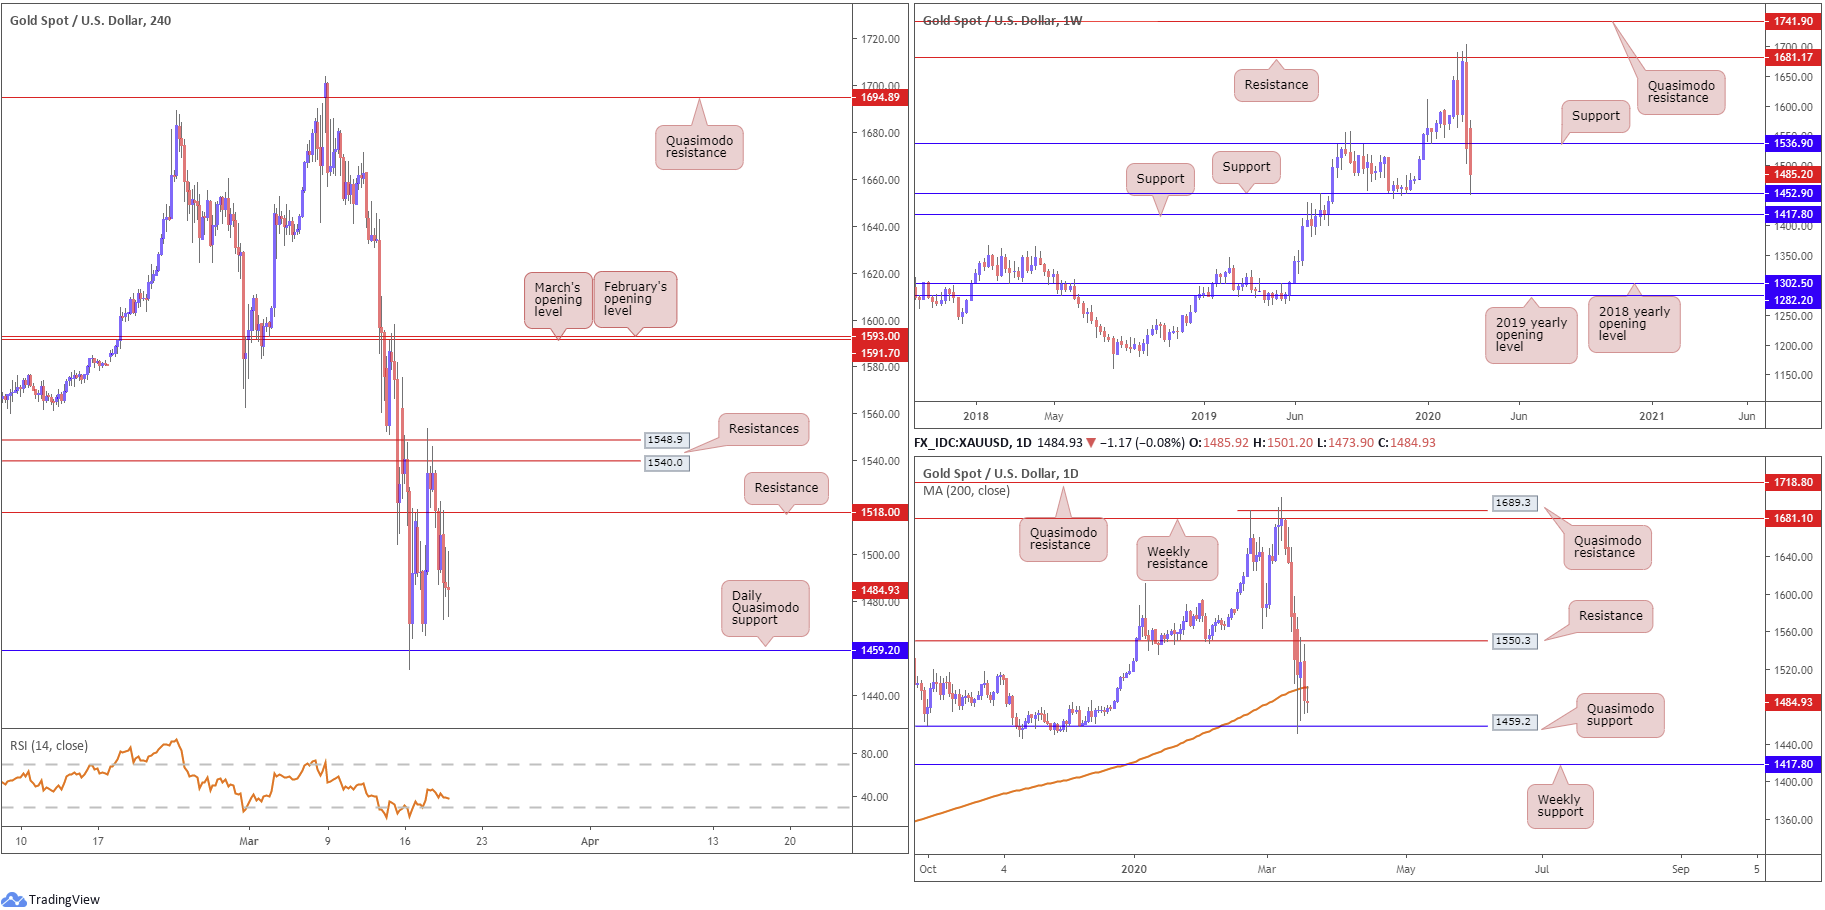
XAU/USD spot failed to capitalise on Tuesday’s modest upside, pencilling in near-3% losses amid robust USD bidding. The US dollar index, which measures the buck’s value against six major currencies, advanced to levels not seen since March 2017. Global equities also plunged, though failed to spark a lift in bullion.
Weekly price reveals we’ve softened back beneath support at 1536.9, on track to reconnect with support priced in at 1452.9, positioned ahead of weekly support at 1417.8. Meanwhile, daily price, though leaving resistance at 1550.3 unchallenged, reclaimed the 200-day SMA (orange – 1500.7) to the downside yesterday and exposed a familiar Quasimodo support at 1459.2, sited above the weekly support at 1417.8. Note price is seen retesting the underside of the said SMA value, as we write, yet trades by way of a doji indecision candle pattern.
Resistances between 1548.9/1.1540.0 on the H4 timeframe held firm Wednesday, sending intraday flow under support at 1518.0 (now a serving resistance level) and possibly charting the way towards the daily Quasimodo support mentioned above at 1549.2.
Areas of consideration:
Those who read Wednesday’s technical briefing you may recall the following:
Should a H4 close form below support at 1518.0, knowing we’re trading below resistance at 1550.3 on the daily timeframe, this may generate additional downside, with a revisit to daily Quasimodo support at 1459.2 a possibility.
Well done to any readers who managed to jump aboard yesterday’s move lower, either by way of the breakout candle or a retest at the underside of 1518.0. Risk for most sellers is likely reduced to breakeven at this point, with downside targets resting at 1459.2, followed closely by weekly support at 1452.9.
The accuracy, completeness and timeliness of the information contained on this site cannot be guaranteed. IC Markets does not warranty, guarantee or make any representations, or assume any liability regarding financial results based on the use of the information in the site.
News, views, opinions, recommendations and other information obtained from sources outside of www.icmarkets.com.au, used in this site are believed to be reliable, but we cannot guarantee their accuracy or completeness. All such information is subject to change at any time without notice. IC Markets assumes no responsibility for the content of any linked site.
The fact that such links may exist does not indicate approval or endorsement of any material contained on any linked site. IC Markets is not liable for any harm caused by the transmission, through accessing the services or information on this site, of a computer virus, or other computer code or programming device that might be used to access, delete, damage, disable, disrupt or otherwise impede in any manner, the operation of the site or of any user’s software, hardware, data or property.


