
Key risk events today:
UK Retail Sales m/m; MPC Official Bank Rate Votes; BoE Monetary Policy Summary; BoE Official Bank Rate; UK Asset Purchase Facility; Philly Fed Manufacturing Index.
EUR/USD:
EUR/USD curved lower Wednesday, shedding more than 35 points and snapping a two-day bullish phase. The pair found limited cheer on Germany’s Ifo release, swiftly topping at 1.1142. Eurozone annual inflation remains muted, with metrics coming in as expected. The US dollar index continues to explore higher ground after bottoming at 96.59, in the shape of a symmetrical daily ABCD correction.
For traders who read Wednesday’s technical briefing you may recall the following piece:
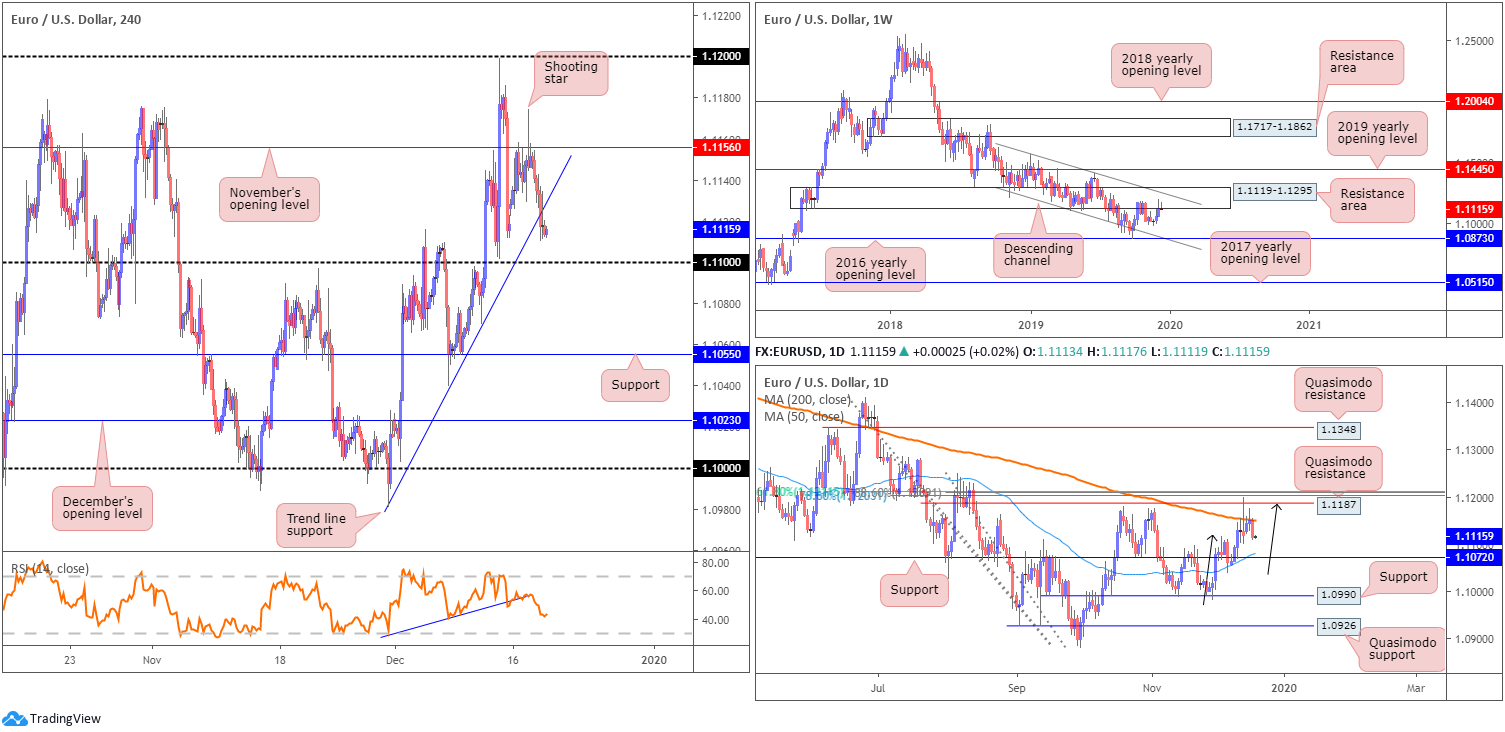
Shorts on the back of the reaction off November’s opening level at 1.1156 is an option, basing entry and risk levels on the recently formed H4 shooting star pattern. This is bolstered by weekly and daily structure. Ultimately, sellers will be looking for a break of the current H4 trend line, though 1.11 is likely set as the first take-profit zone. Reducing risk to breakeven at 1.11 is an idea, with daily support at 1.1072 set as the next take-profit target.
From the higher timeframes, Wednesday’s piece had the following to say:
Weekly flow remains contained south of a long-standing resistance area at 1.1119-1.1295, which happens to intersect closely with a channel resistance, extended from the high 1.1569. Downside objectives visible from here fall in at the 2016 yearly opening level at 1.0873 and channel support, taken from the low 1.1109.
A closer reading of technical movement on the daily timeframe reveals the 200-day SMA (orange – 1.1150) holds price lower. Previously, however, price whipsawed through the said SMA and connected with Quasimodo resistance at 1.1187, positioned a few points south of a Fibonacci cluster around the 1.1206 neighbourhood. What’s also notable from a technical perspective is the bearish ABCD correction (black arrows) that terminated at the aforementioned Quasimodo resistance. Therefore, based on daily analytics, further downside could be seen. Support on this timeframe rests at 1.1072/50-day SMA (1.1078), with a break of this level potentially setting the stage for a push towards support at 1.0990.
Areas of consideration:
As evident from the H4 chart this morning, price, as expected, did indeed press lower and close south of H4 trend line support, extended from the low 1.0981, with 1.11 now resting close by as the initial take-profit target. Well done to any readers who managed to jump onboard this move.
As stated above, reducing risk to breakeven at 1.11 is an idea, with daily support at 1.1072 set as the next take-profit target.
Also worthy of attention today is the following setup taken from Wednesday’s analysis:
Knowing daily support at 1.1072 lurks beneath 1.11, and given psychological levels are prone to fakeouts, the likelihood of a fakeout developing through 1.11 to 1.1072 remains high, according to the chart studies. In the event a fakeout through 1.11 takes form, longs on a H4 close back above the round number could be a possibility, targeting November’s opening level at 1.1156 as the initial port of call. However, this will have you competing with weekly sellers, therefore strict trade management is an absolute must.
GBP/USD:
The pound held onto the bulk of Tuesday’s downside yesterday, dipping below 1.31 before finding a base at around 1.3070. Limited reaction was observed in light of UK inflation metrics, in which headline CPI modestly topped forecasts ahead of the BoE’s monetary policy update today.
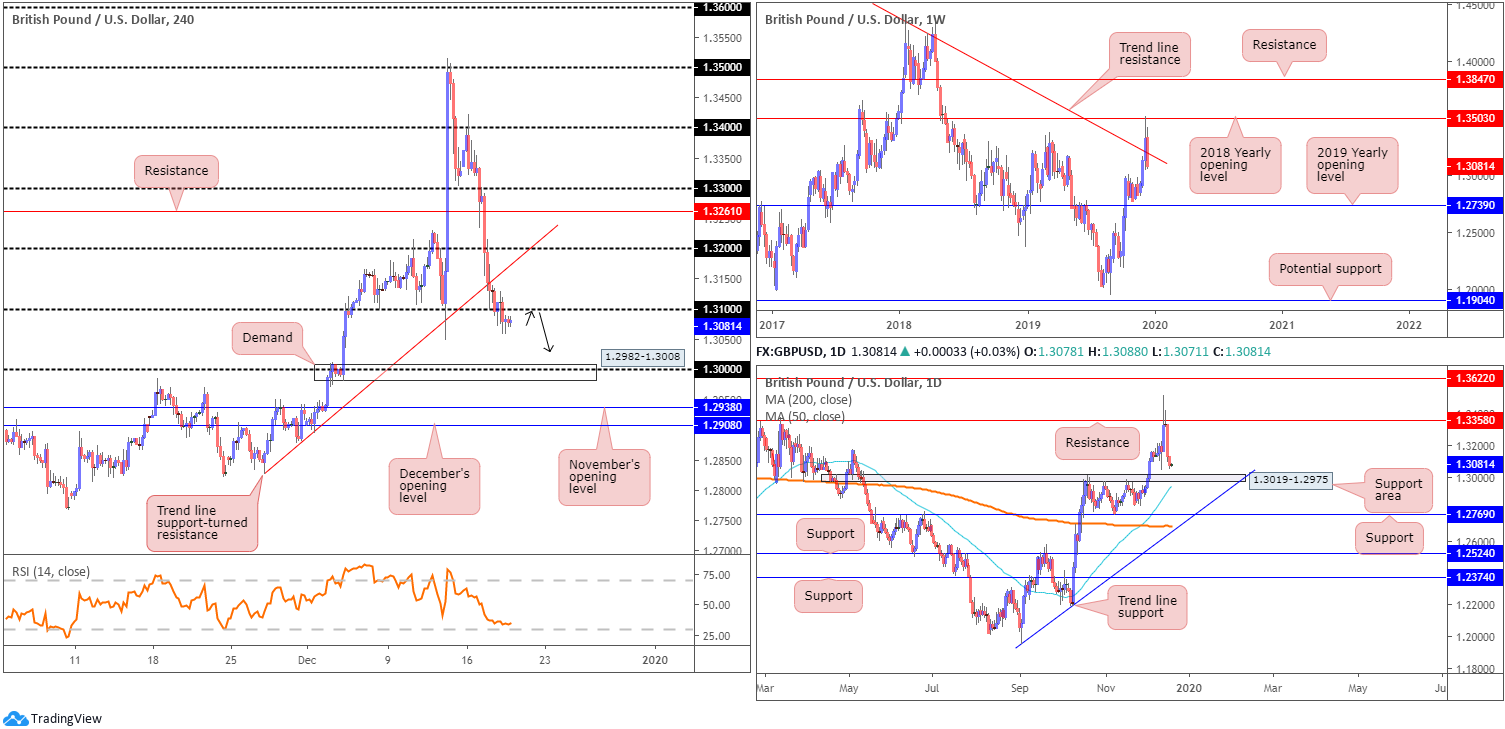
With 1.31 now likely to offer resistance, H4 demand plotted at 1.2982-1.3008 is in sight, which happens to merge with the key figure 1.30.
In conjunction with H4 flow, daily price exhibits scope to press lower and shake hands with a support area coming in at 1.3019-1.2975. Interestingly, the 50-day SMA (blue – 1.2942), which recently crossed above the 200-day SMA (orange – 1.2694), is positioned just south of the daily zone.
Weekly price, on the other hand, crossed back through long-standing trend line resistance, pencilled in from the high 1.5930, after testing the 2018 yearly opening level at 1.3503. A defined close south of this barrier highlights a possible approach towards the 2019 yearly opening level at 1.2739.
Areas of consideration:
Considering 1.31 may provide a ceiling to the market today, a retest at this angle is likely of interest for many traders. A retest by way of a H4 bearish candlestick signal is considered the ideal scenario; not only will this help identify seller intent, it’ll provide entry/risk metrics to work with.
As for downside targets, the top edge of the daily support area at 1.3019 is in view, closely shadowed by H4 demand at 1.2982-1.3008.
AUD/USD:
In recent hours, AUD/USD advanced sharply on the back of robust employment metrics. Unemployment dipped to 5.2% for November, while employment added 39.9k jobs.
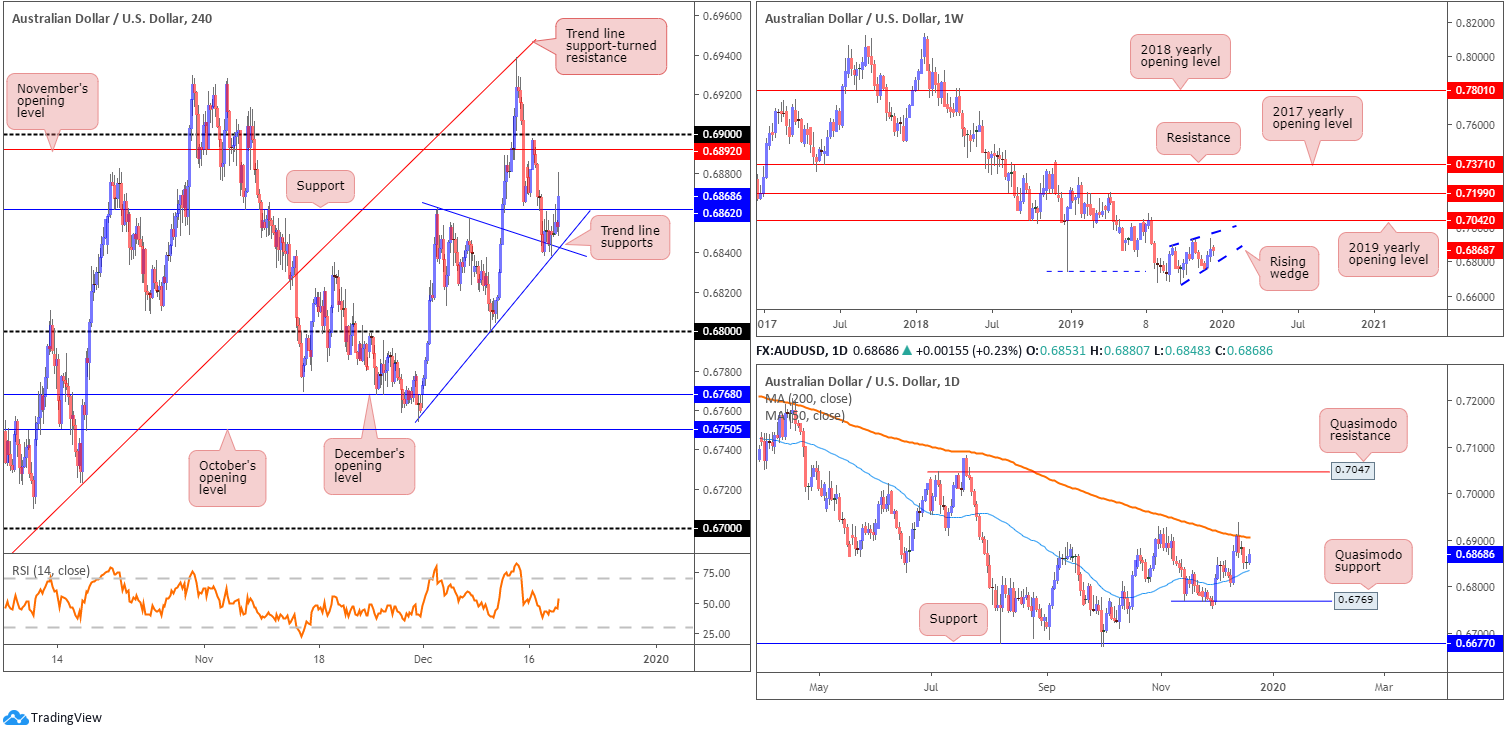
Technically, the move higher crossed through H4 resistance at 0.6862 (now acting support), after finding a base around two trend line supports (0.6754/0.6861). The next upside objective falls in close by at November’s opening level drawn from 0.6892, closely shadowed by the 0.69 handle.
Technical action based on the weekly timeframe shows the candles have been busy carving out what appears to be a rising wedge formation, since registering a bottom in late September at 0.6670. This is typically considered a continuation pattern. As the 2019 yearly opening level at 0.7042 is seen close by, the aforementioned rising wedge could potentially continue advancing until connecting with this angle. The primary downtrend, visible from this timeframe, has also been in play since early 2018, consequently adding weight to a breakout south possibly emerging.
The story on the daily timeframe reveals the unit recently crossed paths with the 200-day SMA (orange – 0.6906). Note AUD/USD has traded south of the said SMA since April 2019, therefore seeing this dynamic value continue to offer resistance is not a surprise. In terms of support, the 50-day SMA (blue – 0.6832) is visible nearby, with a break perhaps clearing the path south to Quasimodo support at 0.6769.
Areas of consideration:
Should H4 close north of 0.6862 this morning, traders will likely consider this an intraday bullish indicator and look to trade any retest of the broken base (conservative traders may opt to wait and see if additional candlestick confirmation occurs before pulling the trigger). As highlighted above, the initial resistance from here can be seen at 0.6892.
USD/JPY:
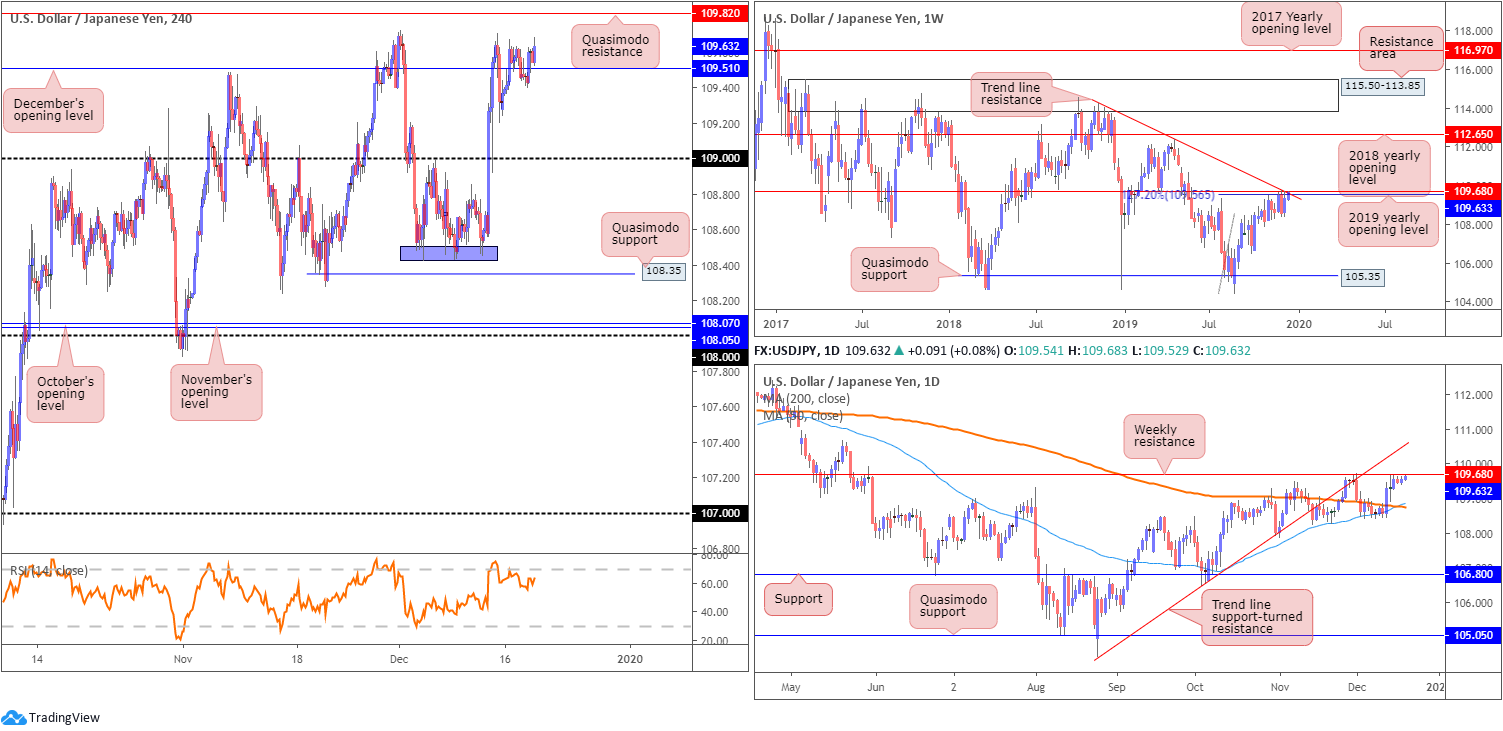
USD/JPY pretty much closed unchanged Wednesday, though H4 price now trades reasonably firm north of December’s opening level at 109.51. Quasimodo resistance at 109.82 remains the next upside objective on the H4 scale. Alone, this Quasimodo formation is unlikely to produce much, though given its connection to the higher timeframes, we may have something here:
A collection of weekly resistances are in motion: a 127.2% Fibonacci ext. point at 109.56 (taken from the low 104.44), resistance formed at 109.68, the 2019 yearly opening level and trend line resistance, extended from the high 114.23. Aside from the 106.48 September 30 swing low, limited support is evident on the weekly timeframe until shaking hands with Quasimodo support at 105.35. A break north, however, highlights the 2018 yearly opening level at 112.65 as the next possible layer of resistance.
Daily action is also seen shaking hands with the said weekly resistances. The difference on this scale, nonetheless, is the downside targets. The 200/50-day SMAs (orange – 108.75/blue – 108.85) rest as potential support. Also note, the 50-day SMA is crossing above the 200-day SMA, generally viewed as a bullish indicator (a Golden Cross).
Areas of consideration:
Quasimodo resistance on the H4 timeframe at 109.82 is likely of interest today. Knowing it boasts a strong connection to weekly resistances, it could produce a sizable move. Nevertheless, entering short from here entails going against the immediate uptrend. Therefore, traders may opt to wait for additional candlestick confirmation to form before committing (entry/risk levels can be set according to this pattern).
USD/CAD:
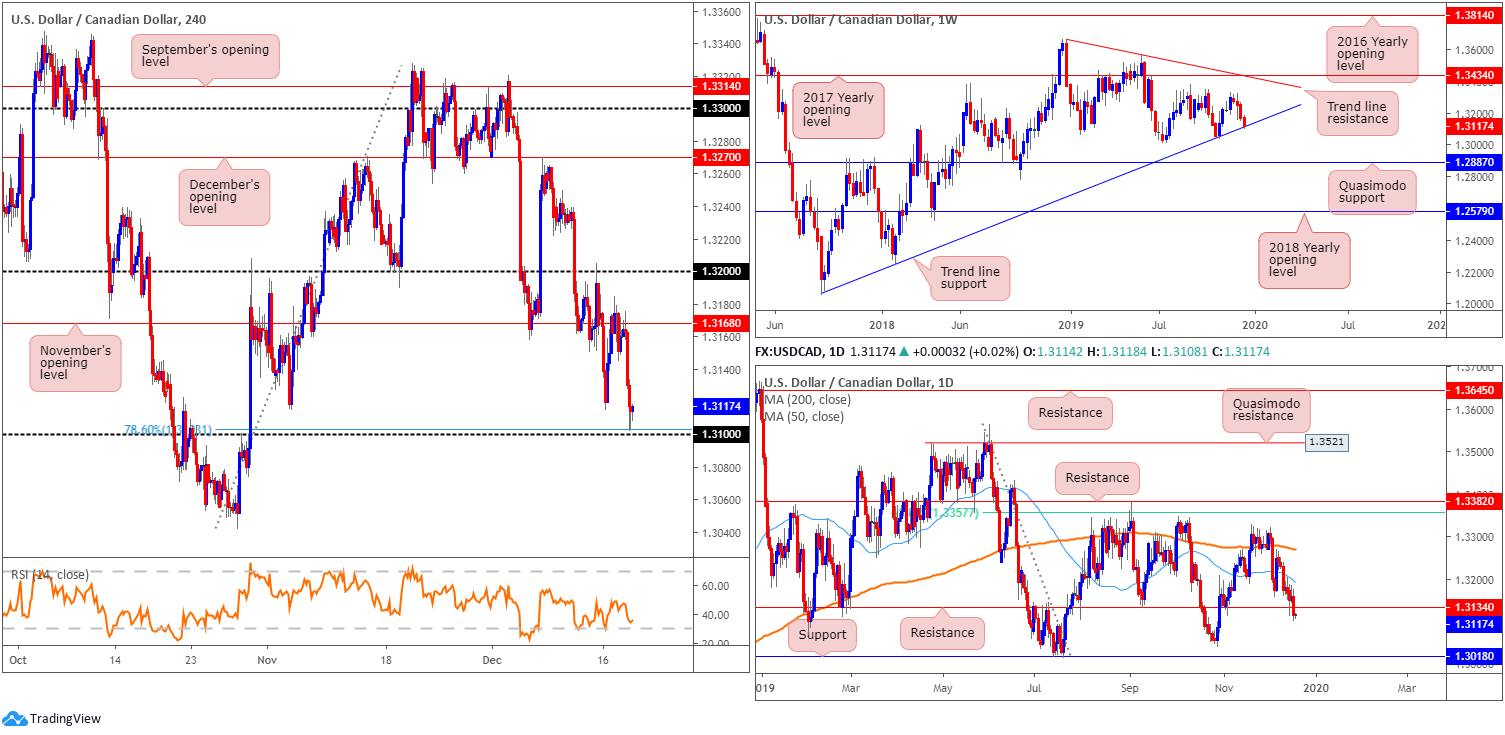
Wednesday’s Canadian inflation metrics fell largely in line with consensus estimates. Overall, however, USD/CAD maintained a mildly weaker tone, dropping to fresh session lows around the 1.3102 region.
H4 price, as of current levels, is hovering north of the 1.31 handle, using the 78.6% Fibonacci ratio at 1.3103 as support. This comes following a precipitous decline from November’s opening level at 1.3168. Indicator-based traders may also wish to note the relative strength index (RSI) is producing bullish divergence (blue line).
Interestingly, weekly price is seen testing long-term trend line support, taken from the low 1.2061. A violation of this line likely gives way to Quasimodo support at 1.2887. Meanwhile, on the daily timeframe, the unit recently dethroned support at 1.3134 (now serving as resistance). This move highlights the 1.3074 October 29 low, followed closely by support at 1.3018.
Areas of consideration:
Slightly adapted from the previous H4 reversal zone, 1.31/1.3113 (green), based on the H4 timeframe, offers a reasonably firm area of interest today for possible long entries (comprised of the round number 1.31, a 78.6% Fibonacci ratio at 1.3103 and a 127.2% Fibonacci extension point at 1.3113, as well as weekly trend line support).
Traders long from 1.31/1.3113 can expect some opposition around the daily resistance at 1.3134.
USD/CHF:
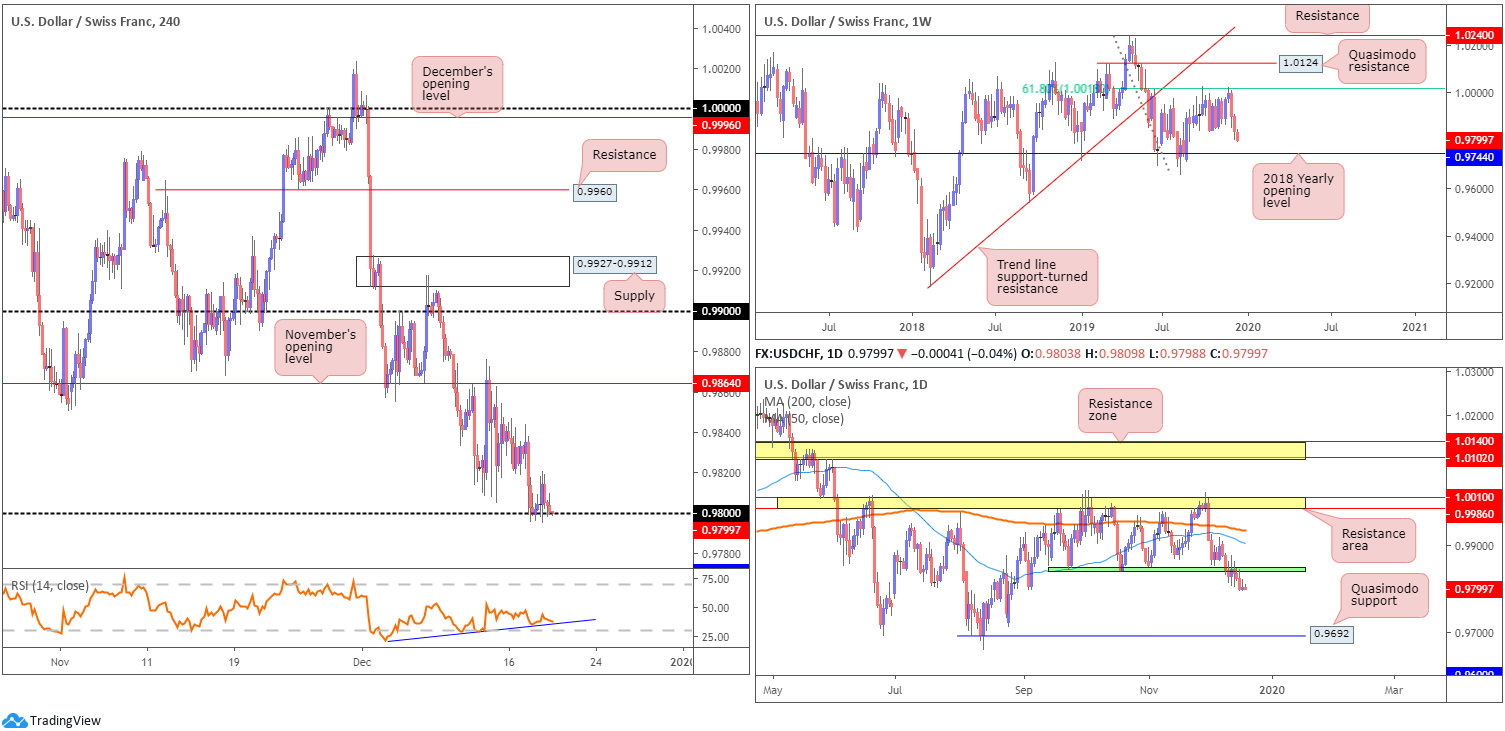
As evident from the H4 timeframe this morning, buyers and sellers continue squaring off at the 0.98 handle. A number of upside attempts have emerged from 0.98 (check M30), though intraday resistance at 0.9820 is proving a troublesome ceiling to overcome. Although 0.98 comes with RSI confirmation: bullish divergence, it appears the sellers have the upper hand here at the moment. South of 0.98, traders can look forward to a move towards support at 0.9771.
Weekly price remains capped by a 61.8% Fibonacci retracement ratio at 1.0018. Of late, two decisive bearish candles formed, testing lows of 0.9805. Equally impressive is the 2018 yearly opening level at 0.9744. Capping downside since the beginning of the year, this level is considered the next support target on the weekly scale. According to the primary trend, price reflects a slightly bullish tone.
In conjunction with weekly flow, the lower edge of a 3-month consolidation at 0.9845ish gave way last week. 0.9744 is the primary downside target on the weekly timeframe, while on the daily timeframe, Quasimodo support coming in at 0.9692 appears a valid target.
Areas of consideration:
As weekly and daily timeframes suggest further downside could be in store (see above in bold), a H4 close beneath 0.98 is likely eyed. While H4 support rests close by at 0.9771, this should not deter selling south of 0.98, given the room seen to move lower on the bigger picture.
Traders have a choice of either selling the H4 breakout candle or, more conservatively, waiting and seeing if a retest at 0.98 forms. The latter can sometimes get traders in at unfavourable price levels; this is the cost of additional confirmation.
Dow Jones Industrial Average:
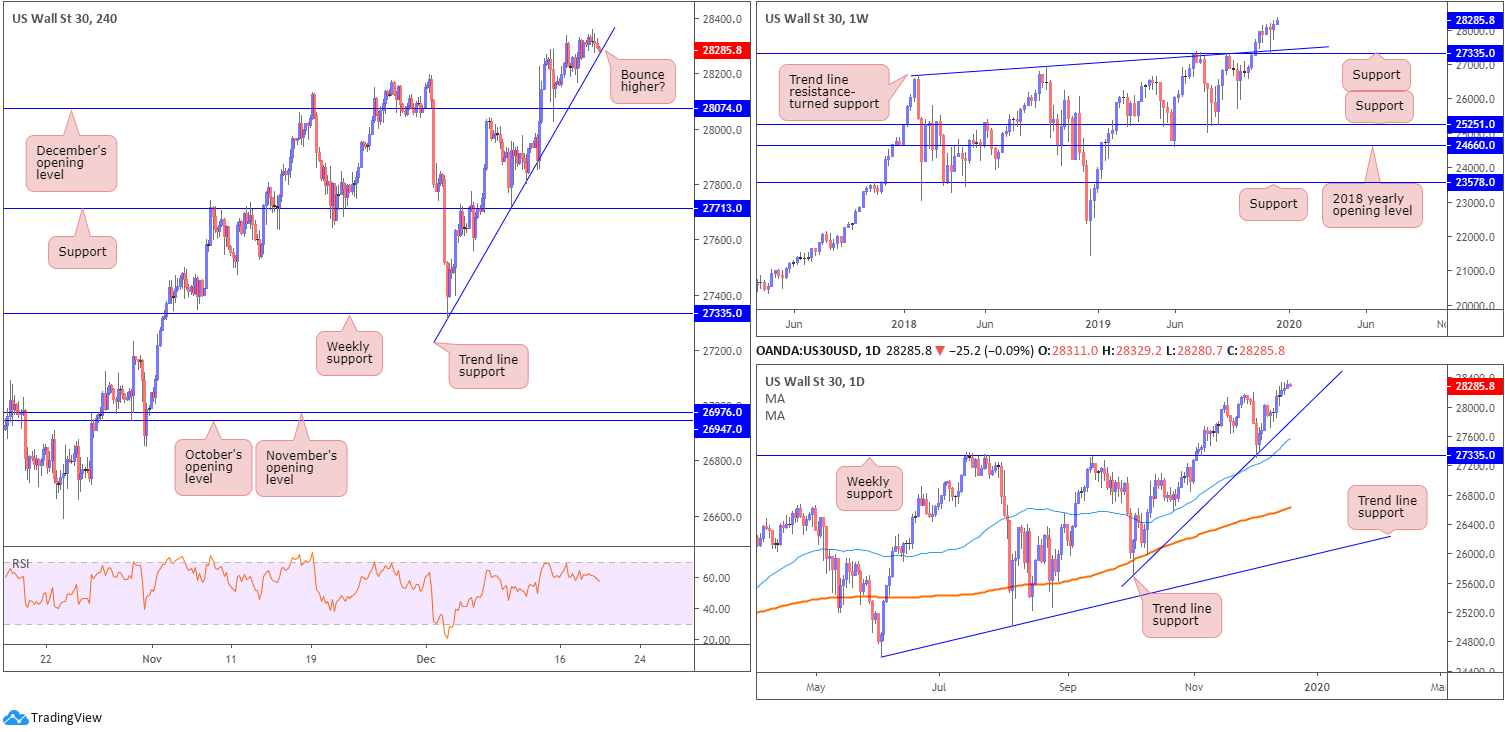
US equities finished mixed Wednesday, as major benchmarks remain subdued. The Dow Jones Industrial Average erased 27.88 points, or 0.10% (the index struck fresh records of 28359), the S&P 500 closed flat and the tech-heavy Nasdaq 100 added 4.92 points, or 0.06%.
Technically, structure remains pretty much unchanged.
H4 trend line support, extended from the low 27314, is currently being tested, with a break exposing December’s opening level at 28074. It might also interest some traders that the relative strength index (RSI) recently struck the 70.00 overbought value and turned lower.
Weekly price continues to trade north of support drawn from 27335, along with trend line support, etched from the high 26670. This follows a strong weekly hammer candlestick formation (considered a buy signal at troughs), formed the week prior. Meanwhile, on the daily timeframe, trend line support, extended from the low 25710, could offer the market a floor this week. A break lower, nonetheless, may draw in the 50-day SMA (blue – 27541) and then weekly support mentioned above at 27335.
Areas of consideration:
The fact we’re trading not too far off record peaks, and entrenched within a monstrous uptrend, this clearly remains a buyers’ market right now. H4 trend line support highlighted above could very well hold price action higher today/this week, though given the reasonably close proximity of December’s opening level at 28074, traders will likely wait for additional candlestick confirmation before committing to a position (entry/risk levels can be determined according to this pattern).
XAU/USD (GOLD):
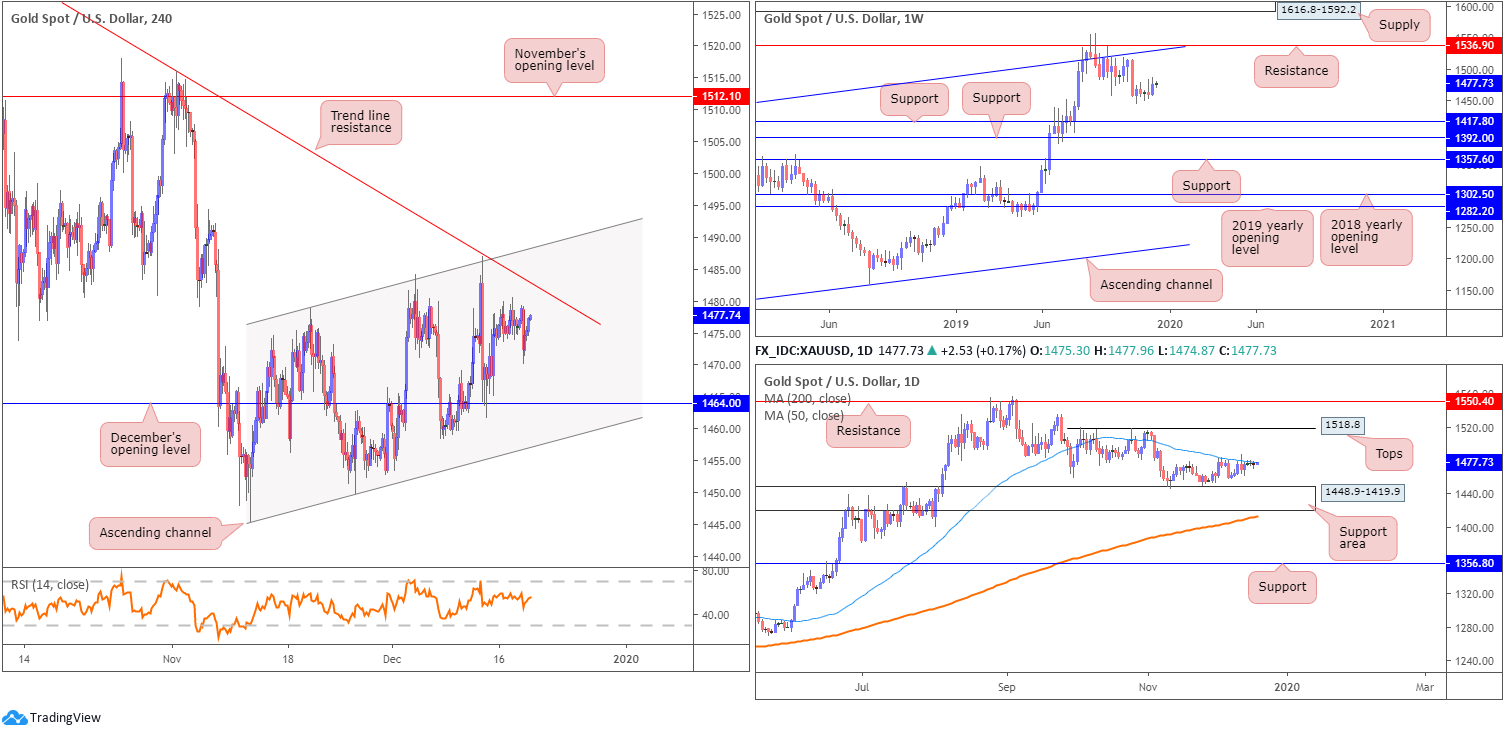
XAU/USD spot prices have pretty much remained stale this week, ranging no more than $10. Technically, the lacklustre movement has resulted in three back-to-back daily indecision candles forming.
From the H4 timeframe, price continues to inch closer to a familiar trend line resistance, taken from the high 1557.1. This follows last week’s near-to-the-point recovery off December’s opening level at 1464.0. Note, the H4 candles have also been compressing within an ascending channel formation since bottoming at 1445.5 (high at 1478.8).
On more of a broader perspective, since connecting with resistance at 1536.9 and channel resistance, extended from the high 1375.1, weekly price has been in a mild decline. Further downside from here potentially sets the stage for a move towards two layers of support at 1392.0 and 1417.8. Overall, however, the primary trend has faced a northerly trajectory since bottoming in early December 2015.
The 50-day SMA (blue – 1477.3) continues to offer resistance on the daily timeframe, hampering upside from the support area coming in at 1448.9-1419.9. A break through the current SMA could lead to an attack at tops around 1518.8, closely followed by resistance at 1550.4. Traders may also benefit in noting the 200-day SMA (orange – 1412.8) is seen crawling north just beneath the aforementioned support zone.
Areas of consideration:
As daily price remains capped beneath the 50-day SMA, additional short entries at the current H4 trend line resistance remains an option. However, with limited confluence in view, aside from the 50-day SMA, traders are urged to consider confirmed entries, candlestick confirmation, for example. This not only helps identify seller intent, it also provides entry and risk levels to work with making it easier to calculate risk/reward.
The accuracy, completeness and timeliness of the information contained on this site cannot be guaranteed. IC Markets does not warranty, guarantee or make any representations, or assume any liability regarding financial results based on the use of the information in the site.
News, views, opinions, recommendations and other information obtained from sources outside of www.icmarkets.com.au, used in this site are believed to be reliable, but we cannot guarantee their accuracy or completeness. All such information is subject to change at any time without notice. IC Markets assumes no responsibility for the content of any linked site.
The fact that such links may exist does not indicate approval or endorsement of any material contained on any linked site. IC Markets is not liable for any harm caused by the transmission, through accessing the services or information on this site, of a computer virus, or other computer code or programming device that might be used to access, delete, damage, disable, disrupt or otherwise impede in any manner, the operation of the site or of any user’s software, hardware, data or property.


