
EUR/USD:
Over the course of Wednesday’s sessions, the greenback witnessed a resurgence of bidding, lifting the US dollar index above its 95.50 mark and pressuring the euro to lower ground (-0.63%).
Yesterday’s FOMC meeting minutes for September stated all policy makers expressed the view of raising rates by 25bps. On the data front US building permits fell in September at 1.24mln vs. expected 1.27mln. The print triggered a marginal USD decline, though it was not really anything to write home about.
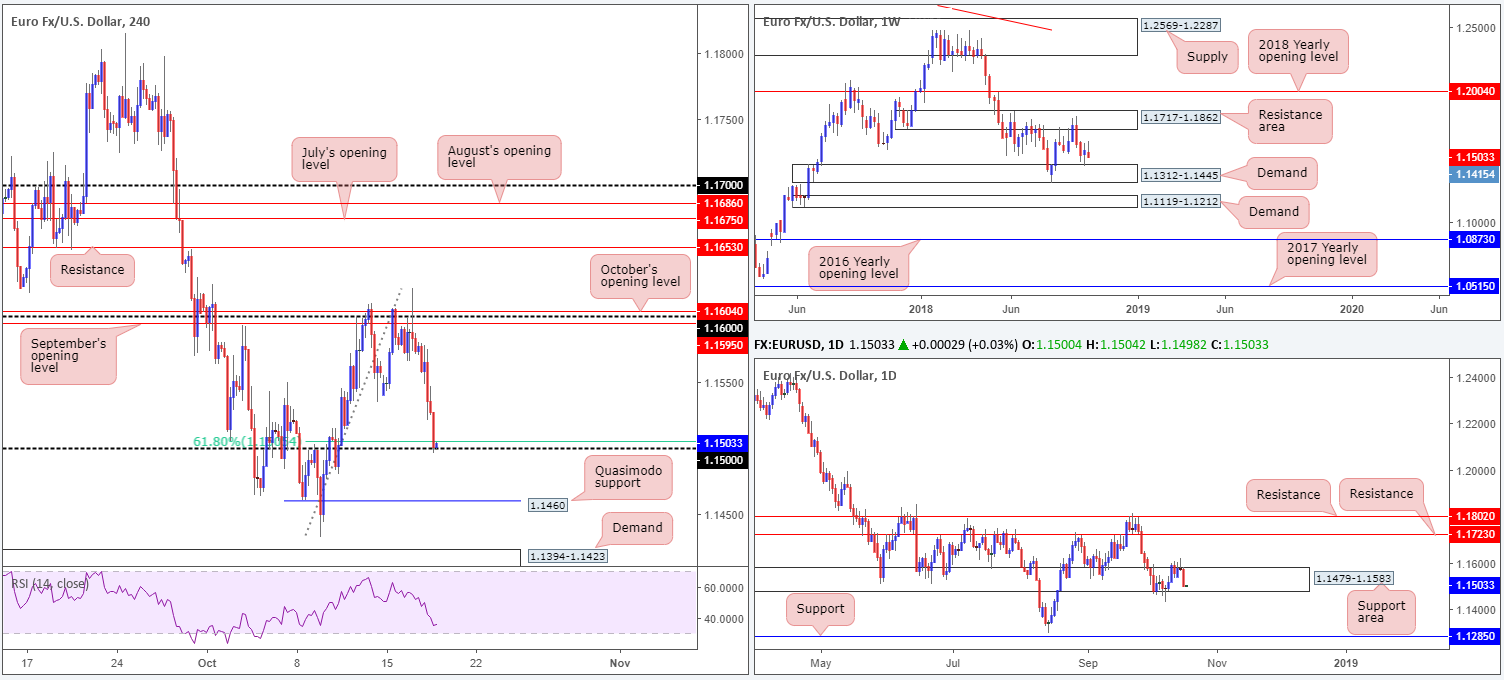
As of writing, the EUR/USD is seen flirting with its 1.15 handle after failing to reclaim 1.16. Beyond 1.15, H4 Quasimodo support at 1.1460 is eyed, followed closely by H4 demand coming in at 1.1394-1.1423. It may also be worth noting the H4 RSI indicator is seen fast approaching oversold territory.
Weekly demand at 1.1312-1.1445, although still holding ground, has yet to print anything of note to the upside. Last week’s action formed an indecision candle, albeit with a slight bullish tone. The daily support area at 1.1479-1.1583 currently has price knocking on the lower edge of its limit, thanks to yesterday’s near-full-bodied daily bear candle. A break beneath this area almost immediately brings the market back to the top edge of weekly demand mentioned above at 1.1312-1.1445.
Areas of consideration:
Buying from 1.15 is a chancy move according to our technical studies. While the number boasts additional support from a 61.8% H4 Fib support at 1.1505, there’s limited evidence backing a move from here on the higher timeframes at the moment.
In the event our analysis is correct, the pair could be in for a move below 1.15 towards nearby Quasimodo support on the H4 timeframe at 1.1460. Is this a tradable move? It is if you’re comfortable selling within the current daily support area, and are willing to take full profit off the table between 1.1460 and 1.1445 (the top edge of weekly demand).
Today’s data points: EU economic summit DAY 2; Philly Fed manufacturing index; FOMC member Quarles speaks.
GBP/USD:
Shedding over half a percent on Wednesday, cable suffered at the hands of lower-than-expected inflation numbers, along with ongoing Brexit-related anxiety. UK PM May briefed EU27 leaders on Wednesday evening at the EU summit on the current Brexit position. European Parliament head Tajani stated there was nothing new in content from PM May.
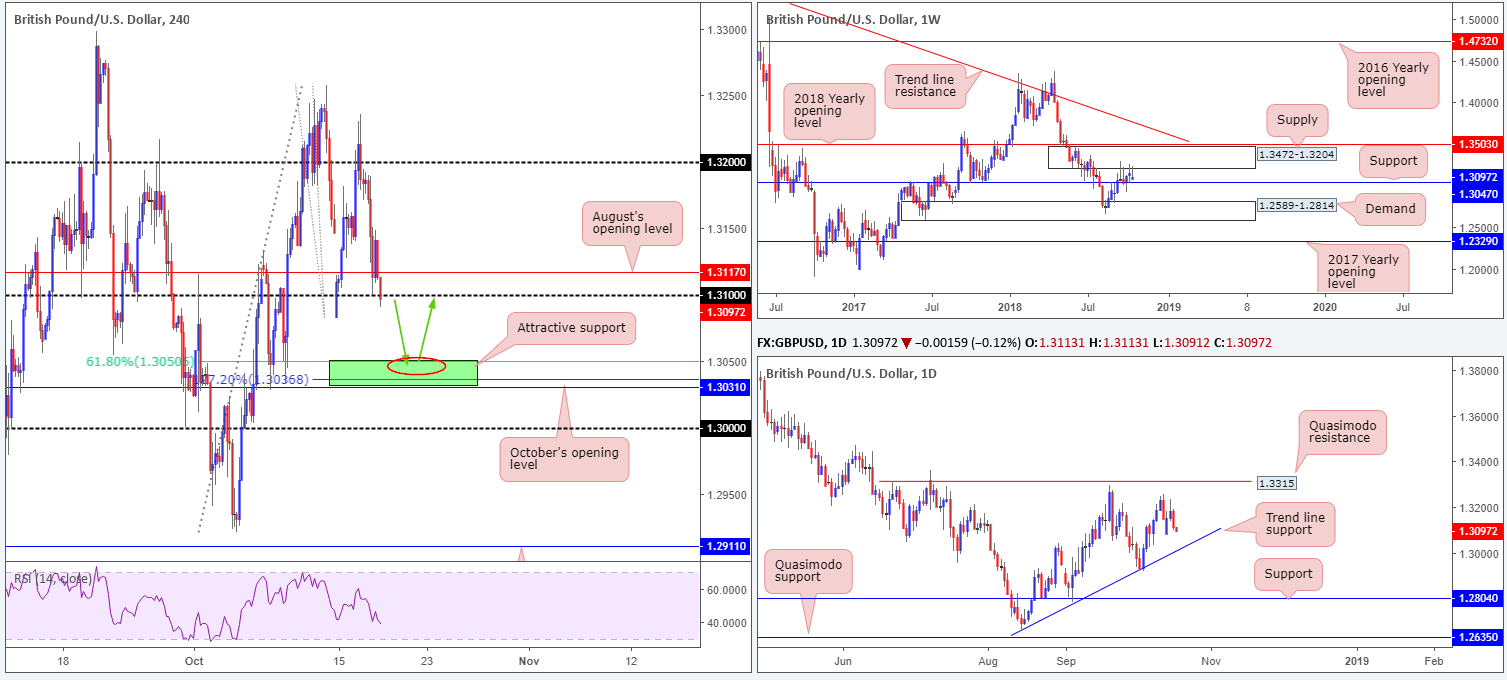
Recent trade has seen the H4 candles retest its 1.31 handle, despite an earnest attempt to defend this territory in US hours. This, according to our technical window, has firmly placed 1.3050 in the running for some action today.
The story on the weekly timeframe positions the market just ahead of support coming in at 1.3047, following price fading the underside of notable supply marked at 1.3472-1.3204. A closer look at price action on the daily chart draws attention to a Quasimodo resistance at 1.3315 and an ascending trend line support (etched from the low 1.2661).
Areas of consideration:
The green H4 zone marked at 1.3031-1.3050 is of interest for potential longs today. Comprised of October’s opening level at 1.3031, a 127.2% H4 Fib ext. point at 1.3036, a 61.8% H4 Fib support at 1.3050 and weekly support mentioned above at 1.3047, the odds of this zone holding ground for at least a bounce back towards 1.31ish is high.
Aggressive traders will likely enter long from 1.3050 with stops plotted a few pips beneath 1.3031. This is a chancy play, though could work out handsomely should we retest 1.31.
Conservative traders, on the other hand, may opt for entry based on additional H4/H1 candlestick confirmation: a bullish pin-bar formation or engulfing pattern etc. Besides offering traders entry/stop parameters, a bullish pattern out of the H4 buy zone helps ‘confirm’ buyer intent.
Today’s data points: UK retail sales m/m; EU economic summit DAY 2; Philly Fed manufacturing index; FOMC member Quarles speaks.
AUD/USD:
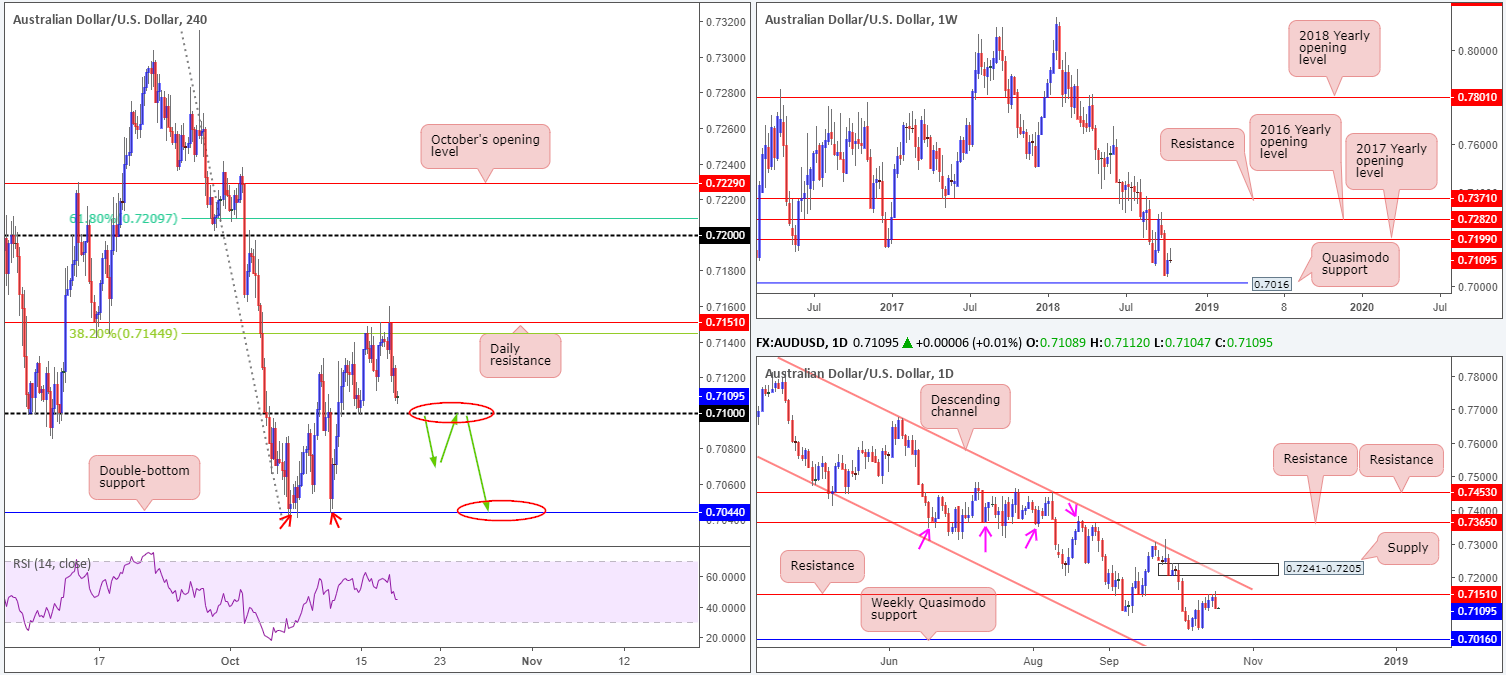
The Australian dollar came under renewed pressure in recent sessions, pulling back from 2-week highs of 0.7159. Hefty daily resistance at 0.7151, along with a 38.2% H4 Fib resistance at 0.7144 and a robust US dollar, dragged the AUD/USD beneath Tuesday’s low of 0.7112, and placed the market within striking distance of 0.71.
While the H4 candles appear set to grapple with 0.71, traders are urged to consider where we’re coming from on the daily timeframe: resistance mentioned above at 0.7151 in the shape of a bearish ENGULFING pattern! This is a strong bearish signal which could bring the H4 candles sub 0.71 today.
Areas of consideration:
Keeping it Simple Simon this morning, rather than looking to fade 0.71, a break of this number to the downside is expected given daily structure. A H4 close beneath 0.71 that’s followed up with a retest in the shape of a H4 bearish candlestick formation is, according to our studies, a high-probability short, targeting H4 double-bottom support at 0.7044 as the initial port of call.
On the data front, however, early Asia brings with it employment figures out of Australia, which is considered a HIGH-impacting event. Therefore, trade with caution.
Today’s data points: Australian employment figures; Philly Fed manufacturing index; FOMC member Quarles speaks.
USD/JPY:
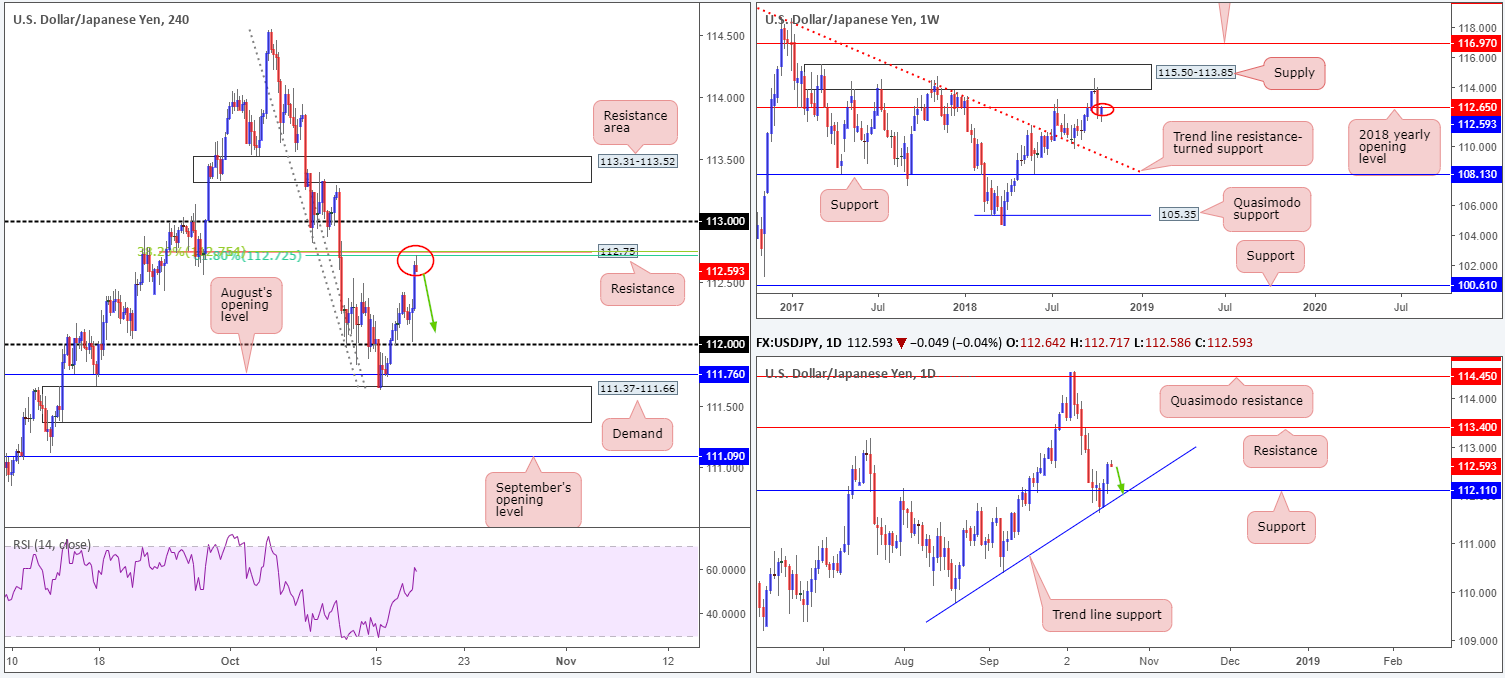
Amid early US hours on Wednesday, the H4 candles came within a stone’s throw away of retesting 112 as support. Leaving the psychological barrier unchallenged, the pair formed a relatively attractive bullish pin-bar formation and pushed for higher ground. Bolstered by yesterday’s FOMC meeting minutes for September, price action concluded trade just south of resistance plotted at 112.75.
As is evident from the weekly timeframe, recent bidding has brought the unit towards the 2018 yearly opening level at 112.65. While weekly players will likely attempt to defend this zone, daily buyers appear to have eyes on resistance drawn from 113.40 after retaking resistance at 112.11 (now acting support).
Areas of consideration:
In view of the current H4 resistance at 112.75 and nearby weekly resistance at 112.65, it’s likely we’ll see a rotation to the downside from here today. In addition to H4/weekly resistance, traders are also urged to take into account the two close-knit H4 Fibonacci resistances at 38.2%/61.8% at 112.75 and 112.72, respectively.
Should the current H4 candle close as is, this is, given the confluence noted above, considered a strong sell signal, targeting daily support at 112.11, followed closely by the 112 handle on the H4 timeframe.
Today’s data points: Philly Fed manufacturing index; FOMC member Quarles speaks; BoJ Gov. Kuroda speaks.
USD/CAD:
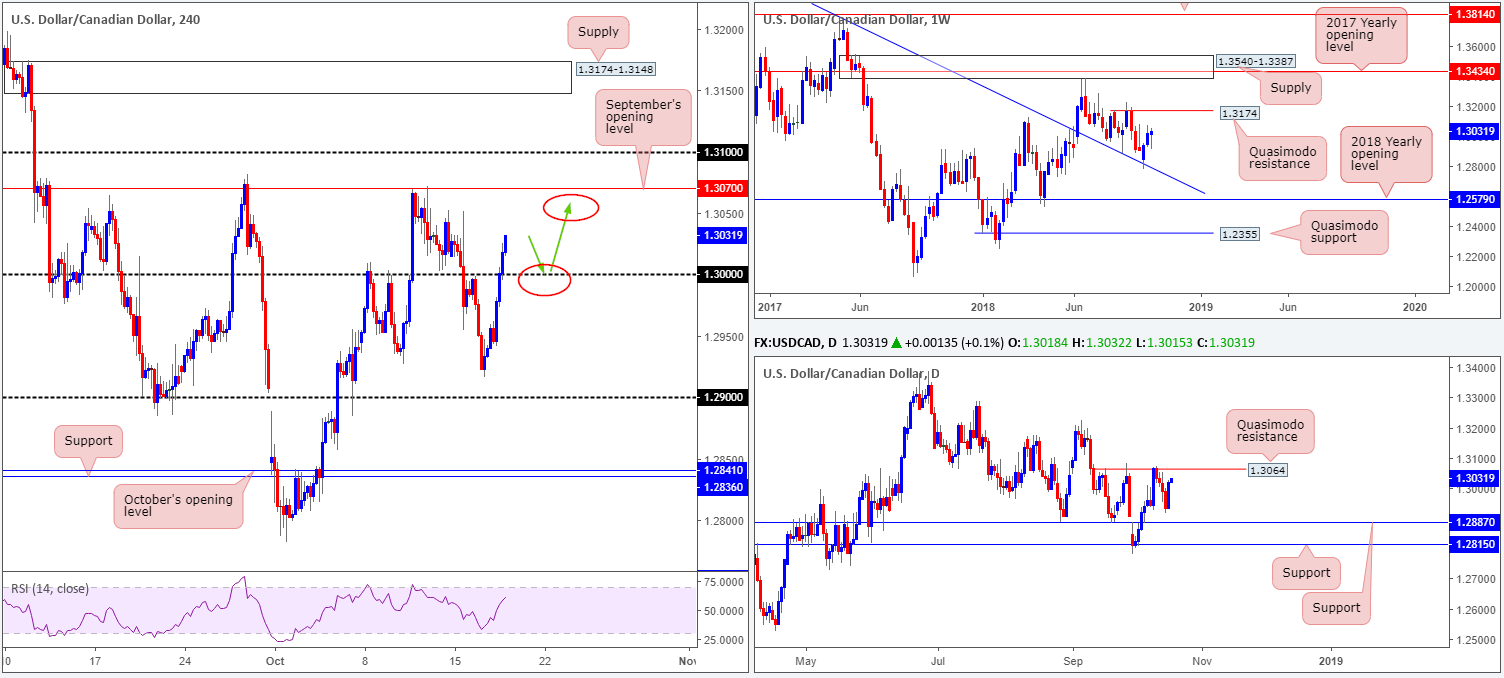
Supported by broad-based USD buying, along with crude pulling the CAD lower, the USD/CAD reclaimed its key figure 1.30 to the upside on Wednesday. Lower-than-expected Canadian manufacturing sales in August was largely ignored.
Up 0.65% on the day, the H4 candles appear poised to extend yesterday’s gains towards September’s opening level printed at 1.3070, shadowed closely by 1.31. Before reaching 1.3070, however, daily Quasimodo resistance at 1.3064 may obstruct upside. In terms of where the market stands on the weekly scale, scope for further buying is also present, targeting Quasimodo resistance plotted at 1.3174.
Areas of consideration:
Having seen all three timeframes emphasize a reasonably strong upside bias this morning, a retest of 1.30 could be in store.
A retest of 1.30 as support by way of a H4 bullish candlestick formation would, according to the overall technical picture, be considered a high-probability buy signal, targeting 1.3064 (daily Quasimodo resistance) as the initial take-profit zone.
Traders are urged to keep risk/reward in mind here – look to achieve at least a 1:2 ratio to 1.3064!
Today’s data points: Philly Fed manufacturing index; FOMC member Quarles speaks.
USD/CHF:
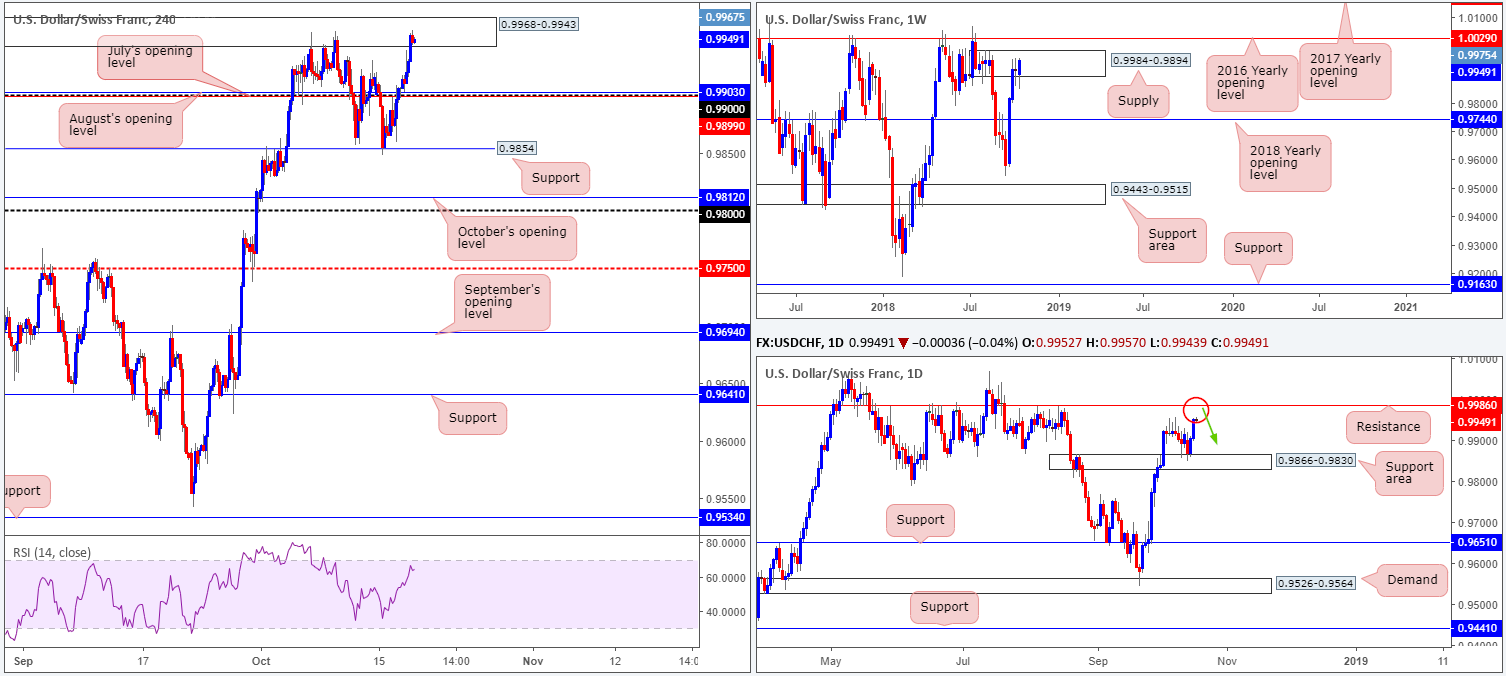
Across the board, USD buyers went on the offensive during Wednesday’s sessions, consequently lifting the USD/CHF into positive territory for a second consecutive day, up 0.47%.
H4 price, as you can see, is seen shaking hands with supply coming in at 0.9968-0.9943. This zone has held price lower on a number occasions in recent trade, and rightly so – it’s positioned within the upper limits of weekly supply at 0.9984-0.9894. A break of the current H4 supply today places daily price within striking distance of resistance at 0.9986 – positioned two pips above the aforementioned weekly supply.
Areas of consideration:
Although a sell from the current H4 supply is tempting, the strength of the buyers over the past couple of days may drive price higher. A push towards the current daily resistance, which is what we feel is likely in store, will cause an incredible amount of pain in terms of stop-loss orders being hit above both H4 and weekly supplies.
Based on the above reading, shorts from daily resistance at 0.9986 is certainly an option, with conservative stop-loss orders positioned above the 2016 yearly opening level at 1.0029 on the weekly timeframe. In terms of downside targets from here, the 0.99 handle appears a logical first step, according to the overall technical picture.
Today’s data points: Philly Fed manufacturing index; FOMC member Quarles speaks.
Dow Jones Industrial Average:
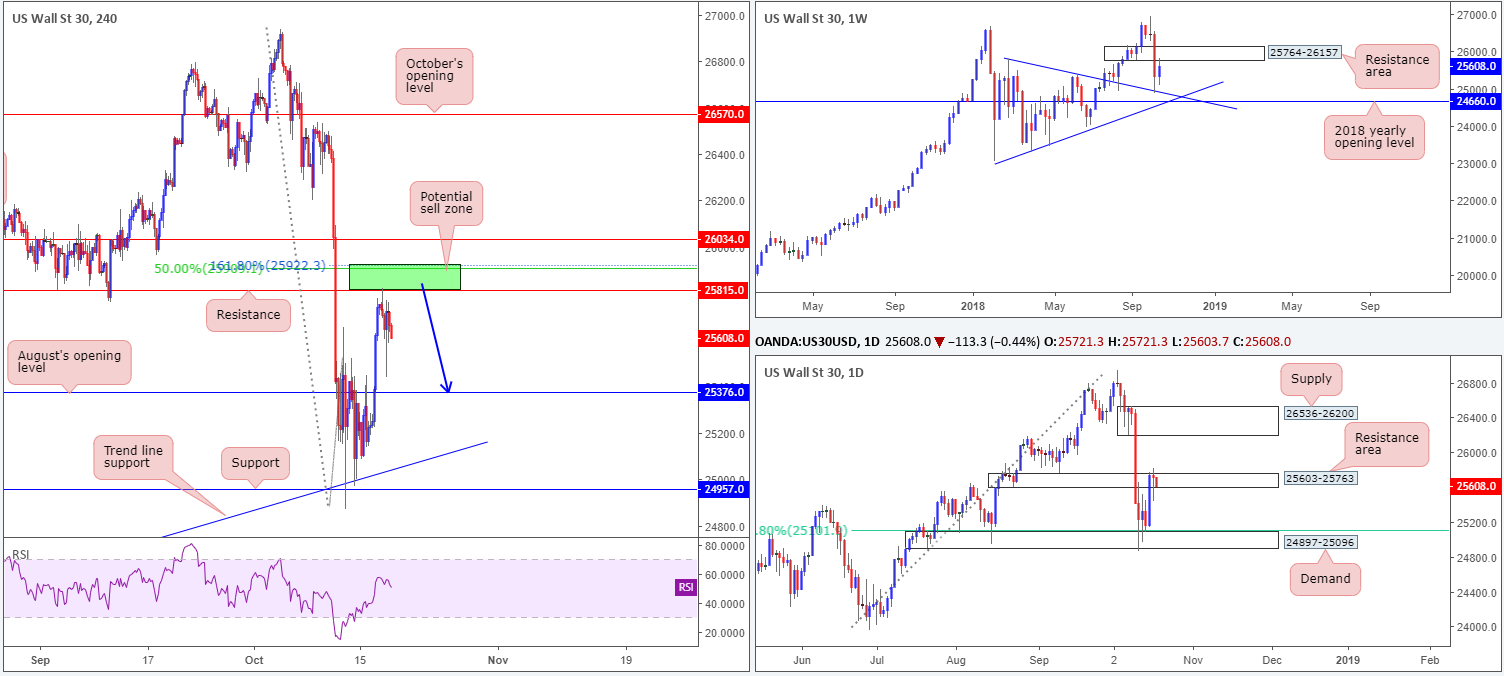
In recent sessions, US equities emphasized indecision as US-China trade tensions weighed on market sentiment, along with WTI pressuring energy stocks lower.
For those who read Wednesday report you may recall the team highlighted H4 resistance at 25815 – coupled with a 161.8% H4 Fib ext. point at 25922, a 50.0% H4 resistance value at 25909 and current higher-timeframe resistance areas at 25764-26157 (weekly) and 25603-25763 (daily) – formed a high-probability sell zone (Green).
Well done to any of our readers who managed to jump aboard this move! Traders have likely reduced risk to breakeven (some even taking partial profits), with most likely eyeing a retest of August’s opening level at 25376 as a take-profit target.
Areas of consideration:
Aside from Wednesday’s H4 sell zone at 25922-25815, shorts beyond August’s opening level mentioned above on the H4 timeframe at 25376 are also something to keep eyes on today. A break/retest of this barrier has H4 trend line support (etched from the low 23451) to target, followed by a 61.8% daily Fib support at 25101 (positioned just north of daily demand at 24897-25096).
Today’s data points: Philly Fed manufacturing index; FOMC member Quarles speaks.
XAU/USD (Gold):
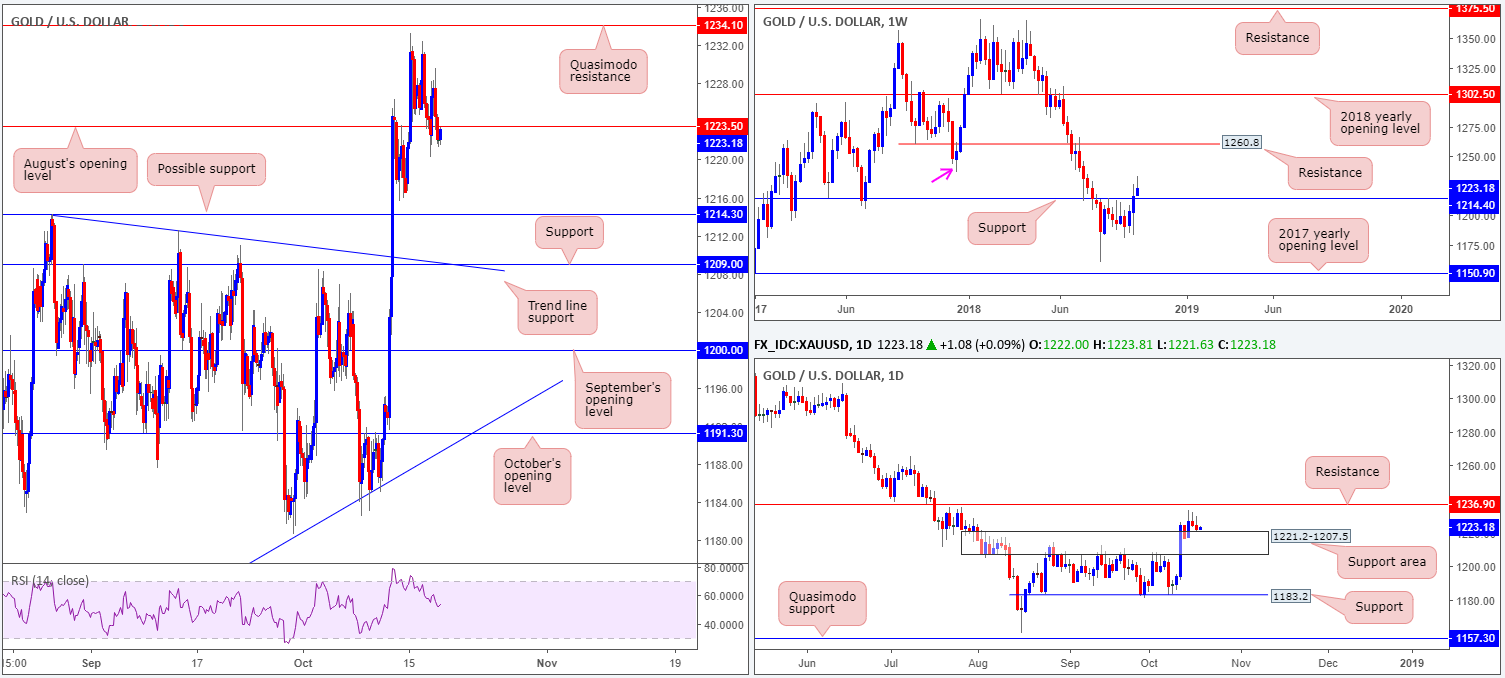
With USD markets broadly heading for higher ground on Wednesday, the price of gold explored lower levels.
Starting with weekly price, we can clearly see the unit pulling back from weekly highs of 1233.0 (although still up 0.44% on the week), targeting a possible retest of support at 1214.4. The next upside target on the weekly scale does not come into view until swing resistance at 1236.6 (pink arrow), though the majority of eyes are likely honed in on resistance chiseled in at 1260.8.
Daily movement, on the other hand, is seen testing the top edge of a supply-turned support area at 1221.2-1207.5. Whether this will be enough to infuse a bit of oomph into the buyers here and bring the market towards daily resistance at 1236.9 (essentially the same barrier as the weekly swing resistance at 1236.6) is difficult to judge given the back-to-back selling wicks recently printed.
A closer look at price action on the H4 timeframe, however, saw the candles take out support in the form of August’s opening level at 1223.5. As a consequence, support emerging from 1214.3 (August 28 high and effectively the same barrier as weekly support at 1214.4), and also at 1209.0 (intersects with a trend line resistance-turned support taken from the high 1214.3) are now in view.
Areas of consideration:
Longs from H4 support at 1214.3 and also at 1209.0 could be an option today. Note both levels are housed within the aforementioned daily support area.
Judging which support is worthy of a long is difficult as both are viable. To help decide, traders may want to consider waiting for H4 candlestick confirmation to take shape before pulling the trigger. Not only will this provide entry/stop parameters, it’ll also help display buyer intent.
The use of the site is agreement that the site is for informational and educational purposes only and does not constitute advice in any form in the furtherance of any trade or trading decisions.
The accuracy, completeness and timeliness of the information contained on this site cannot be guaranteed. IC Markets does not warranty, guarantee or make any representations, or assume any liability with regard to financial results based on the use of the information in the site.
News, views, opinions, recommendations and other information obtained from sources outside of www.icmarkets.com.au, used in this site are believed to be reliable, but we cannot guarantee their accuracy or completeness. All such information is subject to change at any time without notice. IC Markets assumes no responsibility for the content of any linked site. The fact that such links may exist does not indicate approval or endorsement of any material contained on any linked site.
IC Markets is not liable for any harm caused by the transmission, through accessing the services or information on this site, of a computer virus, or other computer code or programming device that might be used to access, delete, damage, disable, disrupt or otherwise impede in any manner, the operation of the site or of any user’s software, hardware, data or property.


