
Key risk events today:
Australia Employment Change and Unemployment Rate; BoJ Monetary Policy Statement and Press Conference; (BoE) MPC Official Bank Rate Votes; BoE Monetary Policy Summary, Official Bank Rate, MPC Asset Purchase Facility and Asset Purchase Facility; Canada ADP Non-Farm Employment Change; Philly Fed Manufacturing Index; US Unemployment Claims.
(Previous analysis as well as outside sources – italics).
EUR/USD:
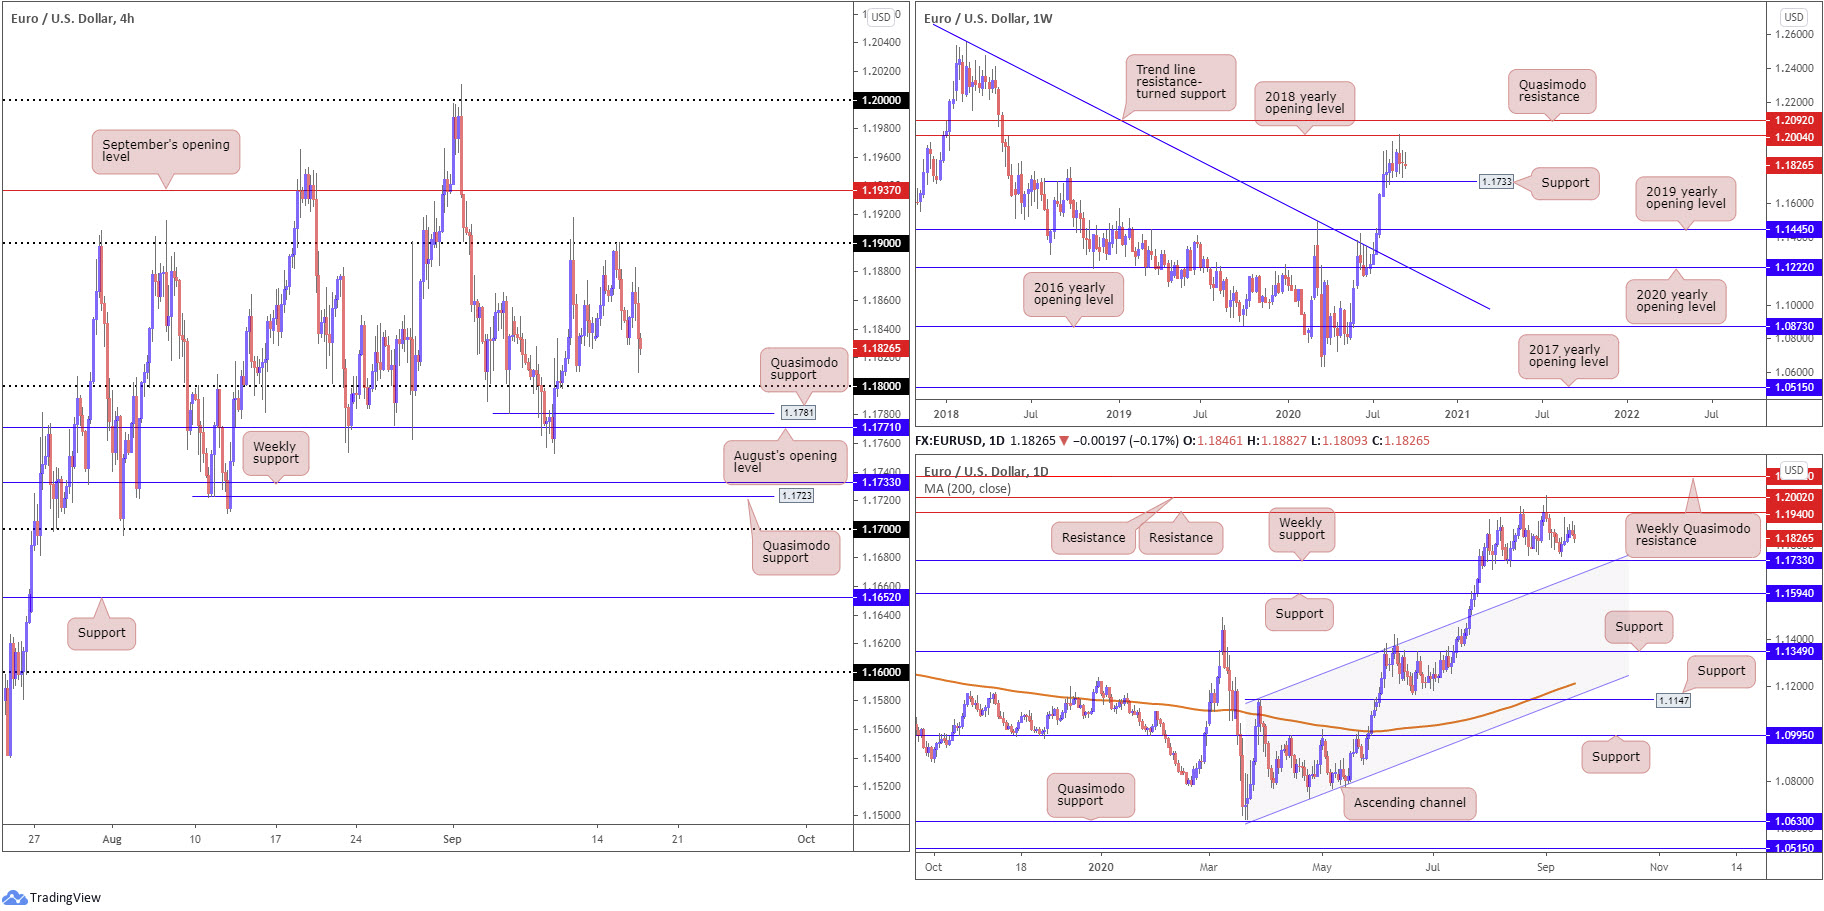
EUR/USD continues to dance mid-way between 1.19 and 1.18 on the H4, therefore limited technical change occurred Wednesday.
Above 1.19, September’s opening value is seen at 1.1937; to the downside, beyond 1.18, Quasimodo support at 1.1781 is visible, followed by August’s opening level at 1.1771.
Further afield, weekly support is seen at 1.1733, a previous Quasimodo resistance; resistance on the weekly scale can be found at 1.2004, the 2018 yearly opening value sited just south of Quasimodo resistance priced in at 1.2092. Also clear on the weekly scale is the month of July witnessed vigorous upside, overthrowing trend line resistance, taken from the high 1.2555, and the 2019 yearly opening value at 1.1445.
Since transitioning into the month of August on the daily timeframe, weekly support, mentioned above at 1.1733, has proved useful, as has daily resistance coming in at 1.1940 and 1.2002. Passing 1.2002 on the daily timeframe shifts focus to the weekly Quasimodo resistance mentioned above at 1.2092, whereas dipping sub 1.1733 on the daily scale could see price make its way to channel resistance-turned support, extended from the high 1.1147.
Areas of consideration:
Outlook unchanged.
- A fakeout through 1.18 into H4 Quasimodo support from 1.1781 and August’s opening level at 1.1771 could be in store. Tripping sell-stop liquidity under 1.18, and luring any fresh buyers off noted H4 supports, may be enough to generate a H4 close back above 1.18, creating a possible intraday buy signal.
- The same can be seen above 1.19 on the H4, though right now the round number is proving a tough nut to crack. Piercing 1.19 and testing September’s opening level at 1.1937 (tripping buy-stop liquidity above the round number) may force a H4 close back under 1.19 and promote a bearish scenario. Note September’s opening level forms a close connection with daily resistance at 1.1940.
GBP/USD:
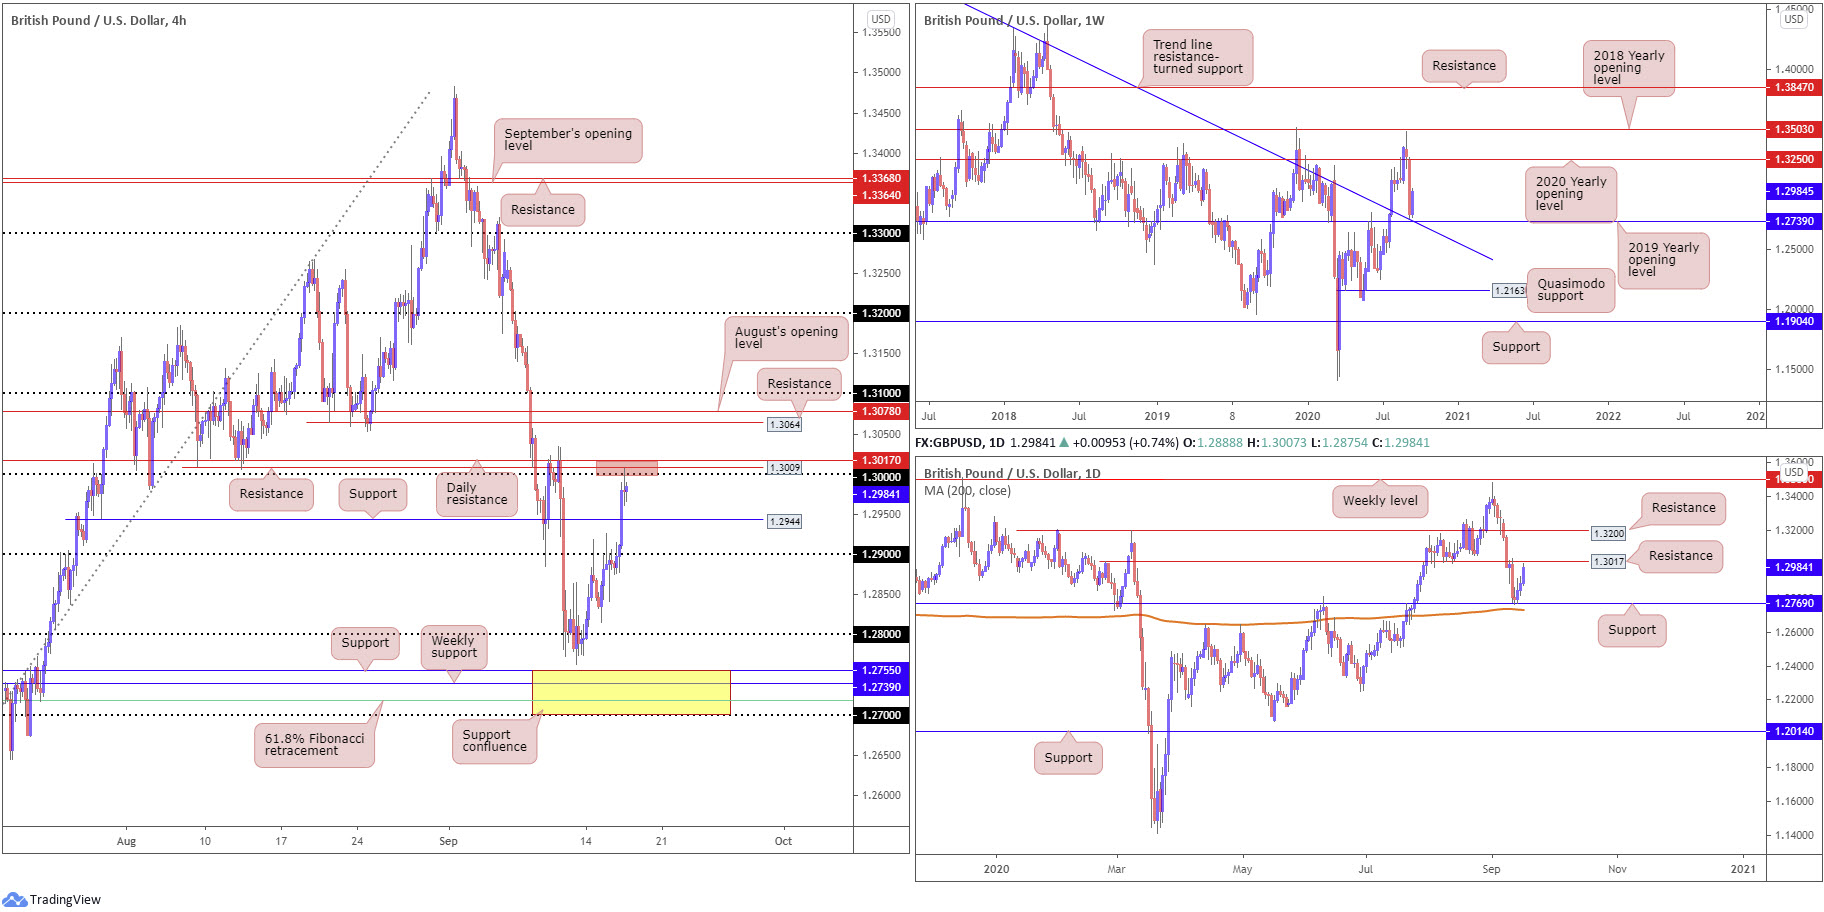
GBP/USD finally mustered enough oomph to overthrow 1.29 on the H4, taking on resistance at 1.2944 (now serving support) and shaking hands with the key figure 1.30. UK CPI data exhibited an upbeat tone, though the obvious catalyst behind the pound’s recent strength was USD softness.
1.30 not only represents a widely watched level in this market, it comes with additional H4 resistance at 1.3009 and daily resistance seen at 1.3017, in view thanks to the recent recovery from daily support priced in at 1.2769.
Weekly price is making a stand just north of support in the form of the 2019 yearly opening level at 1.2739 and aligning trend line resistance-turned support, extended from the high 1.5930. Technical studies project room to advance as far north as the 2020 yearly opening level at 1.3250.
Areas of consideration:
Bearish themes could develop off 1.3017/1.30 (H4 red) today, targeting support at 1.2944 as an initial take-profit zone. Having noted weekly price displaying promise ahead of support at 1.2739, sellers out of 1.3017/1.30 will likely reduce risk to breakeven at 1.2944 and bank partial profits. The next downside target rests around the 1.29 point (H4).
AUD/USD:
For those who read recent technical writing you may recall the following (italics):
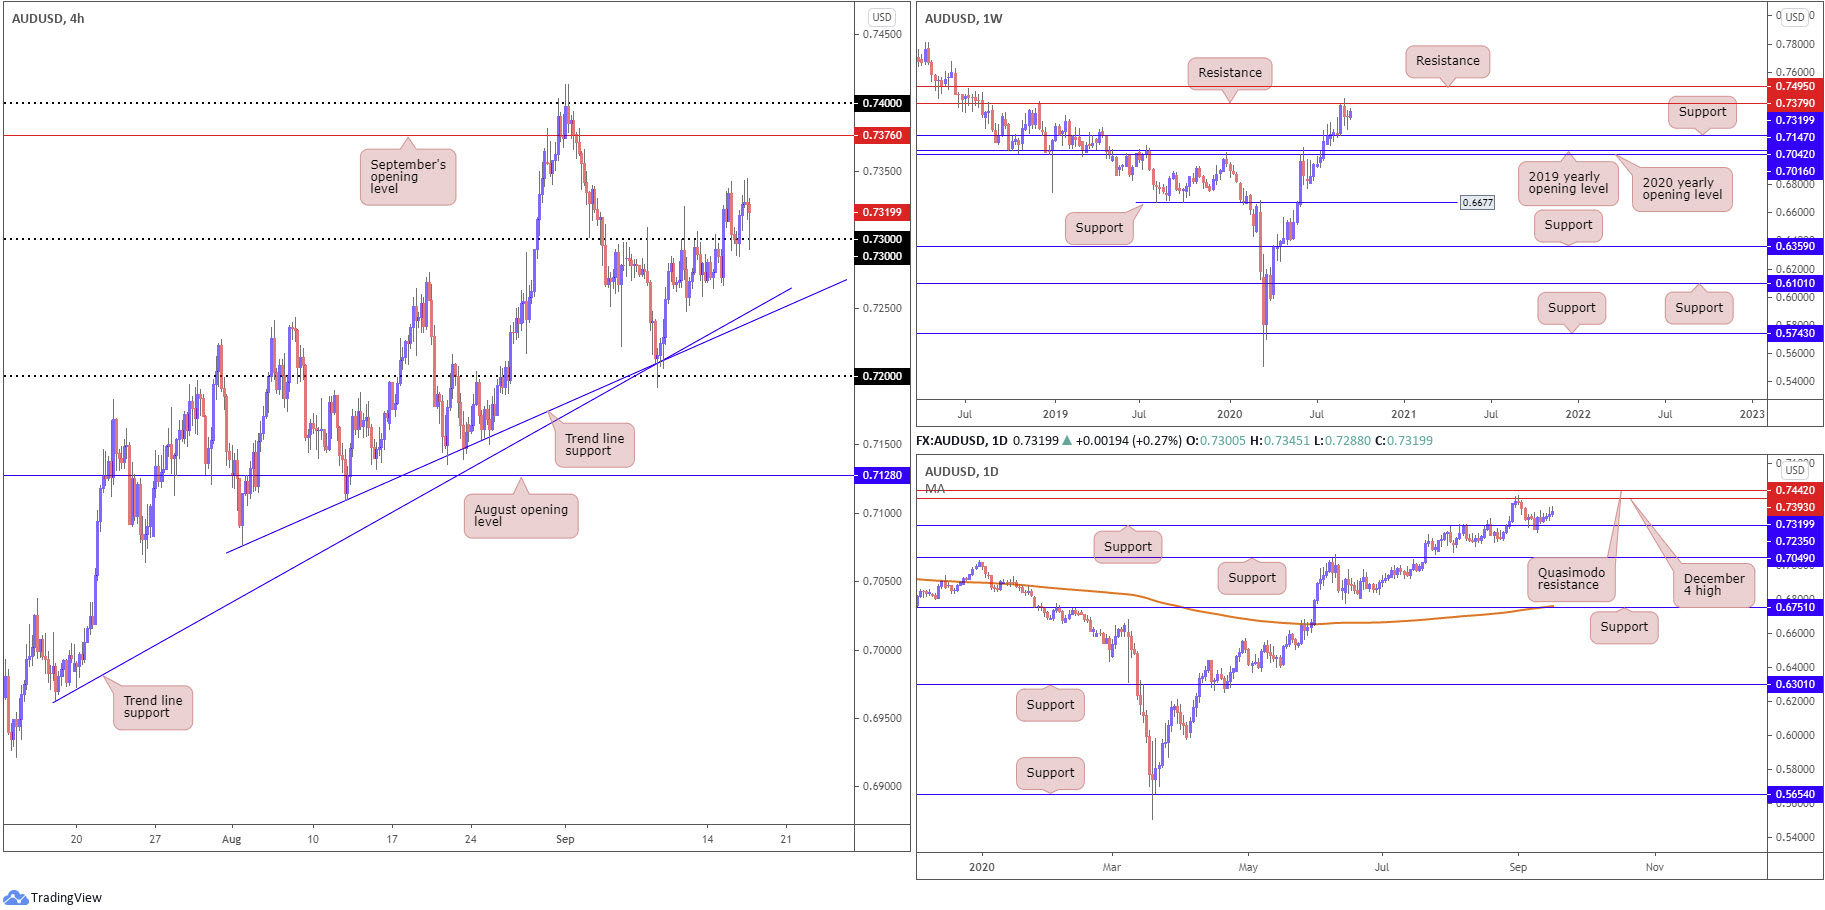
As evident from the H4 chart this morning, AUD/USD latched onto a healthy bid Tuesday, ripping through any defence 0.73 had in place. Peaks of 0.7342 were achieved before the pair reclaimed earlier gains and retested 0.73 as support.
0.73 remained supportive Wednesday, withstanding a recent downside attempt. Continuing to defend the round number swerves September’s opening level at 0.7376 into the firing range on the H4, followed by weekly resistance at 0.7379 along with daily resistance (Dec 4 high) from 0.7393, and then 0.74 (H4).
The weekly timeframe’s picture (unchanged):
Sellers south of resistance at 0.7379 failed to sustain downside momentum past 0.7191 in recent trading, leaving nearby support from 0.7147 unchallenged. Having seen this market trend higher since bottoming at 0.5506 in late March, the odds of price surging through current resistance and heading for another layer of resistance at 0.7495 are high. Exploring territory under current support, however, shines focus on the 2020 and 2019 yearly opening levels at 0.7016 and 0.7042, respectively.
The daily timeframe:
Price has so far gleaned moderate support from 0.7235. Resistance at 0.7393 (December 4 high) commands attention in the event further bidding develops, a level that capped upside heading into September ahead of Quasimodo resistance at 0.7442. Overthrowing 0.7235 shifts attention to as far south as support at 0.7049.
Areas of consideration:
Conservative buyers are still likely weighing up the odds of entering into a long position from the recent 0.73 retest. Technically, there’s room for buyers to stretch their legs from here until reaching September’s opening level at 0.7376 on the H4. Should the current H4 candle close as is, in the shape of a hammer candlestick pattern, this may be adequate enough to tempt bids.
USD/JPY:
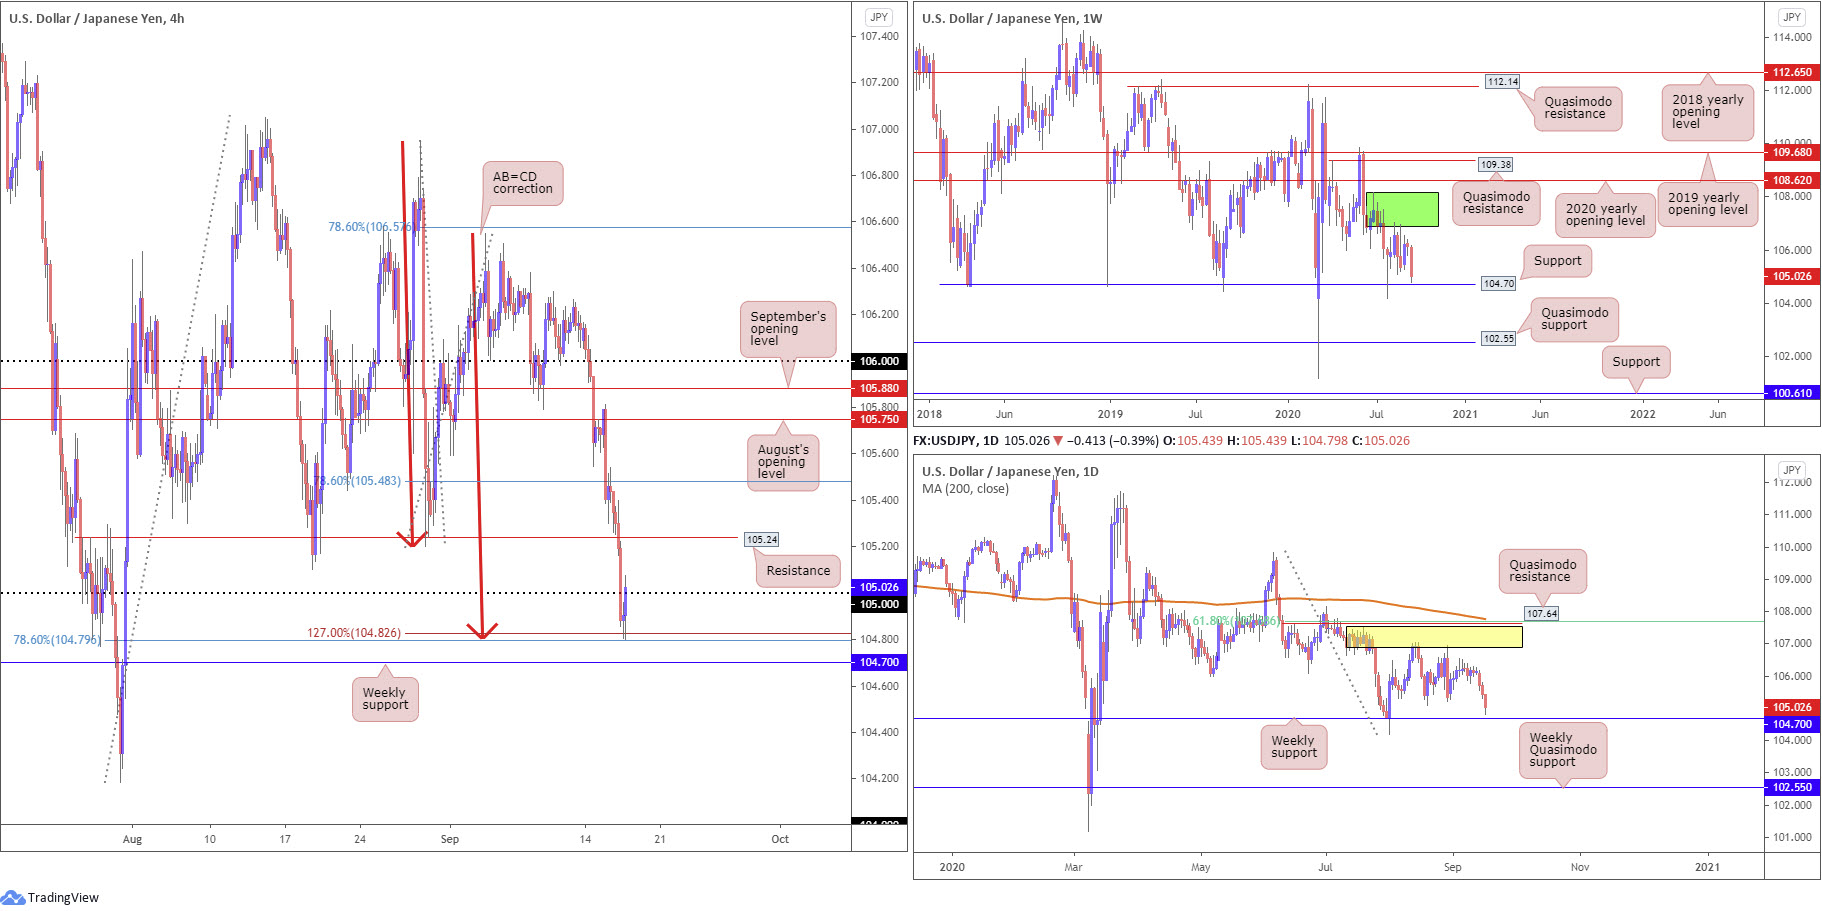
As of writing, USD/JPY is staging a moderate recovery off session lows around 104.80. Technically, the move is reinforced by a H4 AB=CD (red arrows) correction (and 1.27 BC projection at 104.82). Note this formation also gleans additional support from a 78.6% H4 Fibonacci retracement ratio at 104.79, with weekly support priced just south of the level at 104.70.
Supply remains prominent at 108.16-106.88 (dark green) on the weekly timeframe, capping upside since price made its way off support mentioned above at 104.70 at the end of July. Should buyers eventually govern control, the 2020 yearly opening level at 108.62 may eventually enter view, closely tracked by Quasimodo resistance at 109.38 and the 2019 yearly opening level at 109.68.
Daily supply at 107.55/106.89 (yellow), an area housed within the lower boundary of weekly supply mentioned above at 108.16-106.88, has proved tough to overthrow. Downside, as you can see, recently threw price within touching distance of weekly support underlined above at 104.70. In the event buyers climb, Quasimodo resistance is stationed at 107.64, reinforced by a 61.8% Fibonacci retracement ratio at 107.68 and 200-day SMA (orange – 107.77).
Areas of consideration:
Should we regain footing back above 105 today on the H4, traders may interpret this as a bullish cue to approach H4 resistance at 105.24. Downside risk remains, however, since weekly support at 104.70 still likely calls for attention. Therefore, prospective buyers may hold fire and wait and see if the candles cross swords with the weekly support level before pulling the trigger.
USD/CAD:
USD/CAD trimmed earlier losses Wednesday, finishing the session mostly unmoved.
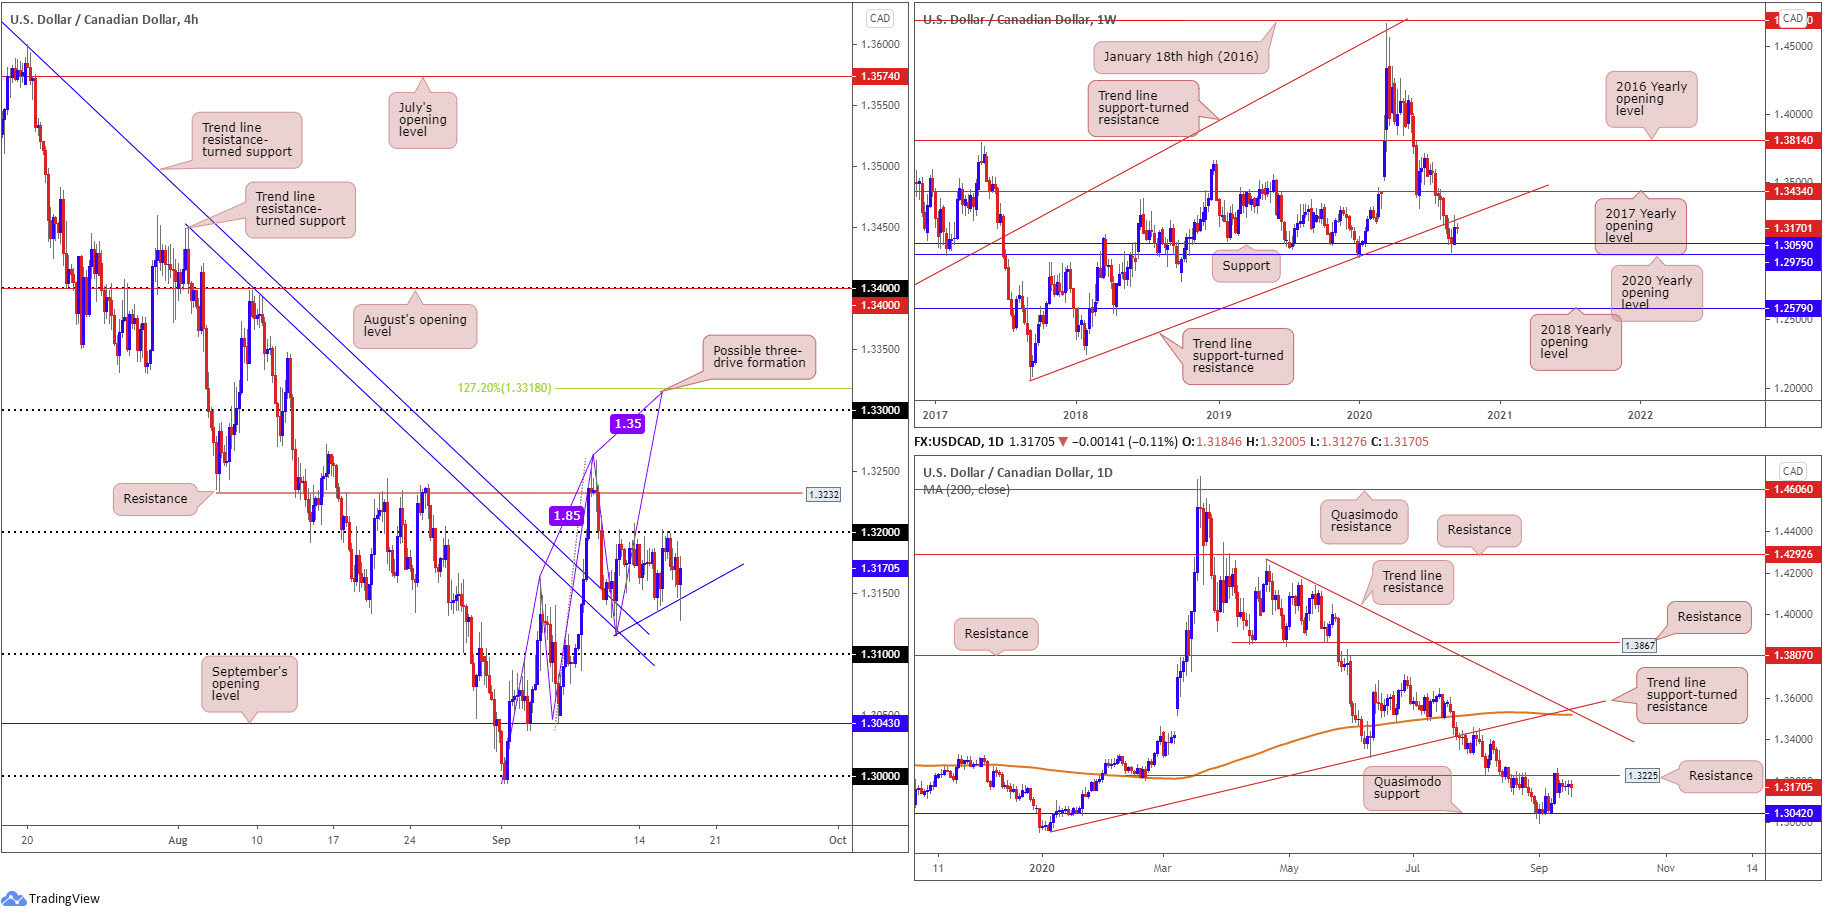
As shown on the H4 timeframe, and aired in recent technical writing, the pair has been caught within a range south of 1.32 since last Thursday’s recovery from two trend line resistances-turned support, extended from highs 1.3646 and 1.3451. Given the above, our technical outlook remains unchanged, therefore the following will echo thoughts put forward in Wednesday’s technical briefing.
Brushing aside 1.32 on the H4 turns attention back to resistance at 1.3232, with a break perhaps exposing the 1.33 handle and a possible three-drive completion at the 127.2% Fibonacci extension point from 1.3318. Traders may also wish to acknowledge the H4 resistance boasts a close connection with daily resistance at 1.3225.
From the weekly timeframe:
Snapping an eight-week bearish phase, USD/CAD staged a stronger-than-expected recovery last week off support at 1.3059 (pinned just north of the 2020 yearly opening level at 1.2975). This led to trend line support-turned resistance, taken from the low 1.2061, making an appearance, commanding enough of a presence to generate a mild end-of-week correction. Continued upside highlights the 2017 yearly opening level at 1.3434 as potential resistance.
From the daily timeframe:
Quasimodo support at 1.3042 has remained notable since the beginning of September, with the buck latching onto a strong bid in early trading last week to shake hands with resistance mentioned above at 1.3225, a prior Quasimodo support. Interest from the aforementioned resistance was expected having seen the level merge with weekly trend line resistance. In terms of resistance beyond 1.3225, we do not see much to hang our hat on until crossing swords with trend line resistance, etched from the high 1.4265, which happens to align closely with trend line support-turned resistance, taken from the low 1.2957, and the 200-day SMA (orange – 1.3519). However, before reaching the said daily levels, we must contend with weekly resistance around 1.3434.
Areas of consideration:
Outlook unchanged due to the recent lacklustre performance.
On one side, weekly support at 1.3059 and daily Quasimodo support at 1.3042 recently made an appearance, prompting a bullish move. On the other side we also had weekly price test trend line resistance and daily price probe resistance from 1.3225.
With the above in mind, seeking bullish scenarios above 1.32 on the H4 could prove frustrating, hindered by daily resistance from 1.3225 and H4 resistance at 1.3232. A sell-off from 1.3232/1.32, therefore, could EVENTUALLY take hold, bolstered by weekly price recently engaging trend line resistance and the market trending lower since mid-March. H4 sellers may be waiting for a close to form beyond local trend line support, drawn from the low 1.3119.
Climbing above 1.3232, nevertheless, ignites possible bullish themes and places 1.33 (H4) in the firing range (and a three-drive pattern completion around 1.3318).
USD/CHF:
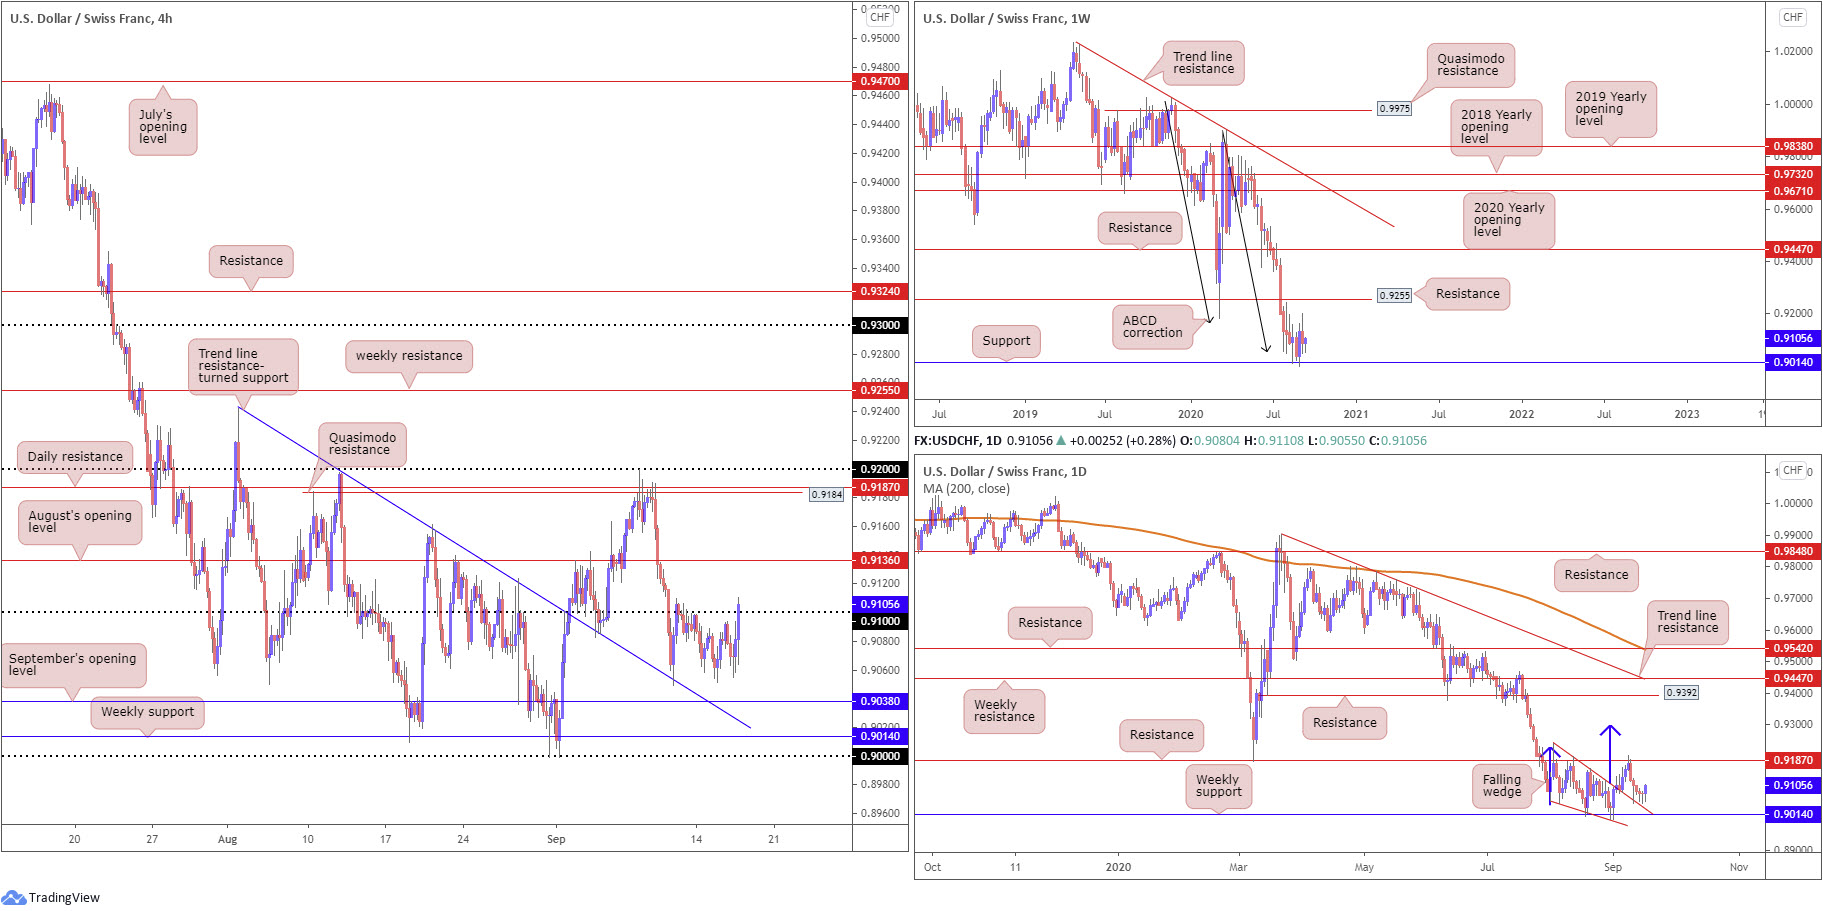
Following a subdued start to the week, the US dollar concluded higher against the Swiss franc Wednesday, recently overrunning the 0.91 handle on the H4.
Above 0.91, August’s opening value at 0.9136 steps in view, while brushing aside this base places H4 Quasimodo resistance at 0.9184 in sight and daily resistance at 0.9187.
Technical movement on the weekly timeframe shows buyers and sellers continue to battle for position north of support at 0.9014, potentially gleaning additional impetus from ABCD support at 0.9051 (black arrows). Resistance at 0.9255, a previous Quasimodo support level, calls for attention should we transition north.
The month of August on the daily timeframe chalked up a falling wedge pattern from the high 0.9241 and a low of 0.9056. The beginning of September saw the upper border of the falling wedge give way, consequently unlocking a bullish reversal signal. Resistance at 0.9187 swiftly put a lid on gains, however, directing moves to just north of the falling wedge. Should we see buyers build on Wednesday’s gains and eventually upset resistance at 0.9187, the falling wedge take-profit target could be the next port of call around 0.9294 (blue arrows). Dips, nonetheless, brings in weekly support at 0.9014.
Areas of consideration:
H4 dipping a toe in waters above 0.91 signals possible continuation to the upside today, targeting August’s opening level at 0.9136, with the prospect of additional upside pressure forcing price to touch gloves with daily resistance at 0.9187. Conservative buyers may seek a 0.91 retest before committing; others may be satisfied entering on a H4 close north of the round number.
Dow Jones Industrial Average:
After the Fed announced it’ll keep interest rates lower over the next few years, the Dow eked out modest gains Wednesday. However, the S&P 500 fell as tech stocks declined.
The Dow Jones Industrial Average advanced 36.78 points, or 0.13%; the S&P 500 dropped 15.71 points, or 0.46% and the Nasdaq traded lower by 139.85 points, or 1.25%.
For those who read Wednesday’s technical briefing you may recall the following based on the H4 chart (italics):
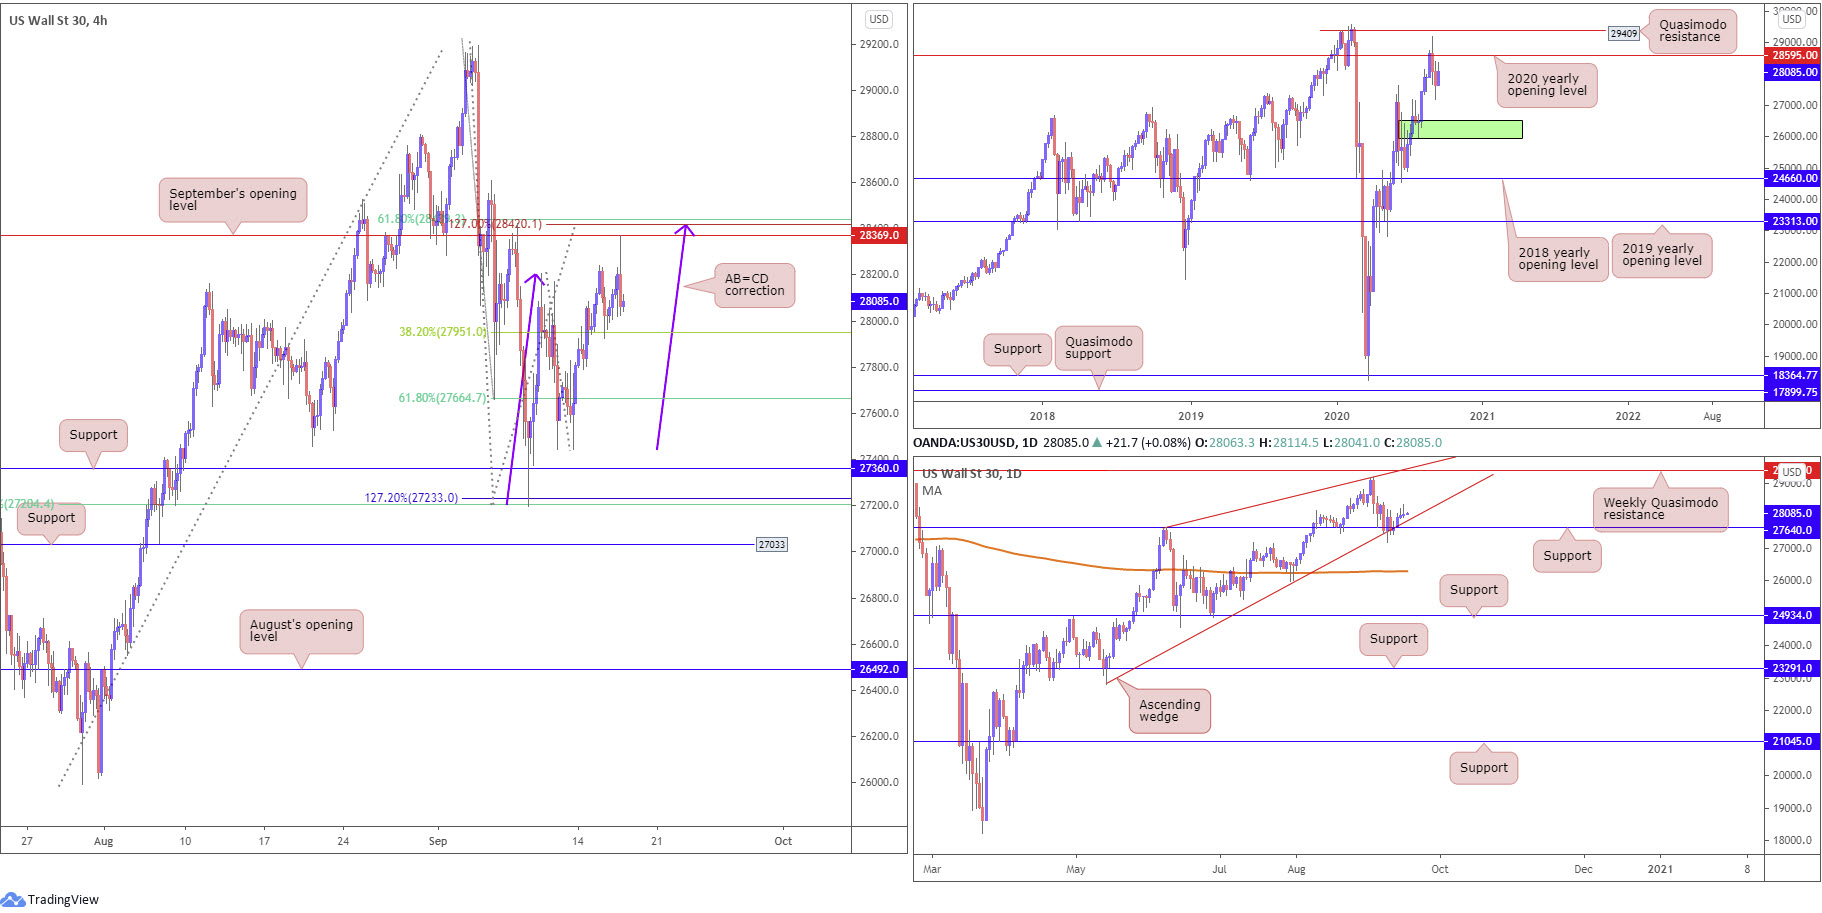
To the upside, September’s opening value at 28369 rests as possible resistance, joined by a 61.8% Fibonacci retracement ratio at 28436 and a potential AB=CD bearish pattern (purple arrows) at 28418, along with a 1.27 BC projection at 28420.
As evident from the H4 timeframe this morning, the unit clipped September’s opening value at 28369 in recent hours and pencilled in a healthy rotation.
Further out, weekly shows price holding south of the 2020 yearly opening value at 28595 (sited just under Quasimodo resistance at 29409). Additional bearish sentiment advertises demand (green) at 25916-26523, an area active buyers may try and defend.
From the daily timeframe, the lower limit of an ascending wedge, taken from the low 22803, along with support from 27640, continues to bolster the unit. Rupturing the aforementioned supports could lead to price crossing paths with the 200-day SMA (orange – 26299), while a recovery positions the 2020 yearly opening level at 28595 (weekly timeframe) in range.
Areas of consideration:
Logical downside targets from September’s opening value can be seen at the 38.2% Fibonacci retracement ratio at 27951 (taken from the AB=CD formation), followed by the 61.8% Fibonacci base at 27664. Note the latter is arranged just north of daily support mentioned above at 27640, therefore active buying from this space is perhaps in the offing should we reach this far south.
XAU/USD (GOLD):
Spot gold finished Wednesday off session peaks at $1,973, effectively mirroring Tuesday’s segment.
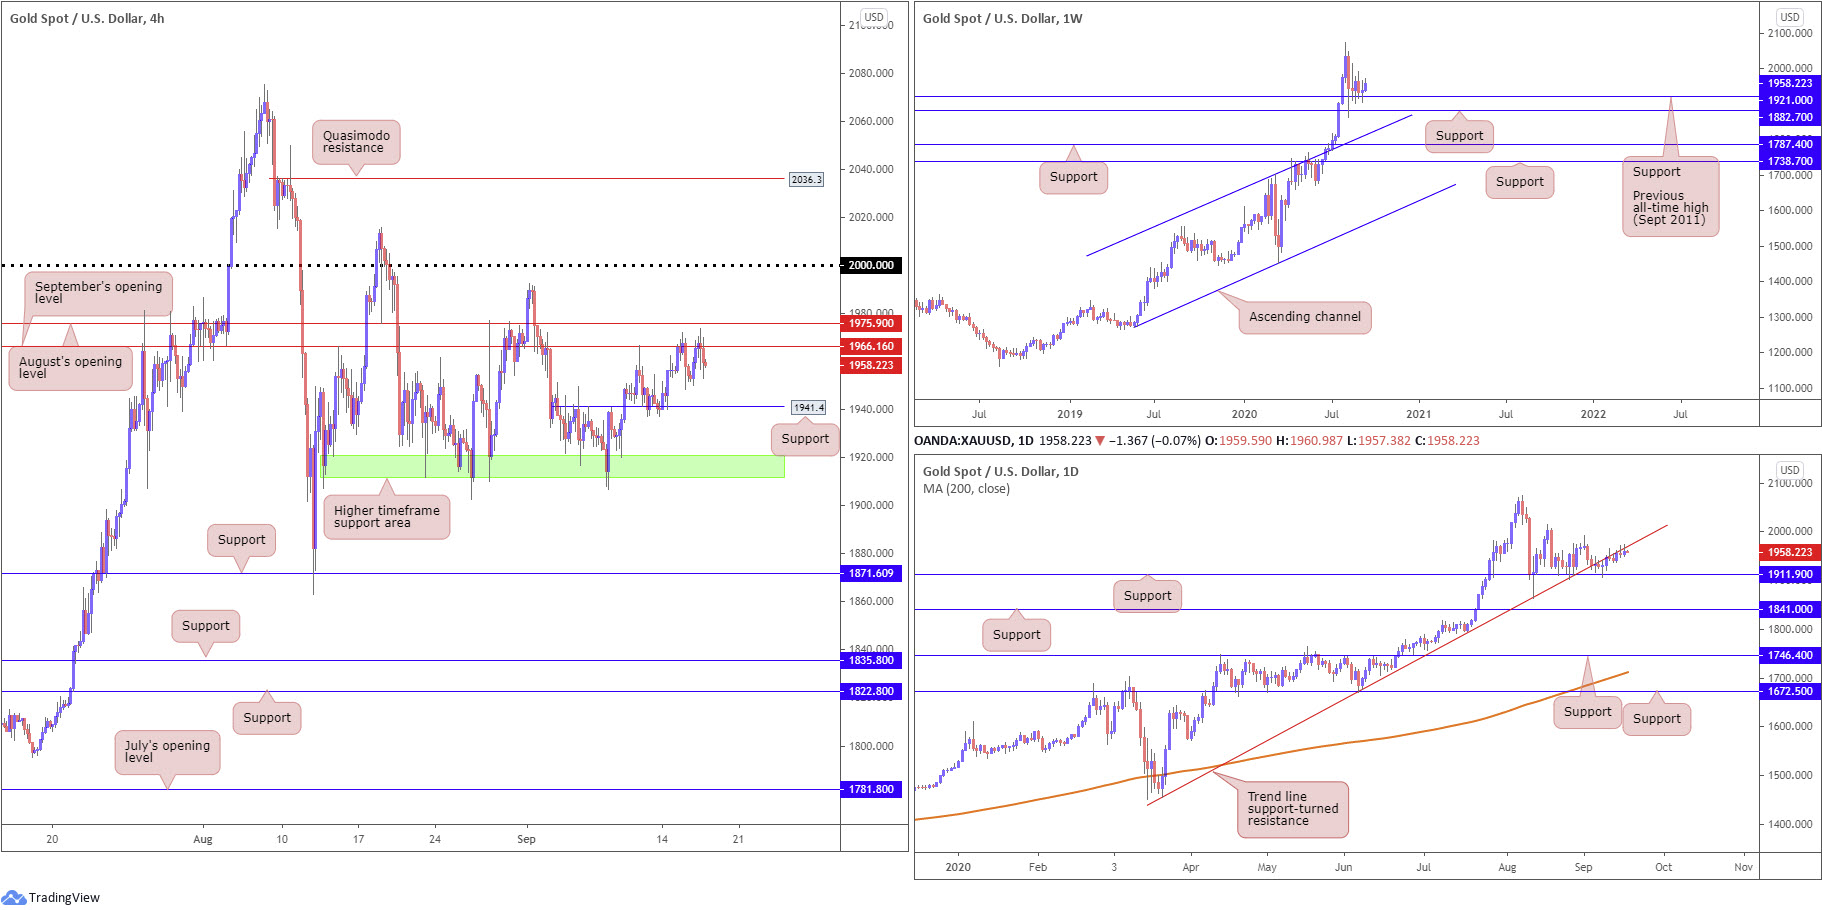
September’s opening value at $1,966 on the H4 timeframe is proving a tough level to overcome, a line drawn just ahead of August’s opening value at $1,975. Above here, traders will likely reach for $2,000, while extending the recent $1,966 rejection may guide price back to support at $1,941.
Weekly price remains buoyed by $1,921 support (located ahead of support at $1,882), the previous major all-time high (September 2011). With the current trend trekking north since 2016, the support combination between $1,882 and $1,921 may be enough to encourage additional buying, with most targeting all-time peaks at $2,075 as the initial point. Failure to hold gains could see channel resistance-turned support, etched from the high $1,703, enter view.
From the daily timeframe, candle activity continues to hold onto gains north of support at $1,911, though is seen grinding along the underside of a trend line support-turned resistance, taken from the low $1,455. Further buying targets the $1,992 September 1 high followed by the $2,015 August 18 high. A dip sub $1,911 will draw weekly support mentioned above at $1,882 into the frame.
Areas of consideration:
A $1,941 support retest could emerge on the H4 timeframe, a level that may appeal to dip buyers. A recovery from the noted support is backed by the weekly timeframe, yet might be hindered by daily structure (trend line resistance). A H4 bullish candlestick signal formed from the noted support may persuade buying, targeting $1,966/$1,975 as a primary point on the H4. Should we fail to secure support, traders’ crosshairs are likely to drop back to the higher timeframe support zone at $1,911.90-$1,921.00 (green H4), an area which has plugged downside since August.
Above $1,975 on the H4, breakout buyers will likely reach for $2,000.
The accuracy, completeness and timeliness of the information contained on this site cannot be guaranteed. IC Markets does not warranty, guarantee or make any representations, or assume any liability regarding financial results based on the use of the information in the site.
News, views, opinions, recommendations and other information obtained from sources outside of www.icmarkets.com.au, used in this site are believed to be reliable, but we cannot guarantee their accuracy or completeness. All such information is subject to change at any time without notice. IC Markets assumes no responsibility for the content of any linked site.
The fact that such links may exist does not indicate approval or endorsement of any material contained on any linked site. IC Markets is not liable for any harm caused by the transmission, through accessing the services or information on this site, of a computer virus, or other computer code or programming device that might be used to access, delete, damage, disable, disrupt or otherwise impede in any manner, the operation of the site or of any user’s software, hardware, data or property.


