
A note on lower timeframe confirming price action…
Waiting for lower timeframe confirmation is our main tool to confirm strength within higher timeframe zones, andhas really been the key to our trading success. It takes a little time to understand the subtle nuances, however, as each trade is never the same, but once you master the rhythm so to speak, you will be saved from countless unnecessary losing trades. The following is a list of what we look for:
- A break/retest of supply or demand dependent on which way you’re trading.
- A trendline break/retest.
- Buying/selling tails – essentially we look for a cluster of very obvious spikes off of lower timeframe support and resistance levels within the higher timeframe zone.
- Candlestick patterns. We tend to only stick with pin bars and engulfing bars as these have proven to be the most effective.
EUR/USD:
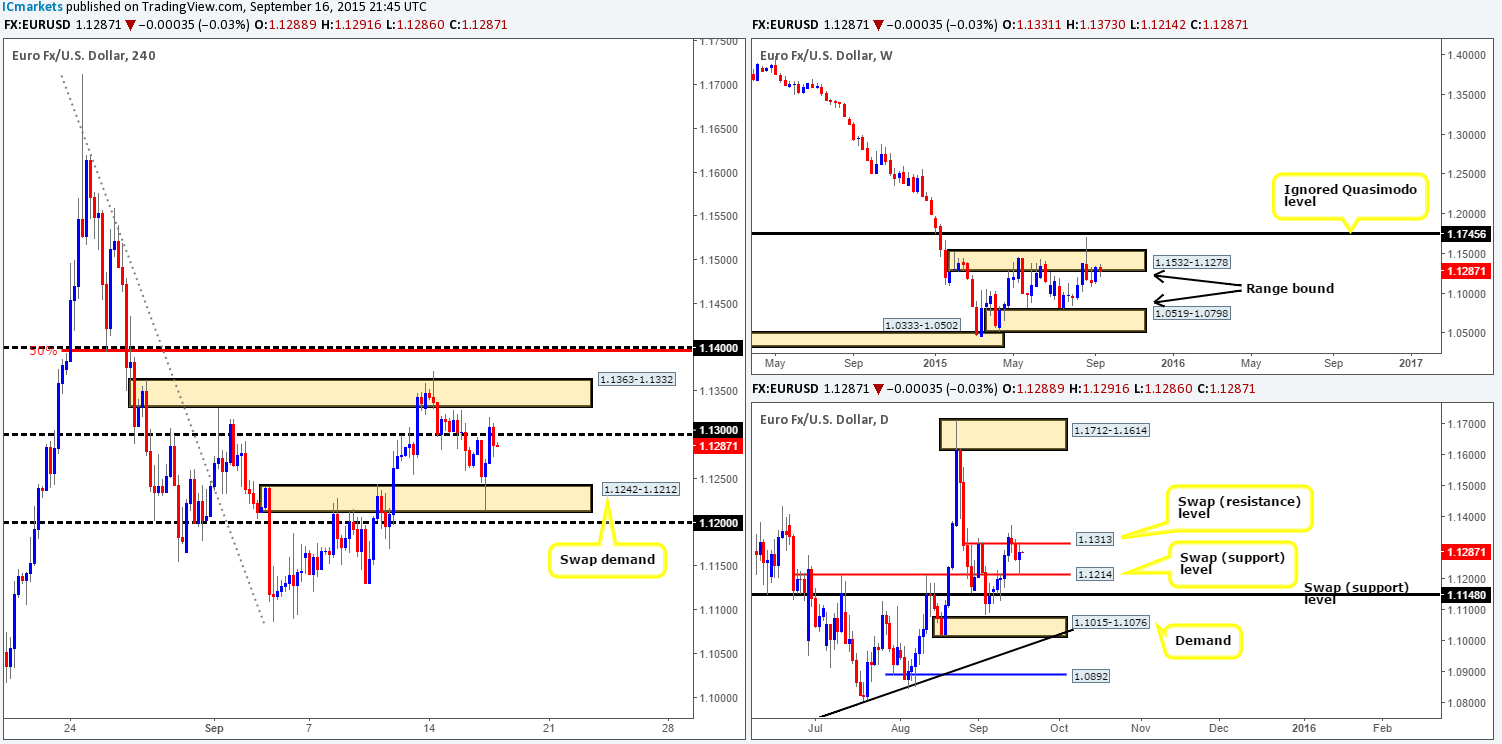
For those of you who read our previous report http://www.icmarkets.com/blog/wednesday-16th-september-watch-gbp-related-pairs-at-8-30am-gmt-and-usd-related-pairs-at-12-30pm-gmt-volatility-expected/you may recall us mentioning to keep a close eye on both the 1.1300 level and a 4hr swap (demand) zone at 1.1242-1.1212. As you can see, price came within two pips of hitting 1.1300 during early trade yesterday, before selling off down to the aforementioned 4hr swap (demand) zone, resulting in the the EUR aggressively rallying back up towards 1.1300 into the close 1.1288.
In view of price trading around 1.1300 right now, where do we see this market headed today? Well,we can see still see price loitering around weekly supply at 1.1532-1.1278. We purposely used the word ‘loitering’ here as there has not really been any continued sell-off from this zone since price connected with it over three weeks ago. Meanwhile, daily action is, as a result of recent movement, seen trading mid-range between two daily swap levels –1.1313/1.1214.
By and large, we certainly see space from 1.1300 for price to decline back down to the aforementioned 4hr swap (demand) base today. To trade this move, nevertheless, we’d need to see price jab into the underside of 1.1300 along with corresponding lower timeframe selling confirmation. Above 1.1300, on the other hand, there is immediate 4hr supply in your face at 1.1363-1.1332, followed closely by 1.1400, thus making it a difficult market to buy for now.
Levels to watch/live orders:
- Buys:Flat (Stop loss: N/A).
- Sells:1.1300 [Tentative – confirmation required] (Stop loss: dependent on where one confirms this level).
GBP/USD:
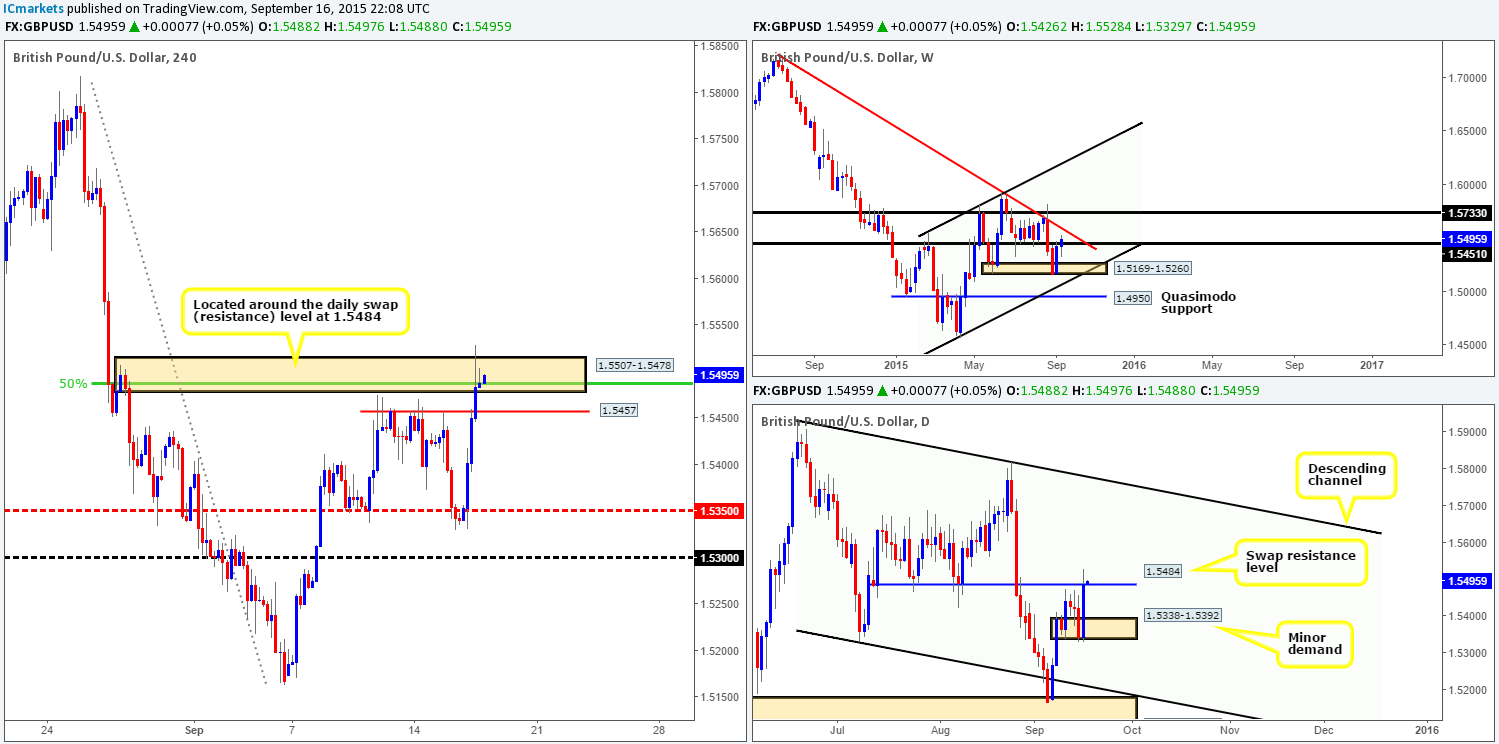
An unrelenting squeeze to the upside took place during yesterday’s trade on the back of positive results from the UK’s Labor market. This move took out several 4hr technical levels and really only began stabilizing once price aggressively collided with a fresh 4hr supply zone at 1.5507-1.5478.
The recent buying on this pair also saw price peek above a weekly swap (resistance) level at 1.5451. However, before breakout buyers get too excited, please do take into account that price also jabbed head first into a daily swap (resistance) level at 1.5484.
Given the above points, our team would not be comfortable shorting from the current 4hr supply due to the following:
- A near-term 4hr swap (support) level sits just below current price at 1.5457.
- The spike above current 4hr supply has likely taken out a ton of offers, thus weakening this zone.
- Although it is too early to tell whether the break above the aforementioned weekly (resistance) level is legit until the weekly close, it is still a concern for us when considering shorts.
With regards to buying this pair, nonetheless, we’re also hesitant since we’d want to see a daily close above the aforementioned daily swap (resistance) level at the very least. However, the safest and most conservative way to approach buying this market, in our opinion, might be to wait for the weekly candle close. A close above the aforementioned weekly swap (resistance) level would likely seal the deal to begin buying this market as long as price does not connect with the weekly descending trendline taken from the high 1.7166.
Levels to watch/ live orders:
- Buys: Flat (Stop loss: N/A).
- Sells: Flat (Stop loss: N/A).
AUD/USD:
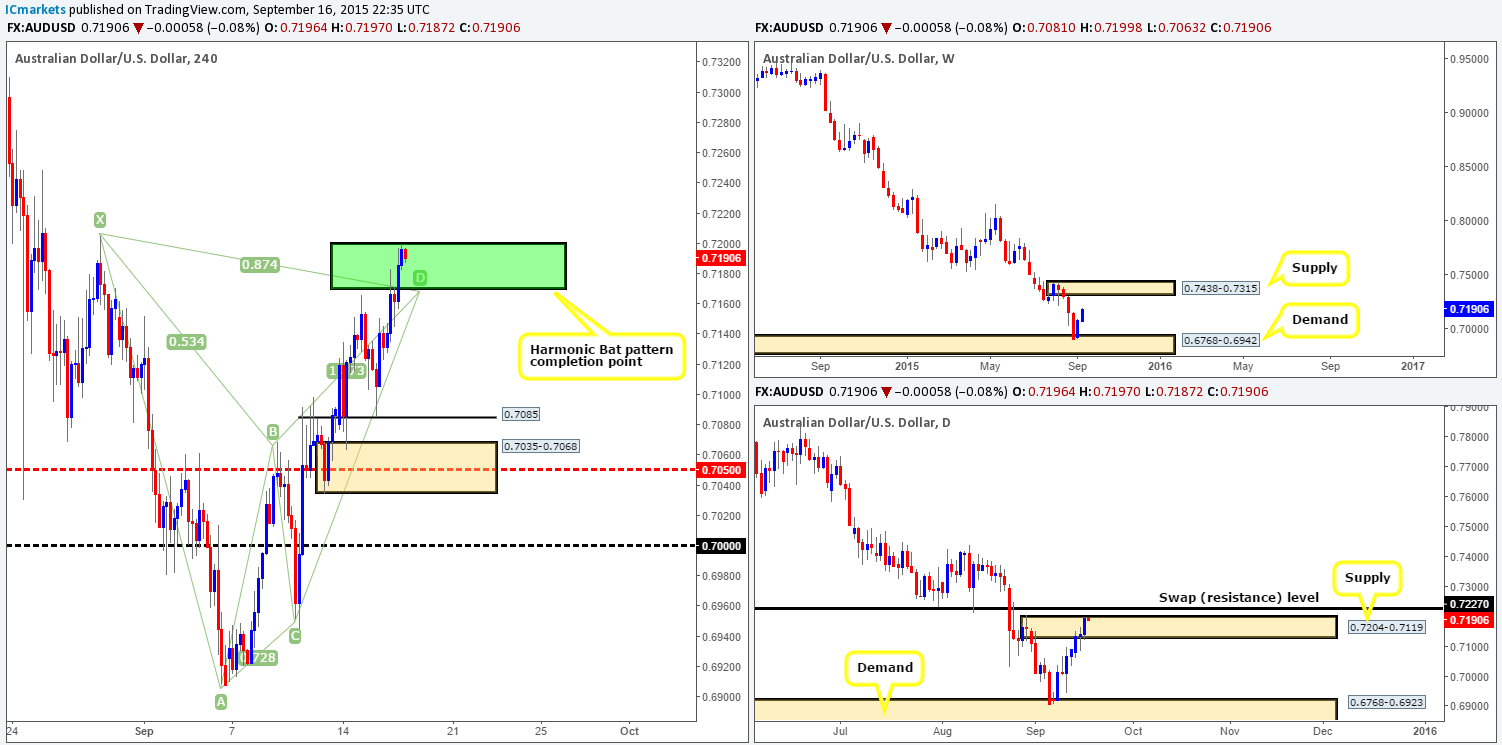
Coming at you directly from the weekly timeframe this morning, we can see that the AUD/USD pair continues to recover from weekly demand at 0.6768-0.6942. Should the buyers manage to maintain this momentum north, price may very well soon be shaking hands with weekly supply at 0.7438-0.7315. Turning our attention to the daily timeframe reveals that price is trading extremely deep within daily supply at 0.7204-0.7119. Since there has yet to be any noteworthy selling interest seen within this zone, traders need to be prepared for the possibility that this area may fail and price could continue north towards a daily swap (resistance) level at 0.7227.
Shifting a gear lower, 4hr action shows that this recent buying has pushed price deep into our 4hr Harmonic Bat pattern completion area at 0.7200/0.7170. Fortunately for us, we did not spot any valid price action on the lower timeframes to enter short, since this 4hr sell zone does not look in good shape at the moment.
As of writing, we’re quite happy to remain flat on this pair until price action becomes clearer. The reason being is if we consider sells, we’re potentially going up against weekly flows (see above). Conversely, if we buy, although we’ll be in line with the weekly timeframe, we’ll also be buying into the daily swap resistance level (see above).
Levels to watch/ live orders:
- Buys: Flat (Stop loss: N/A).
- Sells:Flat (Stop loss: N/A).
USD/JPY:
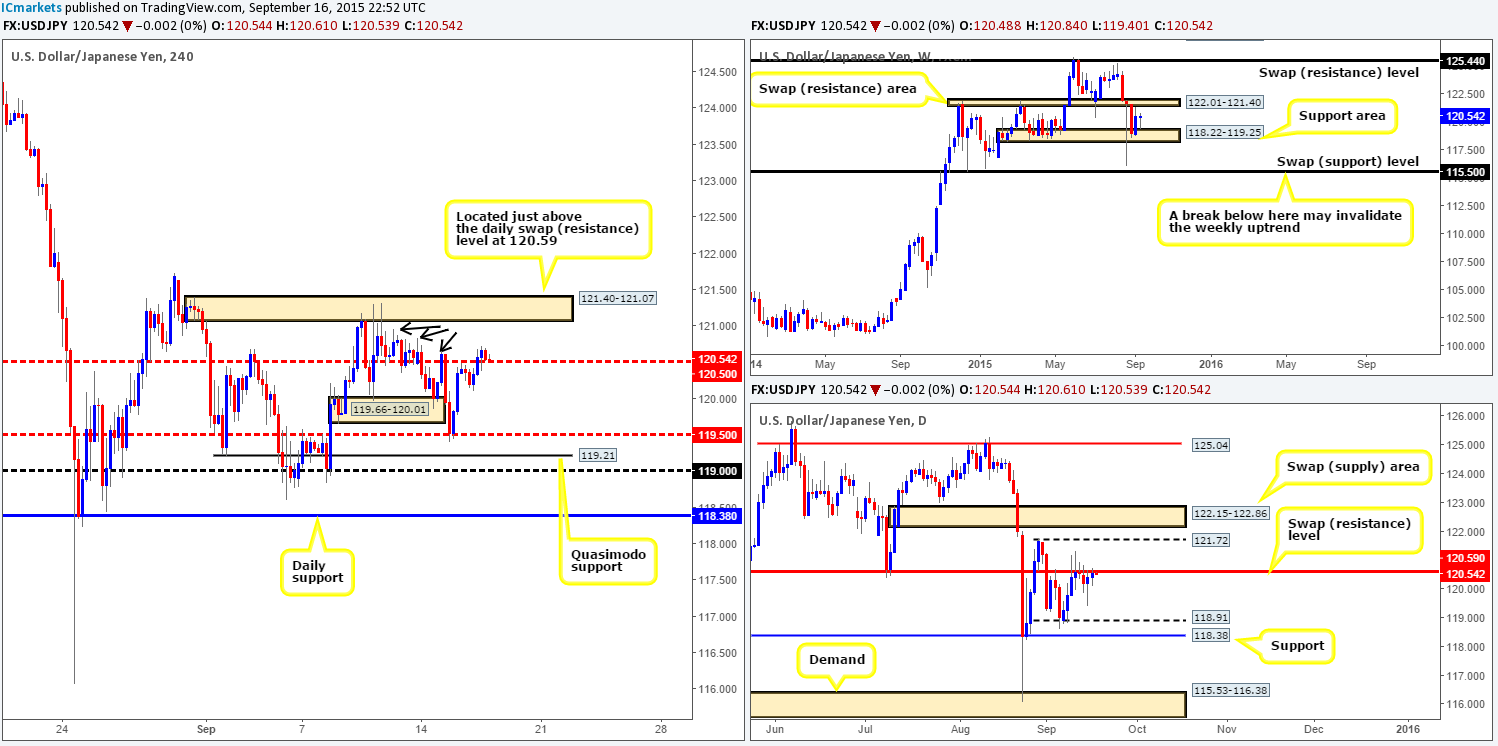
After price shook hands with the mid-level barrier 120.50 late on Tuesday, offers managed to hold this market lower reaching lows of 120.10 during yesterday’s trade. It was from this point – the London open, that the buyers became more active resulting in a break above and retest of 120.50 as support.
Now, should 120.50 hold firm today, an intraday long trade may be possible from here up to the 4hr supply at 121.40-121.07. The ingredients supporting this potential move are as follows:
- Little active supply to the left of current price. Check out the supply consumption wicks (black arrows) at 120.65/120.84/120.95. This, at least to us, suggests the path north is relatively clear for buying.
- Room above current price on the weekly timeframe for this market to rally. The next upside target from this scale comes in at 122.01-121.40 – a weekly swap (resistance) area.
The only snag regarding this trade comes in on the daily timeframe. See how price is currently kissing the underside of a daily swap (resistance) level at 120.59. This could put pressure on any longs taken on this pair. Therefore, one needs to tread carefully here and only enter with strong confirming price action from the lower timeframes.
Levels to watch/ live orders:
- Buys: 120.50 [Tentative – confirmation required] (Stop loss: dependent on where one confirms this level).
- Sells: Flat (Stop loss: N/A).
USD/CAD:
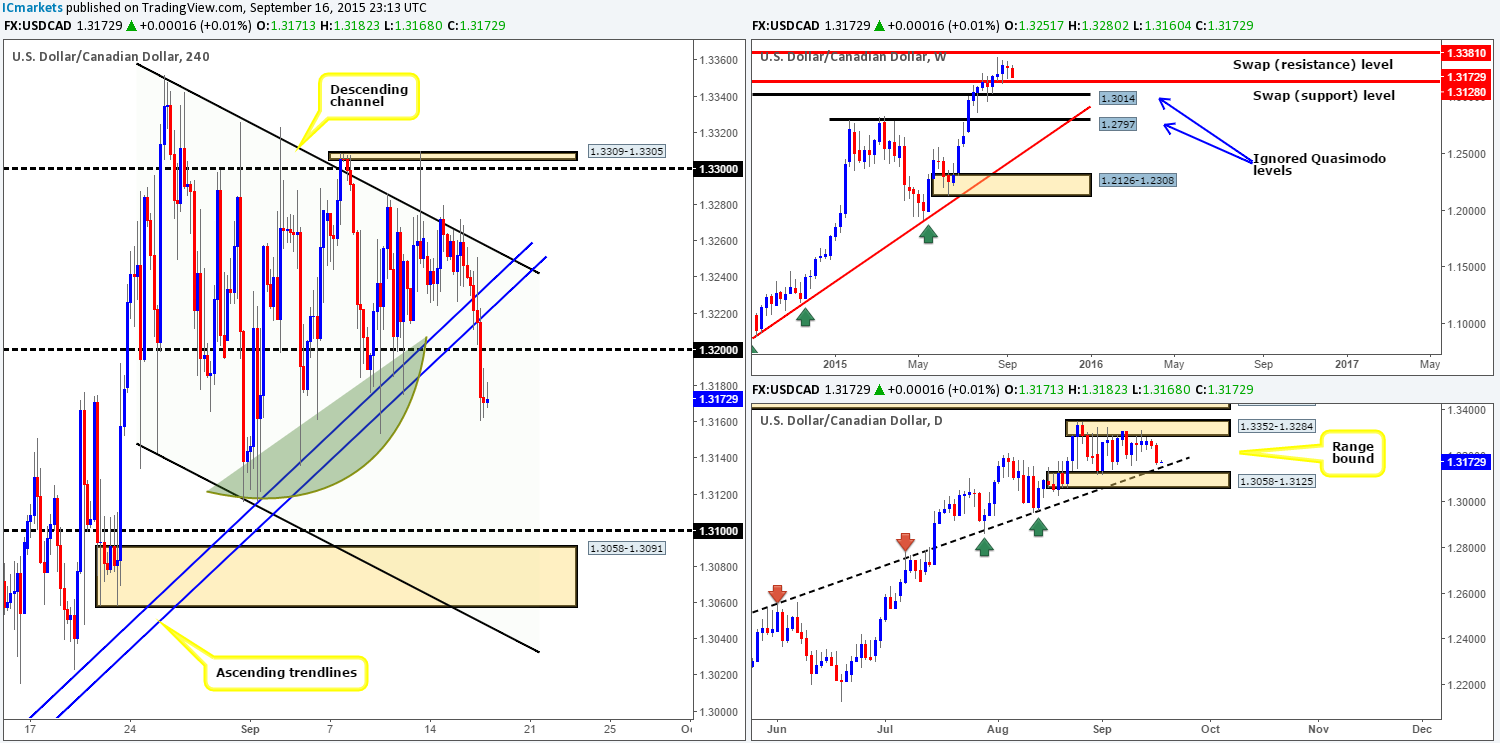
Finally, we have some decisive movement to report! The USD/CAD fell sharply during the course of yesterday’s sessions. Several 4hr technical levels were taken out during this onslaught and, as far as we can see, is only really beginning to find support now around the 1.3170 mark.
Take note of all those buying wicks seen to the left of current price within the green arc pattern. This resembles what we like to call:‘demand consumption tails’. Since we believe the majority of the buy orders within and around this region have already likely been taken out, it is possible the USD/CAD has further to decline yet. We believe it could be as far as the 1.3100 handle judging by the structure of 4hr price action.
Nevertheless, when we step across onto the higher timeframes, the outlook isa little different. From the weekly scale, price is trading within shouting distance of a weekly swap (support) level at 1.3128. Down on the daily timeframe, however, price is very close to hitting a daily ascending trendline taken from 1.2537. This is not to say price will not reach 1.1300, it’s just nice to be aware of what we could potentially rebound from should we decide to short this market.
Given the points made above, our prime focus today will firmly be on 1.3200 in the hope that price retests this number before continuing lower (black arrows). Should the retest be seen, together with reasonable lower timeframe selling confirmation, we’ll jump in short and look to trail our position behind distinct lower timeframe resistances until price either reaches 1.3100 or stops us out.
Levels to watch/ live orders:
- Buys:Flat (Stop loss: N/A).
- Sells: 1.3200 [Tentative – confirmation required] (Stop loss: dependent on where one confirms this level).
USD/CHF:
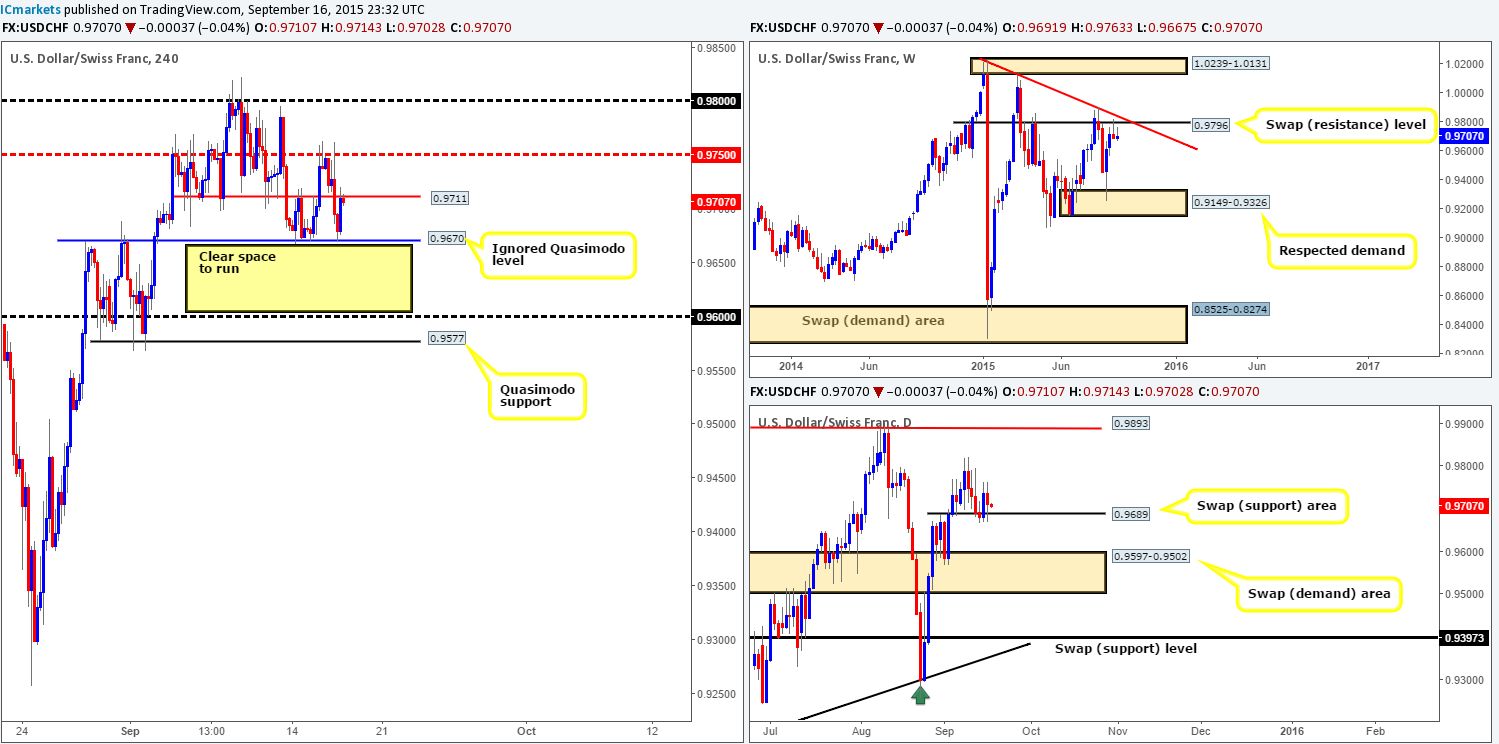
The USD/CHF pair, as you can see, did eventually see a sell-off from the mid-level barrier 0.9750 as reported it may do in our previous report http://www.icmarkets.com/blog/wednesday-16th-september-watch-gbp-related-pairs-at-8-30am-gmt-and-usd-related-pairs-at-12-30pm-gmt-volatility-expected/. This selling pressure took out bids sitting at 0.9711, and once again slam dunked itself into the ignored 4hr Quasimodo level (IQM) at 0.9670. This is the third time this hurdle has been respected as support this week! The bounce from this level saw price drive into 0.9711, which is currently holding firm as resistance.
Ultimately, what we have been looking for recently is a break BELOW this 4Hr (IQM), since the path appears relatively clear beneath this number down to 0.9600 – a nice take-profit target. In the event thata drive lower is seen and price retests this boundary as resistance, we’d likely enter short if there is corresponding lower timeframe confirmation present.
Supporting further selling in this market, we can see that price is holding below a weekly swap (resistance) level at 0.9796. However, against a push lower, there’s supportive pressure flowing in from the daily chart at a swap (support) barrier coming in at 0.9670.Should a decisive push below the 4hr (IQM) be seen, nonetheless, we believe most of the bids around this daily area will be consumed, thus, at least from a technical standpoint, this market will be free to drop down to our target – 0.9600.
Levels to watch/ live orders:
- Buys:Flat (Stop loss: N/A).
- Sells: Watch for bids at 0.9670 to be consumed and then look to enter on any retest seen at this number (confirmation required).
DOW 30:
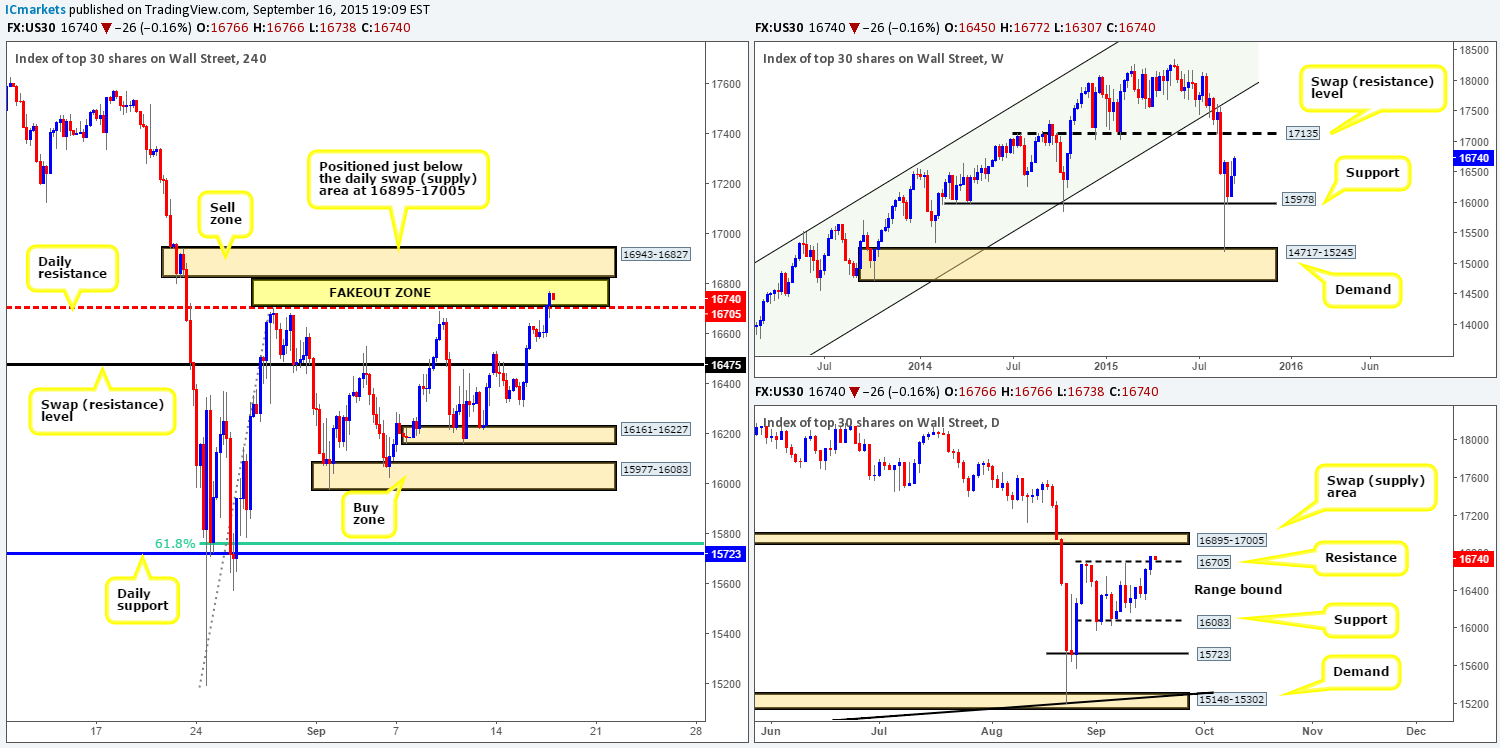
Similar to Tuesday’s sessions, the DOW only really came alive going into London trade yesterday. A heavy round of buying pushed this market above a daily resistance level at 16705. As we mentioned in our previous analysis http://www.icmarkets.com/blog/wednesday-16th-september-watch-gbp-related-pairs-at-8-30am-gmt-and-usd-related-pairs-at-12-30pm-gmt-volatility-expected/ this would likely be the region in which traders look to place their sell orders with their buy stops set just above. We had no intention in selling at this daily level simply because we believed price had the potential to fake above this barrier into a 4hr supply zone coming in at 16943-16827 (Positioned just below the daily swap [supply] area at 16895-17005).
As we can all see, price is trading very close to this 4hr supply right now. Our team is very interested in selling at this area today, but only if price manages to drive higher into the zone itself. The reason for this is because once/if the market rebounds from this 4hr supply, we may only reach the 16705 region which is now considered daily support, so we’ll try to get a relatively tight stop on this trade if possible.
Our rational behind shorting here is simply down to the buy stops above the aforementioned daily level – we’re looking to try and join in with the big boys and sell into all those stops – hopefully from deep within 4hr supply!
Levels to watch/ live orders:
- Buys:Flat (Stop loss: N/A).
- Sells:16943-16827[Tentative – confirmation required] (Stop loss: depends on where one confirms this area)
XAU/USD: (Gold)
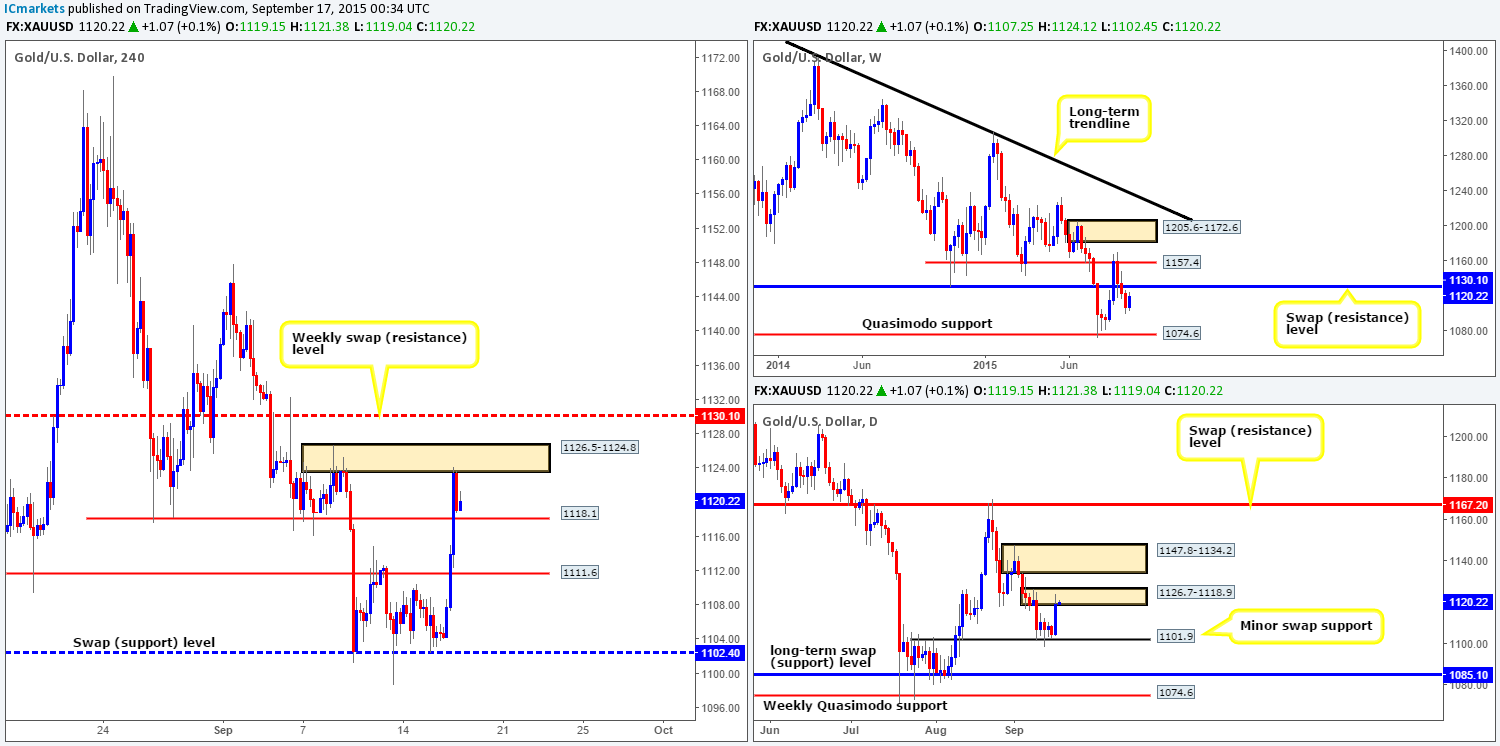
Following the sluggish response from the 4hr swap (support) level at 1102.4 on Tuesday, price continued to hesitate above this barrier during Asia trade yesterday. It was only once we saw European traders coming into the market did price launch itself north, taking out both 1111.6/1118.1 and stabbing into a 4hr supply at 1126.5-1124.8. The rebound from this 4hr supply was beautiful. This brought Gold back down to just above 1118.1, 4hr resistance – turned support.
As you can see, this recent flow of buying has also brought prices up into the jaws of a daily supply at 1126.7-1118.9, which boasts a weekly swap (resistance) level at 1130.1 just above it. Therefore, price could still potentially fake above both the current 4hr and daily supplies into this weekly level (see red level on the 4hr chart) before any further selling is seen. If we think about this logically for a moment, waiting for price to fake up to the weekly level would in fact be an extremely nice zone to short from. This level is quite hidden and most traders will be focusing more on shorts from the current 4hr and daily supply zones with their stops placed where? Just above these zones and just below the weekly level – a lovely pool of liquidity (buy stops) to short into.
Other than the above, we’ll be watching to see if price convincingly breaks below 1118.1 and retest it as resistance, since this could provide a nice platform in which to look for confirmed intraday shorts today.
Levels to watch/ live orders:
- Buys: Flat (Stop loss: N/A).
- Sells: 1130.1 [Tentative – confirmation required] (Stop loss: dependent on where one confirms this level) Watch for bids at 1118.1 to be consumed and then look to enter on any retest seen at this number (confirmation required).


