A note on lower timeframe confirming price action…
Waiting for lower timeframe confirmation is our main tool to confirm strength within higher timeframe zones, andhas really been the key to our trading success. It takes a little time to understand the subtle nuances, however, as each trade is never the same, but once you master the rhythm so to speak, you will be saved from countless unnecessary losing trades. The following is a list of what we look for:
- A break/retest of supply or demand dependent on which way you’re trading.
- A trendline break/retest.
- Buying/selling tails – essentially we look for a cluster of very obvious spikes off of lower timeframe support and resistance levels within the higher timeframe zone.
- Candlestick patterns. We tend to only stick with pin bars and engulfing bars as these have proven to be the most effective.
EUR/USD:
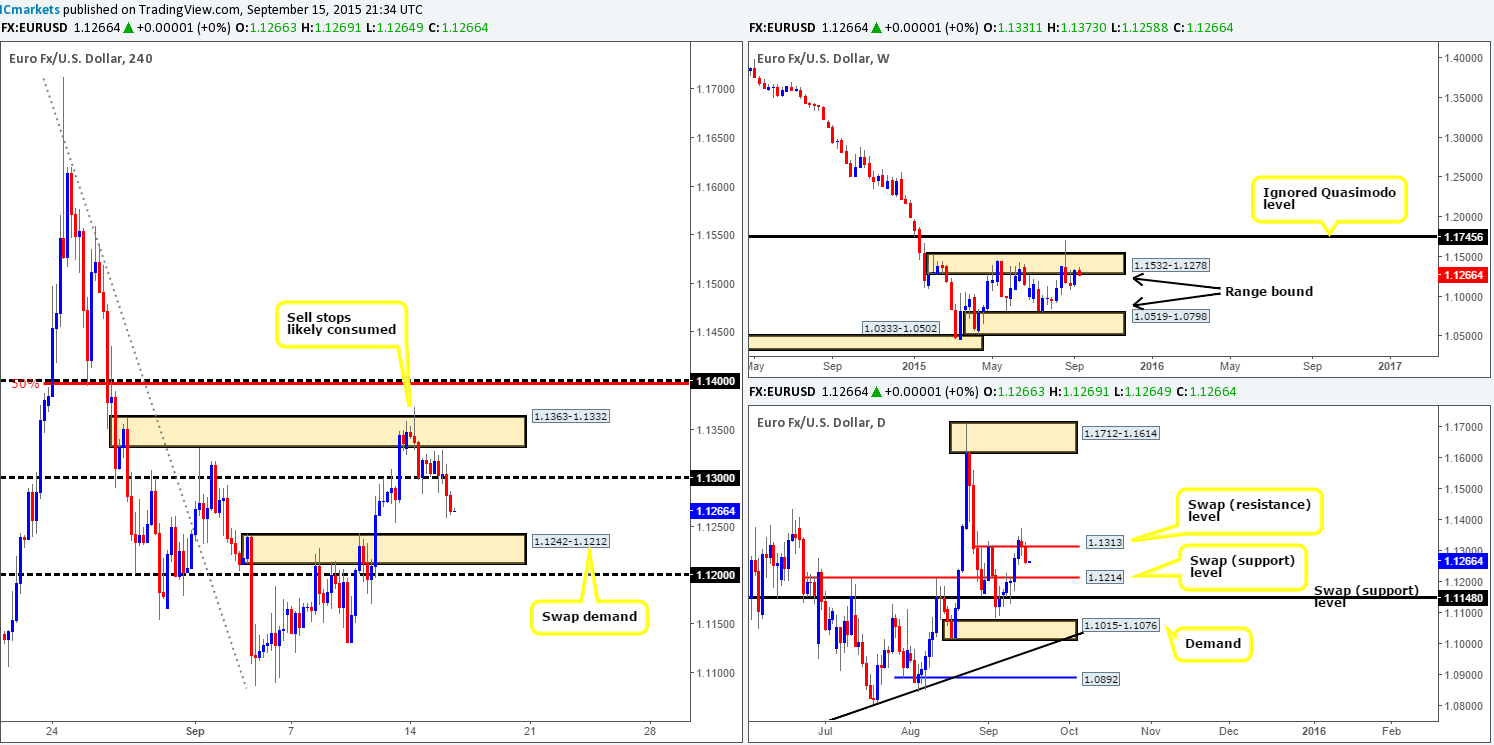
Following on from yesterday’s report (http://www.icmarkets.com/blog/tuesday-15th-september-expect-volatility-during-trade-today-as-a-number-of-high-impacting-news-events-are-set-to-hit-the-docket/), psychological support 1.1300 continued to hold firm going into the London session. However, as can be seen from the 4hr chart, the buyers failed to print new highs. It was only once we saw the U.S. open for business did the EUR currency turn lower, taking out 1.1300 and reaching lows of 1.1258 on the day.
In light of price now floating between 1.1300 and a 4hr swap (demand) base at 1.1242-1.1212, how do things currently stand on the higher timeframes? Up on the weekly, we can see price still loitering around weekly supply at 1.1532-1.1278. We purposely used the word ‘loitering’ here as there has not really been any continued sell-off from this zone for over three weeks now. Moving down to the daily timeframe, price is now trading between two daily swap levels –1.1313/1.1214. With this in mind, here is what we have jotted down so far:
- Keep an eye on 1.1300 for potential sells today as it corresponds nicely with the daily swap (resistance) barrier at 1.1313. Be prepared for a fakeout above this round number and only enter when/if lower timeframe confirming price action is seen.Furthermore, we also have the added bonus of price trading within weekly supply here as well (see above).
- Possible buying opportunities at the aforementioned 4hr swap (demand) area may be seen today. This base not only converges with the daily swap (support) level at 1.1214, but also sits just above 1.1200. Therefore, traders should be prepared for a possible fake lower to take place, and like above, only enter when/if lower timeframe confirming price action is seen.
Levels to watch/live orders:
- Buys:1.1242-1.1212 [Tentative – confirmation required] (Stop loss: dependent on where one confirms this area).
- Sells:1.1300 [Tentative – confirmation required] (Stop loss: dependent on where one confirms this level).
GBP/USD:
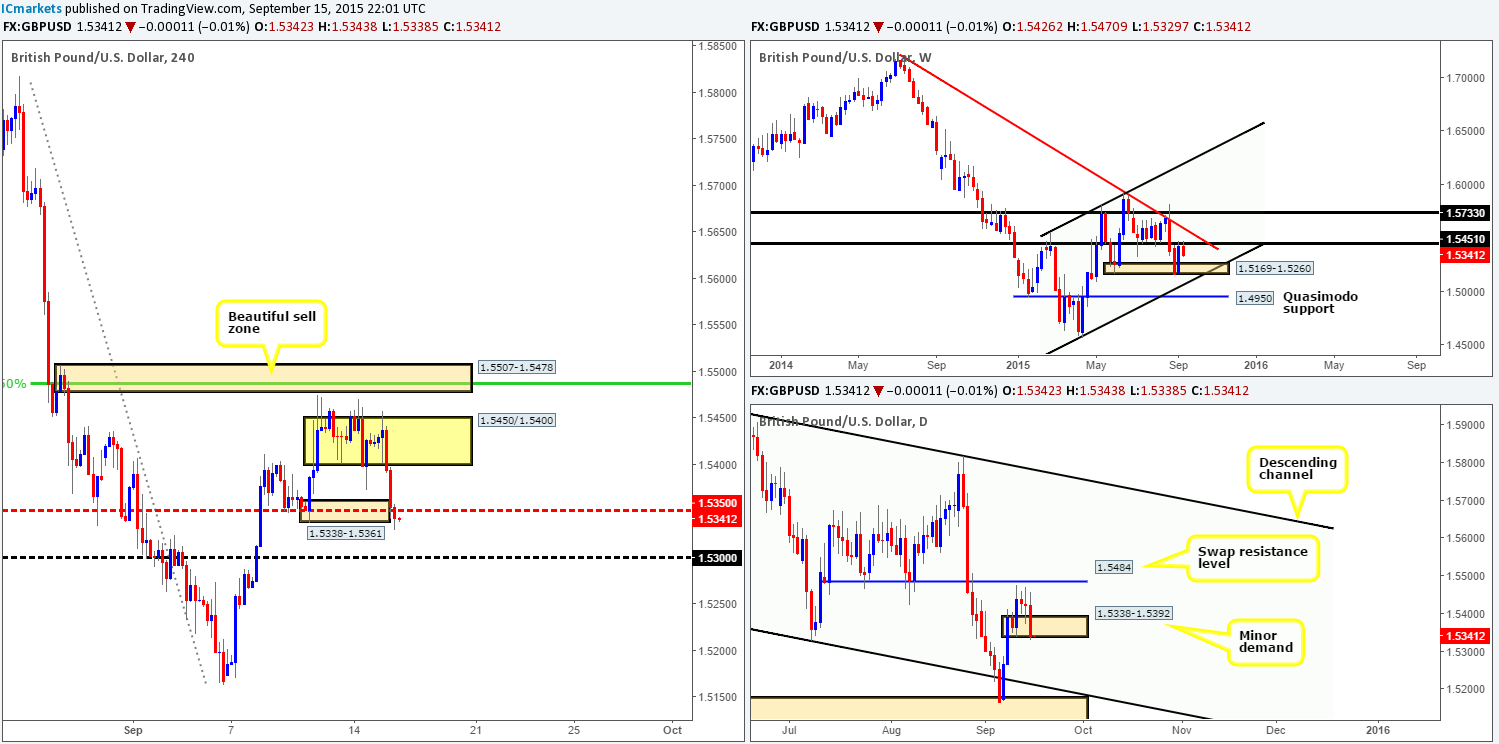
The GBP/USD pair, as you can see, fell sharply from the 4hr range resistance at 1.5450 as we entered into London trade yesterday, consequently breaking sharply out of this consolidation and stabbing below 4hr demand at 1.5338-1.5361. With only a few remaining bids likely left at this 4hr demand base, we believe the path south is potentially freedown to at least 1.5300.
Taking a peek at the higher timeframes shows somewhat of an agreement on direction at the moment. The weekly timeframe has room to continue trading lower down to weekly demand at 1.5169-1.5260, and with minor daily demand at 1.5338-1.5392 also being consumed, this market has certainly taken on a more bearish vibe.
On account of the above points, our attention will mostly be driven toward shorts today. Of course, price could continue selling off without pulling back and that would leave us on the sidelines as most of you already know we’re not fans of trading breakouts. Therefore, to trade, we’ll be looking for price to retest either the mid-level barrier 1.5350 or the round number 1.5400 (the underside of the recently broken 4hr range) for potential (confirmed) short entries.
Levels to watch/ live orders:
- Buys: Flat (Stop loss: N/A).
- Sells: 1.5350[Tentative – confirmation required] (Stop loss: dependent on where one confirms this level) 1.5400 [Tentative – confirmation required] (Stop loss: dependent on where one confirms this level).
AUD/USD:
Recent action on this pair shows that price came within a few pips of connecting with our 4hr Harmonic Bat pattern completion area at 0.7200/0.7170. The reason we have included the psychological resistance 0.7200 within our sell zone is simply because the market may be attracted to the stream of offers/buy stops likely positioned there.
As we can see, price did indeed sell-off after just missing the 0.7170 mark and tumbled all the way down to the 0.7085 region – a minor 4hr swap (support) level. We really like the response seen from this hurdle, and believe that if the buyers continue pushing this market north like this today, we’ll soon see price clash with the aforementioned 4hr Harmonic sell zone (HSZ).
Additionally, we like the fact that the 4hr (HSZ) is positioned nicelywithin the current daily supply zone at 0.7204-0.7119.However, as we mentioned past reports, even if price does reach our 4hr (HSZ) this week, we still need to tread carefully. Let’s not forget that although price is currently trending south, we have recently seen buying pressure from weekly demand at 0.6768-0.6942. This warrants caution. Unless we are able to spot lower timeframe selling confirmation around this 4hr (HSZ), we’ll quite happily pass on the trade.

Levels to watch/ live orders:
- Buys: Flat (Stop loss: N/A).
- Sells: 0.7071 [Tentative – confirmation required] (Stop loss: dependent on where one confirms this level).
USD/JPY:
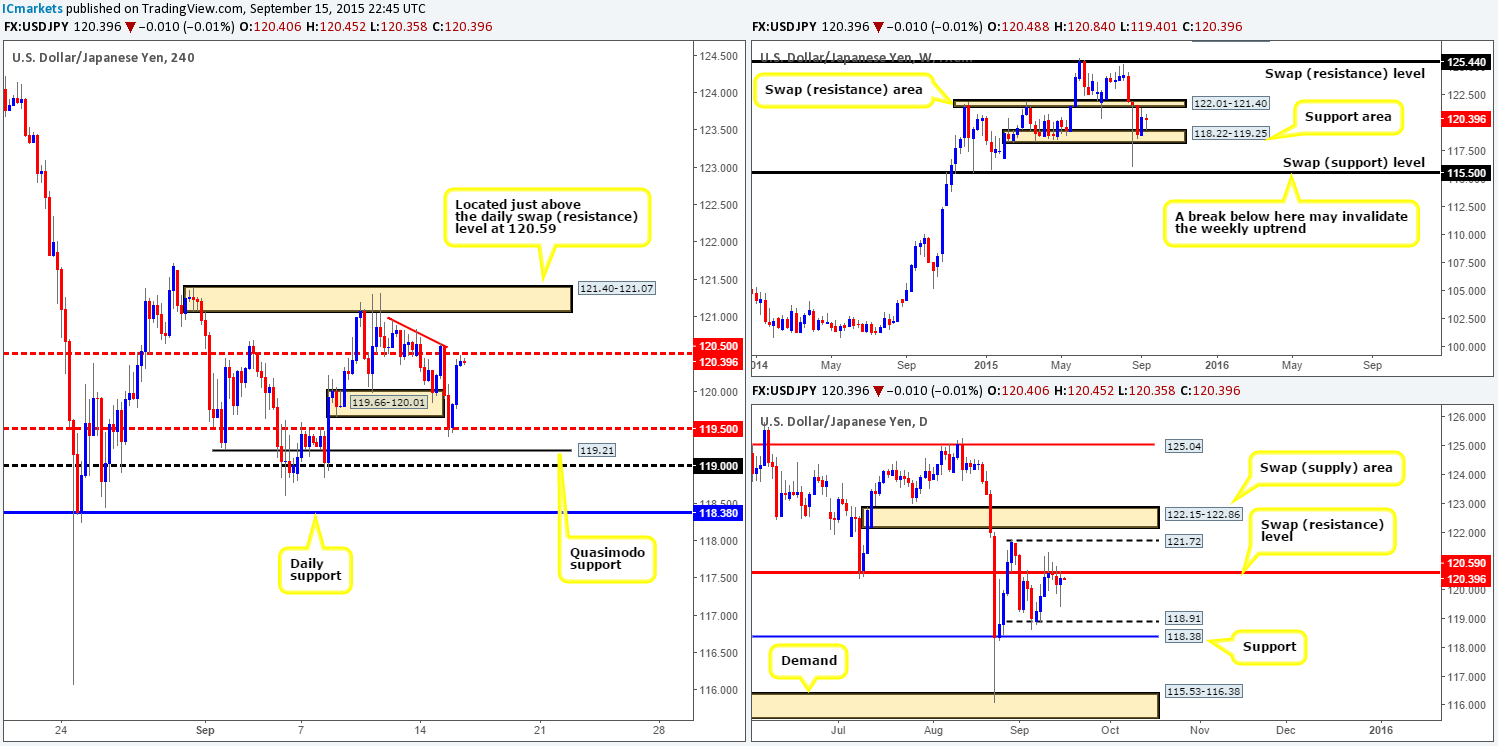
The sellers wasted no time yesterday. An hour or so after the new trading day began a strong wave of offers piled into the USD/JPY market, eventually taking out 4hr demand at 119.66-120.01, and shaking hands with mid-level support at 119.50. This barrier, as you can probably see, was tagged in right around when London traders were coming into the market. The sell orders used during Asia provided London-based traders sufficient liquidity to buy into, and buy they did! Price rallied a cool 100 pips back up to mid-level resistance at 120.50.
Seeing as price is now effectively trading around 4hr resistance – a potential sell zone, where does our team stand in the bigger picture? High up on the weekly timeframe, we can see price came within shouting distance of hitting the weekly support area at 118.22-119.25 before active buying was once again seen. Daily action on the other hand, shows that despite the recent buying, price is still lodged at the underside of a daily swap (resistance) level at 120.59.
To that end, we believe 120.50 is worthy of consideration today. In the event that lower timeframe selling confirmation is spotted here, we’ll enter long, eyeing 120.00 as our immediate take-profit area, followed closely by the mid-level barrier 119.50. Alternatively, a cut above 120.50 could force price up to 4hr supply at 121.40-121.07 (positioned just above the aforementioned daily [swap] resistance level). A potential buy opportunity could present itself should price retest 120.50 and show some form of buying confirmation. Nonetheless, do take into account that you would effectively be buying into daily resistance then (see above), so play safe!
Levels to watch/ live orders:
- Buys: Watch for offers to be consumed around 120.50 and then look to enter on any retest seen at this number (confirmation required).
- Sells:120.50 [Tentative – confirmation required] (Stop loss: dependent on where one confirms this level).
USD/CAD:
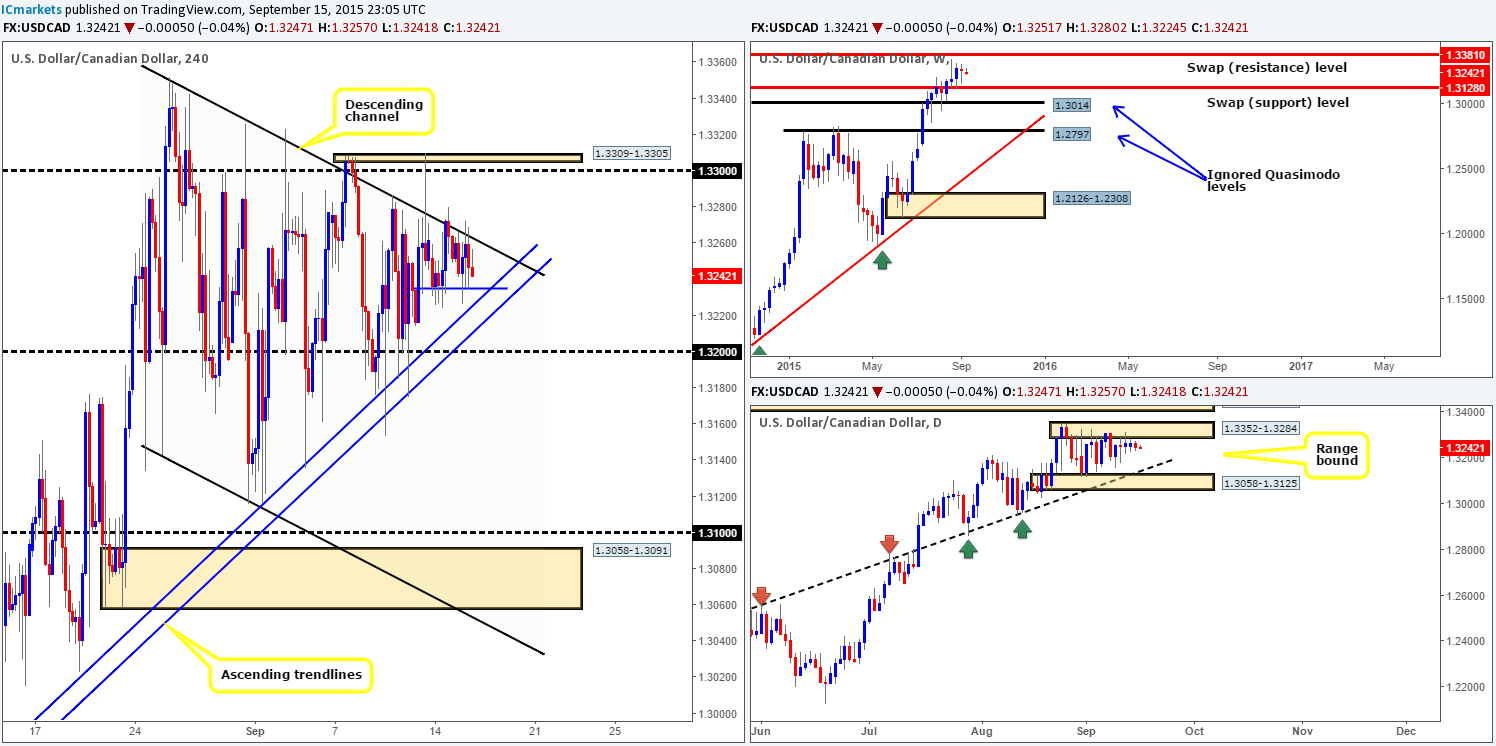
Overall, this market has not really changed much since yesterday as price continues to tightly consolidate between 4hr support at 1.3250 and the underside of the 4hr descending channel resistance (1.3352/1.3142). Since the 25th August, this pair has really been a choppy market to trade. However, as we mentioned in past reports, price has still been contained very well between a 4hr ascending trendline taken from the low 1.2950, and the aforementioned 4hr channel resistance. Once a breakout takes place, all eyes will be on the surrounding psychological numbers –1.3300 and 1.3200 for potential trades.
Personally though, at least for now, we still believe this market is best left alone until a breakout takes place. The reason for why comes from seeing little Intel from the weekly timeframe other than price is trading mid-range, and let’s be honest, price is not exactly showing much enthusiasm beneath daily supply (1.3352-1.3284) at the moment.
Levels to watch/ live orders:
- Buys:Flat (Stop loss: N/A).
- Sells: Flat (Stop loss: N/A).
USD/CHF:
Following on from yesterday’s report (http://www.icmarkets.com/blog/tuesday-15th-september-expect-volatility-during-trade-today-as-a-number-of-high-impacting-news-events-are-set-to-hit-the-docket/) we can clearly see that the buyers were not done with the 4hr ignored Quasimodo level at 0.9670. Price bounced from this barrier once again, only this time reaching highs of 0.9763.
With the two recent selling wicks printed at mid-level resistance 0.9750, is this somewhere we’d label a high-probability shorting zone? We certainly see price dropping forty or so pips drop to 0.9711, but beyond this, it is very difficult to tell. The reason for why comes from the conflicting signals seen from the higher timeframe picture. Buying pressure is being seen off of a daily swap (support) barrier at 0.9689, while weekly action shows price holding below a weekly swap (resistance) level at 0.9796.
With the above taken into consideration, we’ll remain on the sidelines for now and wait for further developments.

Levels to watch/ live orders:
- Buys: Flat (Stop loss: N/A).
- Sells:Flat (Stop loss: N/A).
DOW 30:
The DOW came alive going into London trade yesterday. A heavy influx of bids came into this market, cleanly taking out the 4hr swap (resistance) level at 16475 and reaching highs of 16643 on the day. This very cool-looking 290-point rally has, as you can probably see, placed price close to a neighboring daily resistance level coming in at 16705. As we mentioned in our previous report http://www.icmarkets.com/blog/tuesday-15th-september-expect-volatility-during-trade-today-as-a-number-of-high-impacting-news-events-are-set-to-hit-the-docket/ this will likely be the region in which traders look to place their sell orders with their buy stops set just above. And, why not, this level looks very attractive on the daily chart. However, when one looks at this level from the 4hr angle, we can clearly see that this daily barrier has a high probability of being faked into a fresh 4hr supply above at 16943-16827 (Positioned just below the daily swap [supply] area at 16895-17005). Therefore, do keep an eye out for a potential short within the yellow fakeout zone between these two areas today to sell into all those buy stops!
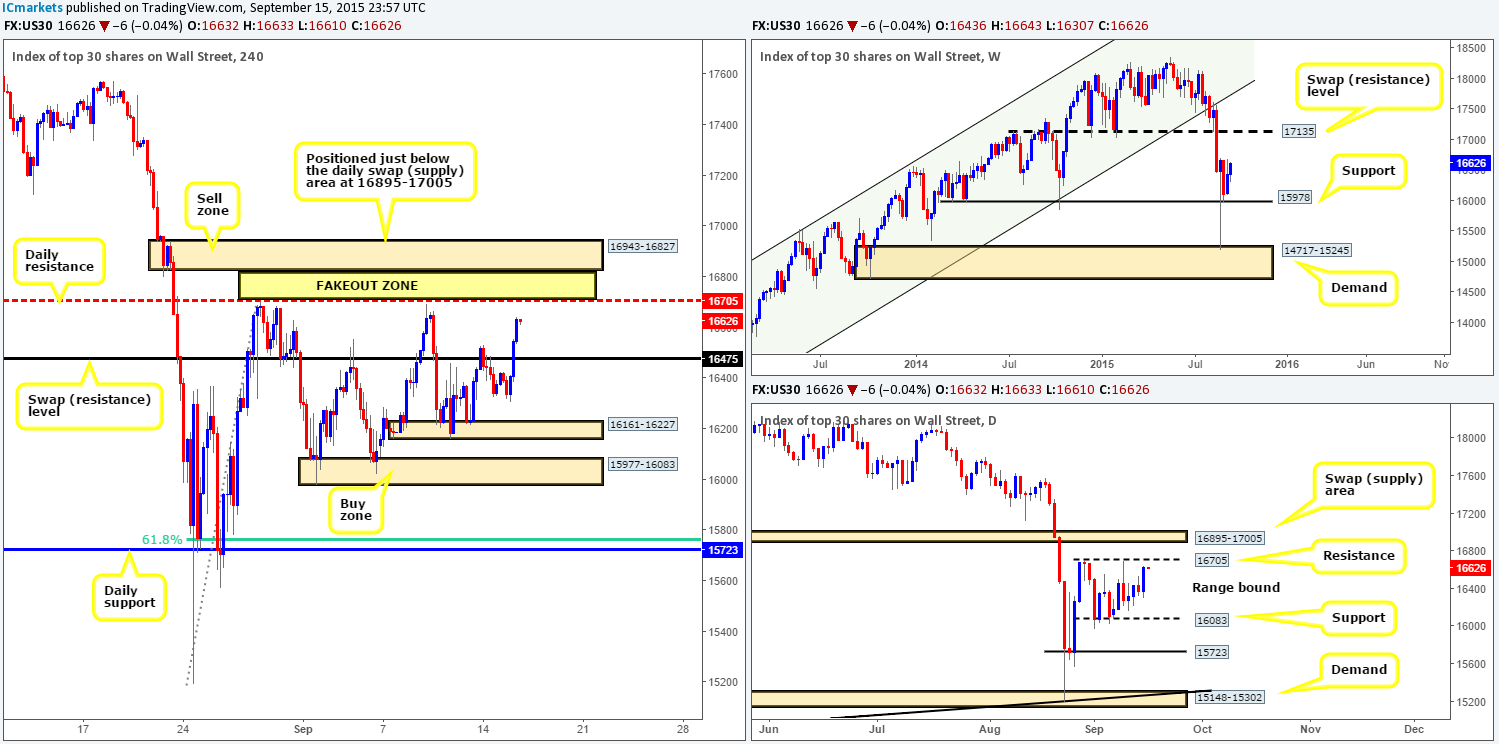
Levels to watch/ live orders:
- Buys:Flat (Stop loss: N/A).
- Sells:16943-16827[Tentative – confirmation required] (Stop loss: depends on where one confirms this area)
XAU/USD: (Gold)
Once again, the Gold market saw rather dull action during the course of yesterday’s sessions. Price slowly grinded southbound and plugged itself into bids sitting at 1102.4, which, as you can see, has so far held firm. This – along with the ignored 4hr Quasimodo level above at 1111.6 were levels noted to watch during trade yesterday. Although 1102.4 has been respected, we have seen very little in the way of bullish price action on the lower timeframes to suggest buying from here.
There is still relatively mixed signals coming in from the higher timeframe structures at present.The weekly chart shows room to continuedown to at least 1074.6, and the daily chart continues to show supportive pressure from a minor swap support barrier at 1101.9. With little change overall being seen in this market, much of the following analysis will remain similar to yesterday’s report…
Given the above, we willclosely watchboth of the above said 4hr hurdles today for potential (confirmed) opportunities to fade. A cut above 1111.6, nonetheless, would likely offer two things. Firstly, we believe it would set the stage for a continuation move north up to a 4hr swap resistance level at 1118.1 (located close to daily supply at 1126.7-1118.9). Secondly, it may provide an opportunity to trade long should price retest 1111.6 as support (waiting for confirmation here is highly recommended). On the flip side, in case 1102.4 is engulfed, the river south should be ‘ripple free’ down to at least the 4hr swap support at 1091.5. For us to be given the green light to short following a close lower, however, we’d need to see price retest this level as resistance together with lower timeframe selling confirmation.
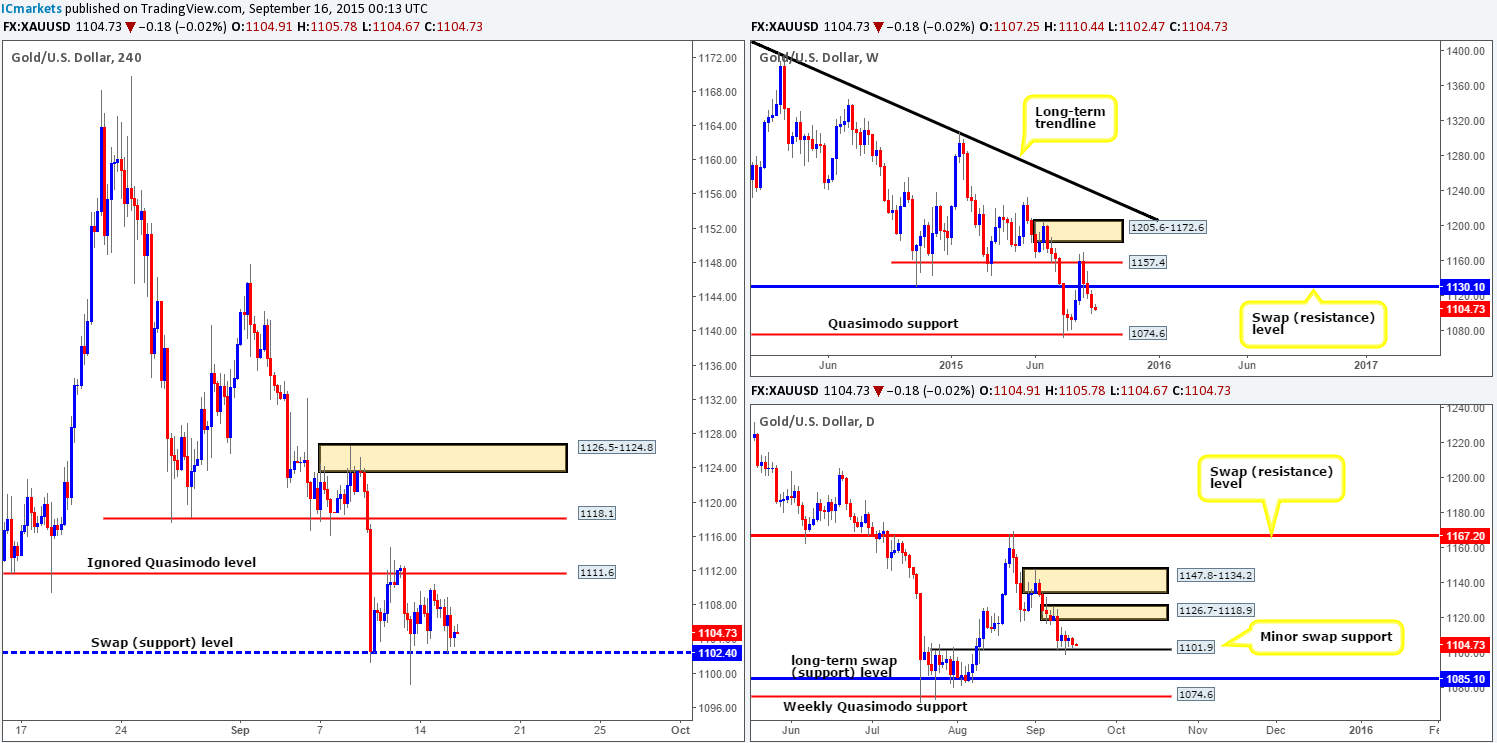
Levels to watch/ live orders:
- Buys: 1102.4 [Tentative – confirmation required] (Stop loss: dependent on where one confirms this level) Watch for offers at 1111.6 to be consumed and then look to enter on any retest seen at this number (confirmation required).
- Sells: 1111.6 [Tentative – confirmation required] (Stop loss: dependent on where one confirms this level) Watch for bids at 1102.4 to be consumed and then look to enter on any retest seen at this number (confirmation required).


