
Key risk events today:
MPC Official Bank Rate Votes, BoE Monetary Policy Summary, Official Bank Rate; MPC Asset Purchase Facility Votes; Canada ADP Non-Farm Employment Change; Philly Fed Manufacturing Index; US Unemployment Claims.
(Previous analysis as well as outside sources – italics).
EUR/USD:
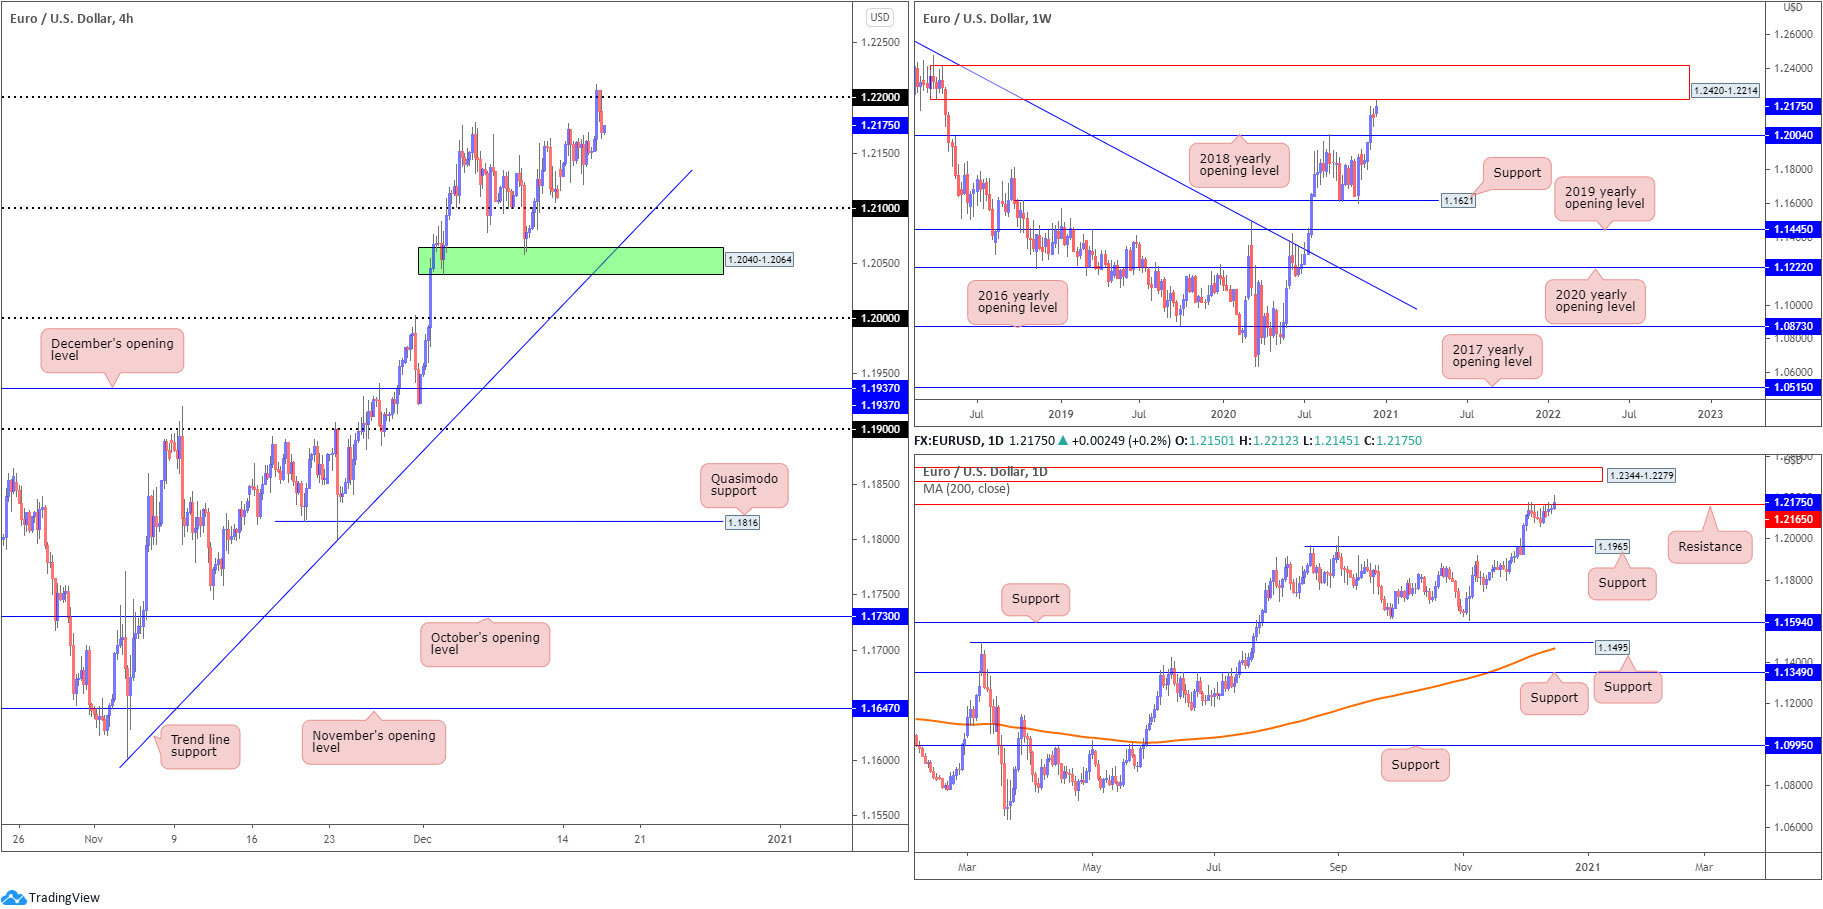
Wednesday had the US dollar index conclude significantly off session troughs, generating a whipsaw motion in EUR/USD. H4, as you can see, whipsawed through daily resistance at 1.2165 and tested the 1.22 handle on the H4. Despite reaching for YTD peaks at 1.2212, price turned lower and retested 1.2165.
For those who read Wednesday’s technical briefing you may recall the following (italics):
1 22 is also a significant ceiling to watch, one which could entice sellers. A mild fakeout above the level, a whipsaw that not only taps into any buy-stops above 1.22 but also tests the underside of weekly supply at 1.2214 (potentially strong offers), unlocks the possibility of fresh sellers making an appearance.
Price action came within two pips of testing the weekly supply zone at 1.2420-1.2214 before turning lower. Should higher timeframe offers attract additional selling, it’s possible H4 makes its way towards the 1.21 handle, a base that merges with trend line support, extended from the low 1.1602.
With weekly support not in the picture until 1.2004 (2018 yearly opening value), further losses could be seen beyond 1.21 on the H4, taking on demand at 1.2040-1.2064 and, ultimately, shaking hands with the key figure 1.20.
Areas of consideration:
- Although the uptrend is clear in this market, weekly supply at 2420-1.2214 making an appearance could trigger selling, targeting 1.21 as an initial point (H4).
- H4 demand at 2040-1.2064 is an interesting zone to be mindful of. Though pushing beyond this area shines the spotlight on 1.20.
GBP/USD:
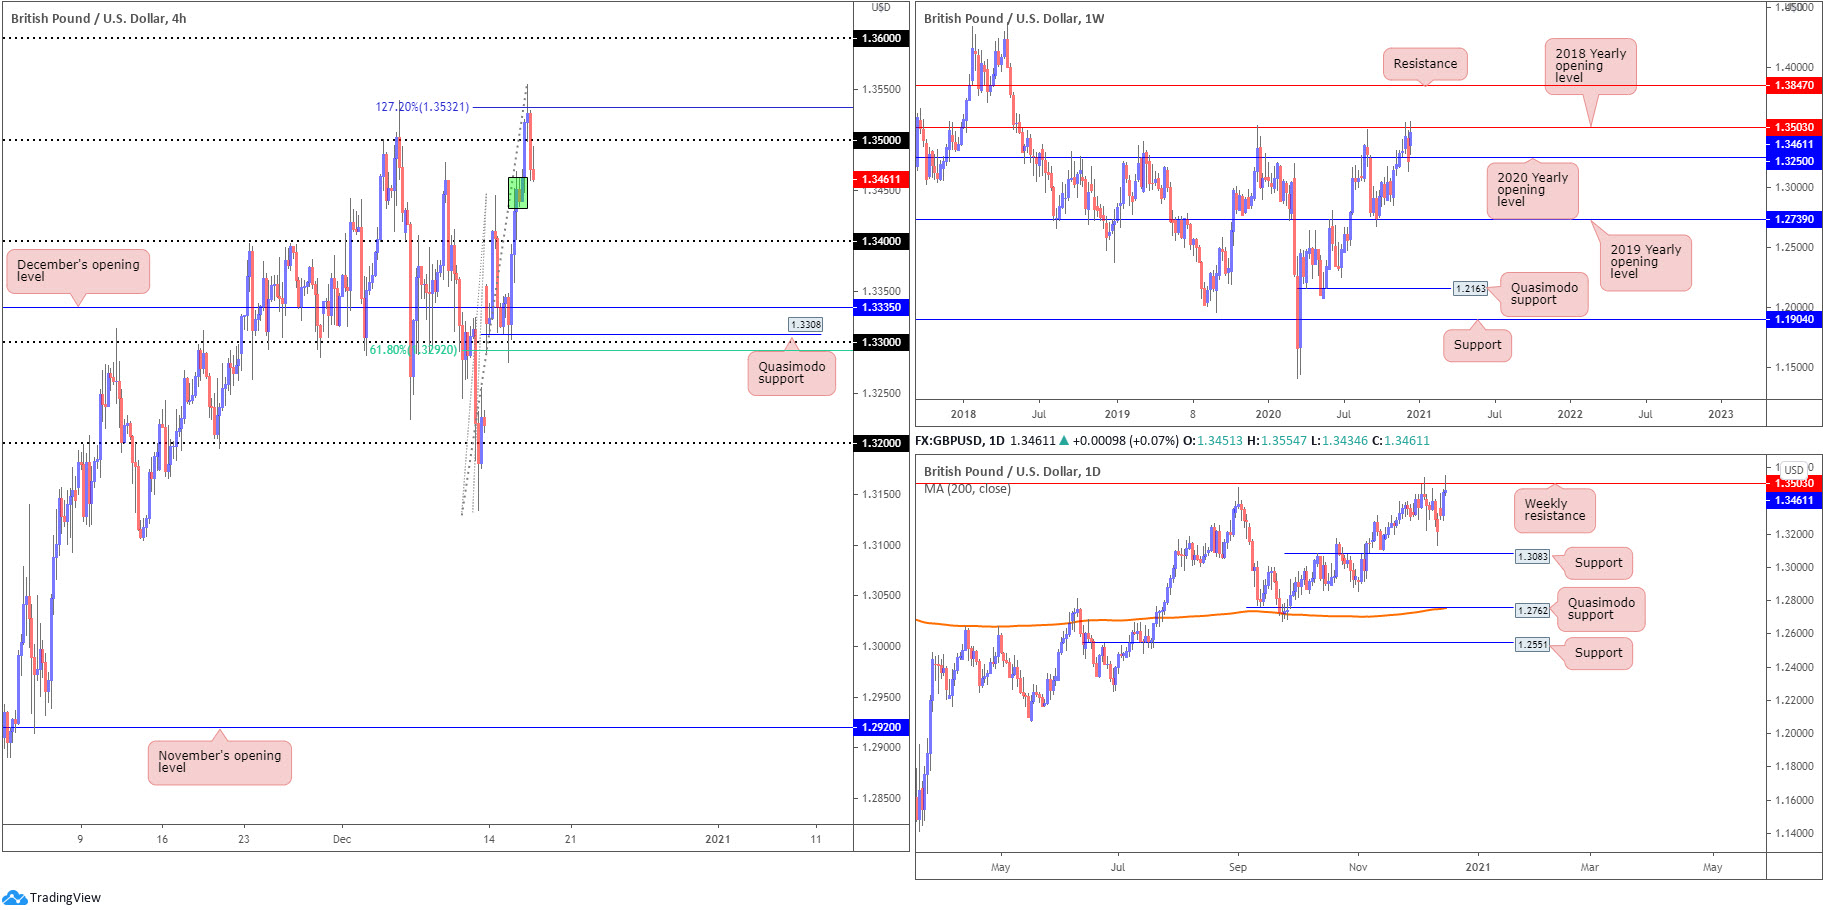
GBP/USD eased from multi-year peaks at 1.3554 Wednesday in wake of a modest USD recovery off YTD lows (DXY). Recent action led H4 through buy-stops above the 1.35 handle into strong offers around the 127.2% Fibonacci projection point at 1.3532. We do have mild demand around the 1.3450ish range (green), which if surpassed could shine the spotlight on the 1.34 handle. While this level offers little in terms of confluence, traders may wish to note December’s opening value at 1.3335, plotted just north of Quasimodo support at 1.3308, the 1.33 handle and a 61.8% Fibonacci retracement ratio at 1.3292.
Further afield, the weekly timeframe presents resistance at 1.3503, in the form of the 2018 yearly opening value. Above this level, daily resistance is seen at 1.3763, followed by weekly resistance from 1.3847.
Areas of consideration:
- Despite the clear uptrend, GBP/USD recently confronting resistance on the weekly scale at 1.3503 places H4 demand at 1.3450 in question. Bearish scenarios beneath the base, therefore, may develop, targeting at least 1.34.
- December’s opening value at 1.3335 offers interesting support, closely bolstered by Quasimodo support at 1.3308, the 1.33 handle and a 61.8% Fibonacci retracement ratio at 1.3292.
AUD/USD:
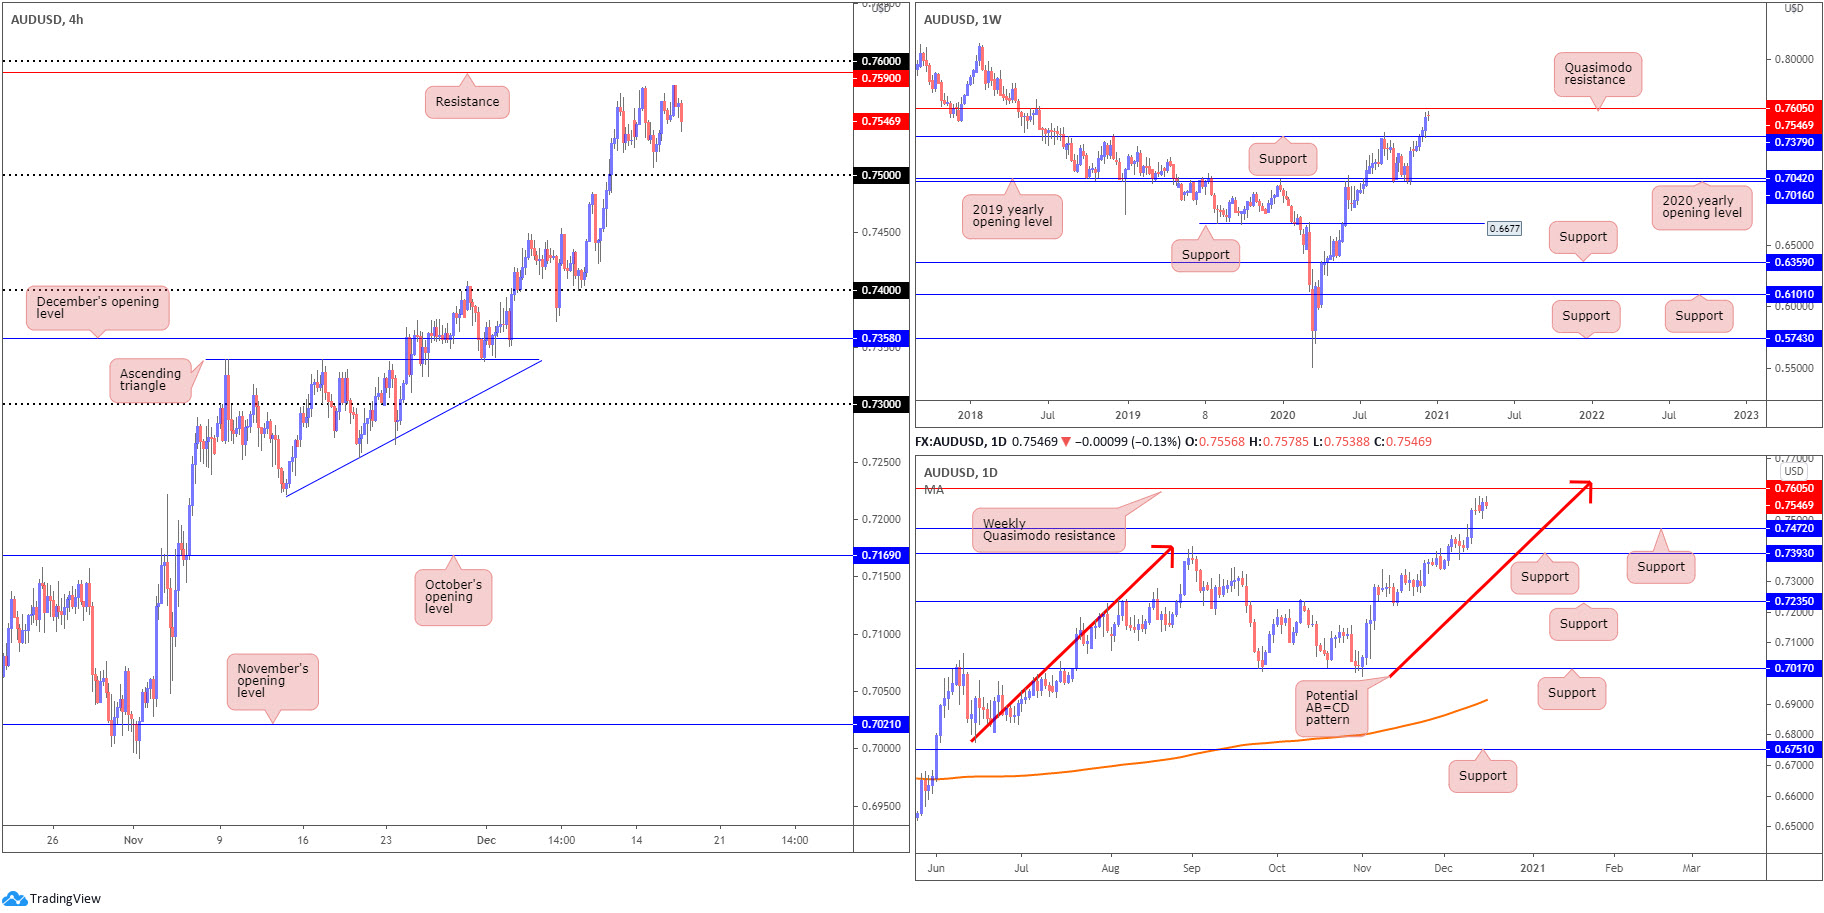
The risk-sensitive Australian dollar rotated from YTD peaks at 0.7578 against the buck in recent hours, amidst a mild downturn in risk sentiment. Leaving H4 resistance at 0.7590 and the 0.76 handle unchallenged, the H4 candles appear poised to take a run at Tuesday’s lows at 0.7507, closely shadowed by the 0.75 handle.
Higher timeframe structure unchanged (italics):
From the weekly timeframe, last week’s action decorated the weekly chart with another cheerful candle. Following a retest of support at 0.7379, the pair recorded a fourth consecutive weekly advance. In view of this market trending higher since early 2020, buyers may be eyeballing Quasimodo resistance parked at 0.7605.
Despite two back-to-back shooting star candle patterns, formed off YTD highs, sellers have yet to show signs of committing. Should sellers gain consciousness, this could prompt mild downside, possibly driving a retest at support drawn from 0.7472. North of price, weekly Quasimodo resistance mentioned above at 0.7605 is seen, accompanied by a daily AB=CD approach (red arrows) at 0.7624.
Areas of consideration:
Outlook unchanged due to lacklustre movement on Wednesday.
- The combination of daily support at 0.7472 and the 0.75 handle on the H4 represents possible support, in the event another retreat develops.
- 76 on the H4 echoes robust resistance, placed nearby H4 resistance at 0.7590 and weekly Quasimodo resistance at 0.7605.
USD/JPY:
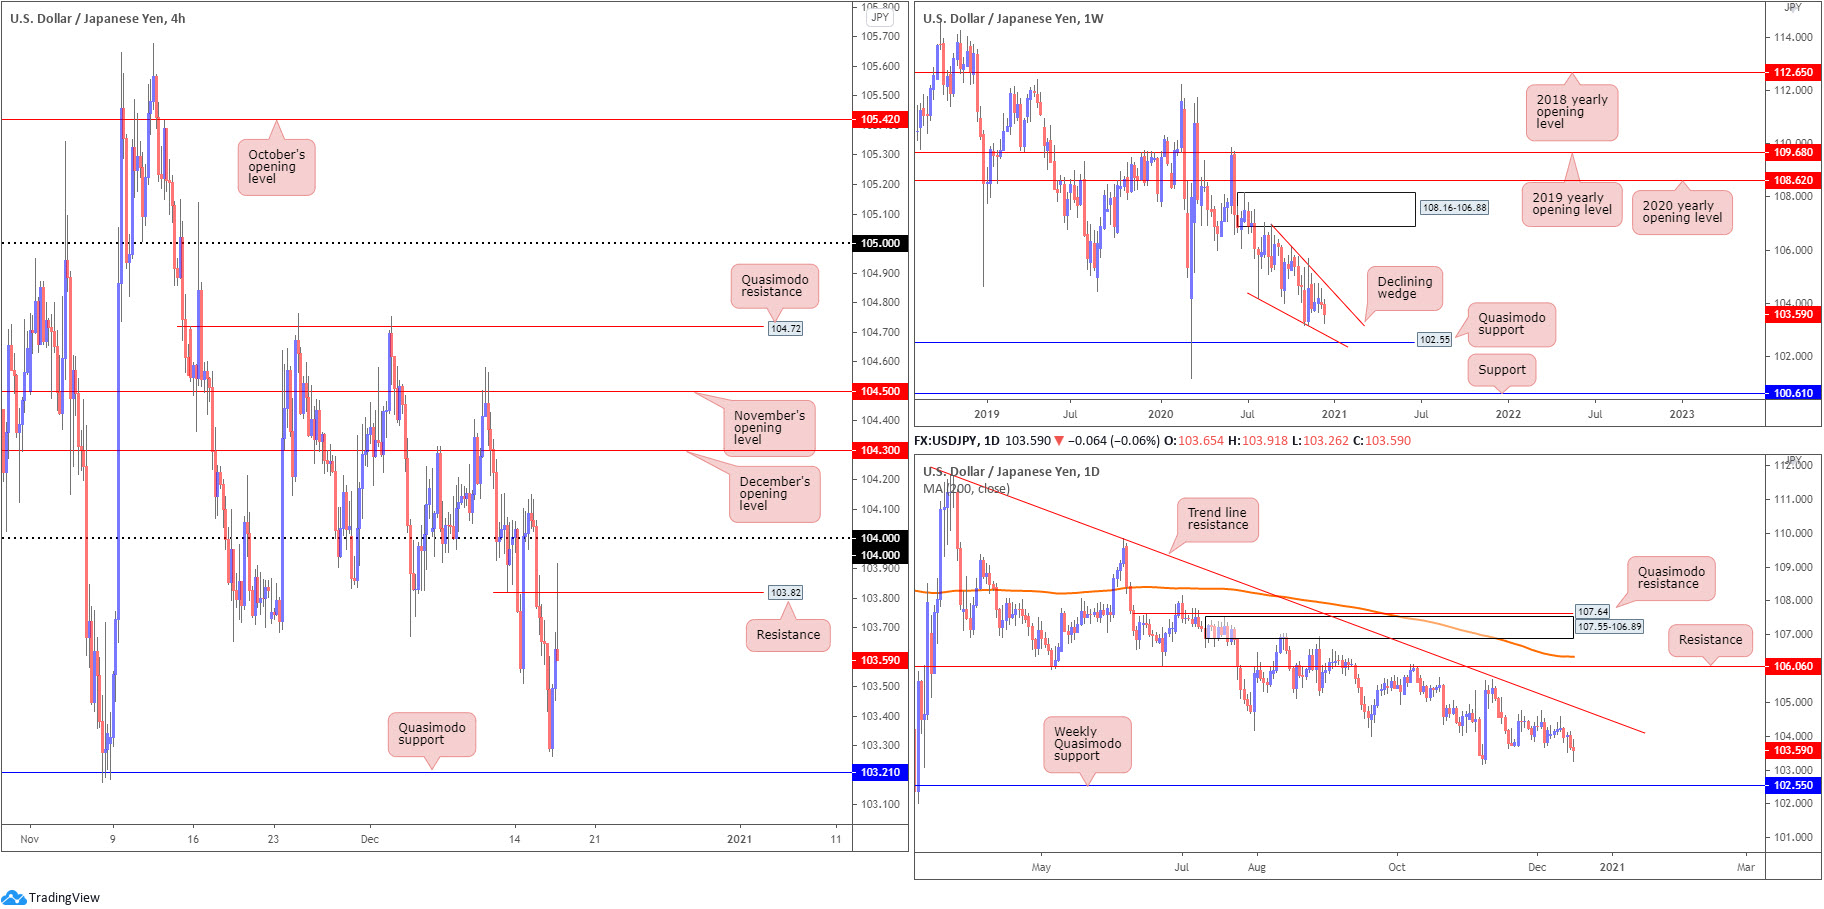
Recent hours observed USD/JPY stab into offers around H4 resistance taken from 103.82 (prior Quasimodo support), following an earlier bottom ahead of H4 Quasimodo support plotted at 103.21. Candlestick followers will acknowledge recent movement is on course to form a shooting star pattern. In terms of additional levels, 104 calls for attention north of price, while beneath 103.21 the 103 figure is seen.
Based on the weekly timeframe, limited change is seen. Since connecting with the underside of weekly supply at 108.16-106.88 in August, price has gradually shifted lower and developed a weekly declining wedge (106.94/104.18). Quasimodo support at 102.55 is also in the picture, with a break revealing support plotted at 100.61. A strong bounce from 102.55, however, may provide enough impetus for buyers to attempt a breakout above the current declining wedge.
From the daily timeframe, the technical landscape reveals possible support lurking around the 103.17 November 6 low (set just under H4 Quasimodo support at 103.21), followed by the noted weekly Quasimodo support at 102.55.
Areas of consideration:
- The possible H4 shooting star formed off H4 resistance at 103.82 could draw bearish interest, targeting H4 Quasimodo support at 103.21, stationed close by the 103 area.
USD/CAD:
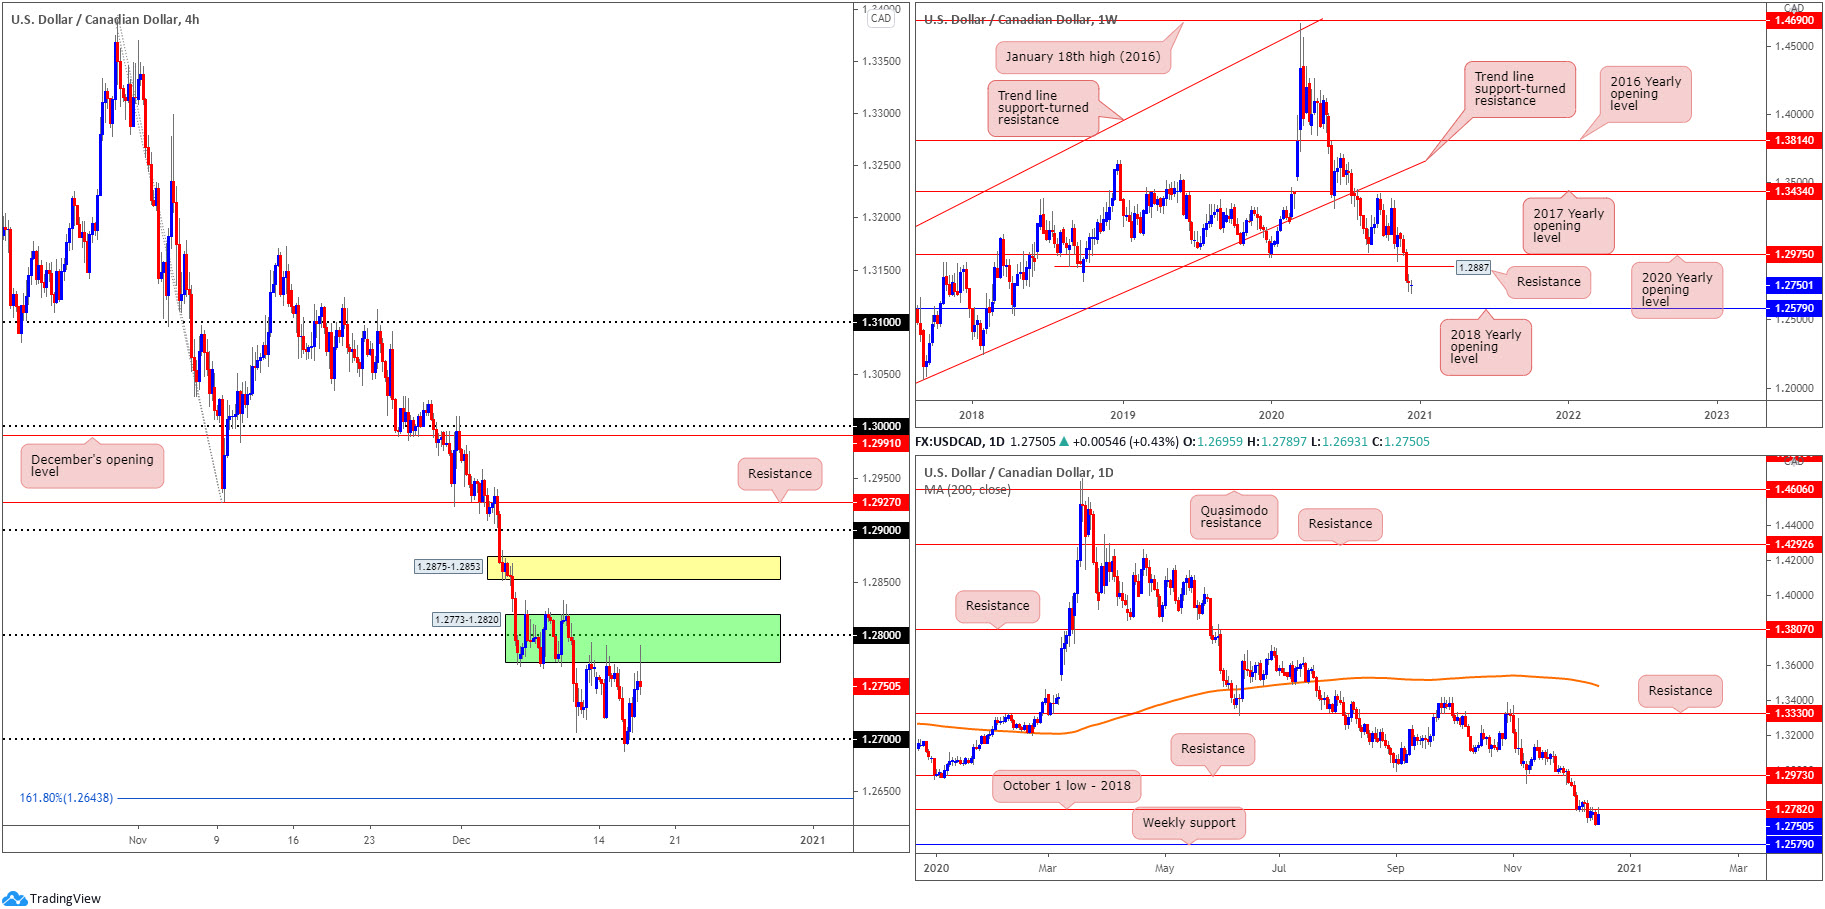
The 1.27 figure welcomed price action heading into Tuesday’s close, providing buyers some fresh legs to retest the underside of a familiar H4 range between 1.2773-1.2820 Wednesday. Candlestick fans will also acknowledge the test is on course to form a shooting star pattern (generally viewed as a bearish cue). Above 1.2773-1.2820, supply at 1.2875-1.2853 is visible, while beneath 1.27 the 161.8% Fibonacci projection point can be found at 1.2643.
Meanwhile, on the weekly timeframe, recent weeks witnessed price elbow through the 2020 yearly opening value at 1.2975 and Quasimodo support coming in at 1.2887. With both 1.2975 and 1.2887 depicting resistance, sustained downside places the 2018 yearly opening value at 1.2579 in the firing line. Also important to note is that long-term flow has been pointing lower since topping in March.
In conjunction with the weekly timeframe, last week’s selling set aside bids at daily support from 1.2782 (October’s low, 2018), consequently enhancing the weekly timeframe’s bearish stance towards the 2018 yearly opening value. It is also worth highlighting that 1.2782 was retested yesterday as the level resides around the lower edge of the H4 range.
Areas of consideration:
- The (possible) H4 shooting star pattern established off the lower edge of the H4 range between 1.2773-1.2820 could be enough to stimulate fresh selling, with sellers likely to pursue at least 1.27.
- Should H4 secure position south of the 1.27 handle, this will likely have additional sellers enter flow towards the 161.8% Fibonacci projection point at 1.2643. Follow-through selling beyond 1.2643 is also possible, according to the higher timeframes, suggesting 1.26 could be on the table, followed by weekly support at 1.2579 (the 2018 yearly opening value).
USD/CHF:
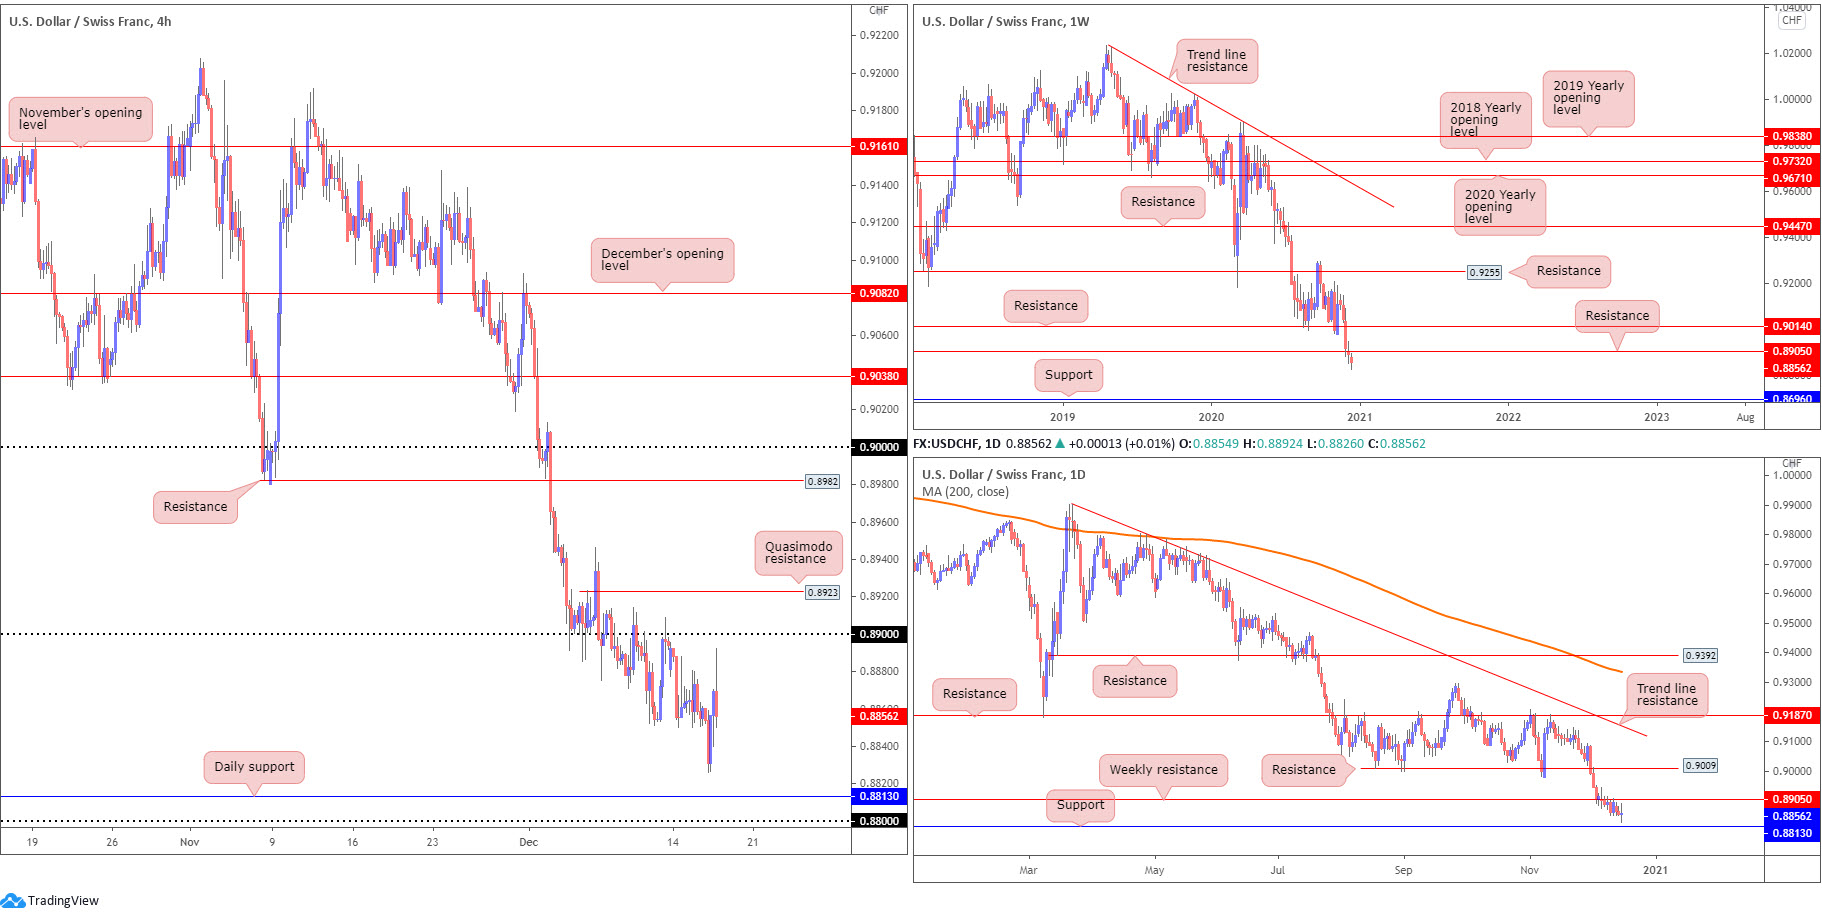
Downside momentum has subsided since the beginning of December, with H4 compressing (seemingly clearing out sellers as price explores lower terrain) towards daily support priced in at 0.8813, closely shadowed by the 0.88 handle on the H4 chart. Overhead, the 0.89 handle resides close by, with a break exposing Quasimodo resistance at 0.8923.
The technical landscape on the weekly timeframe remains unchanged, showing price drifting beneath resistance from 0.8905. While buyers could still attempt a recovery, traders are urged to pencil in the possibility of refreshing multi-year lows and shining the limelight on support at 0.8696. Interestingly, the trend in this market has been lower since early 2019.
The framework on the daily timeframe reveals candle action languishing under weekly resistance at 0.8905. Below 0.8905 on the daily scale, however, support is seen at 0.8813. Wednesday’s trade, however, chalked up a clear indecision candle. Given the overall picture in this market, this is unlikely to be a reversal signal, more likely a pause before downside resumes.
Areas of consideration:
- According to all three charts analysed above, each points to a bearish theme, at least until we cross swords with daily support at 0.8813 and the 0.88 handle on the H4 scale. A H4 retest at 0.89 would likely appeal to sellers, though a H4 close under 0.8850 might also lure bearish interest.
Dow Jones Industrial Average:
The Dow Jones Industrial Average dropped 44.77 points, or 0.15%; the S&P 500 advanced 6.55 points, or 0.18% and the Nasdaq rallied 63.13 points, or 0.50%.
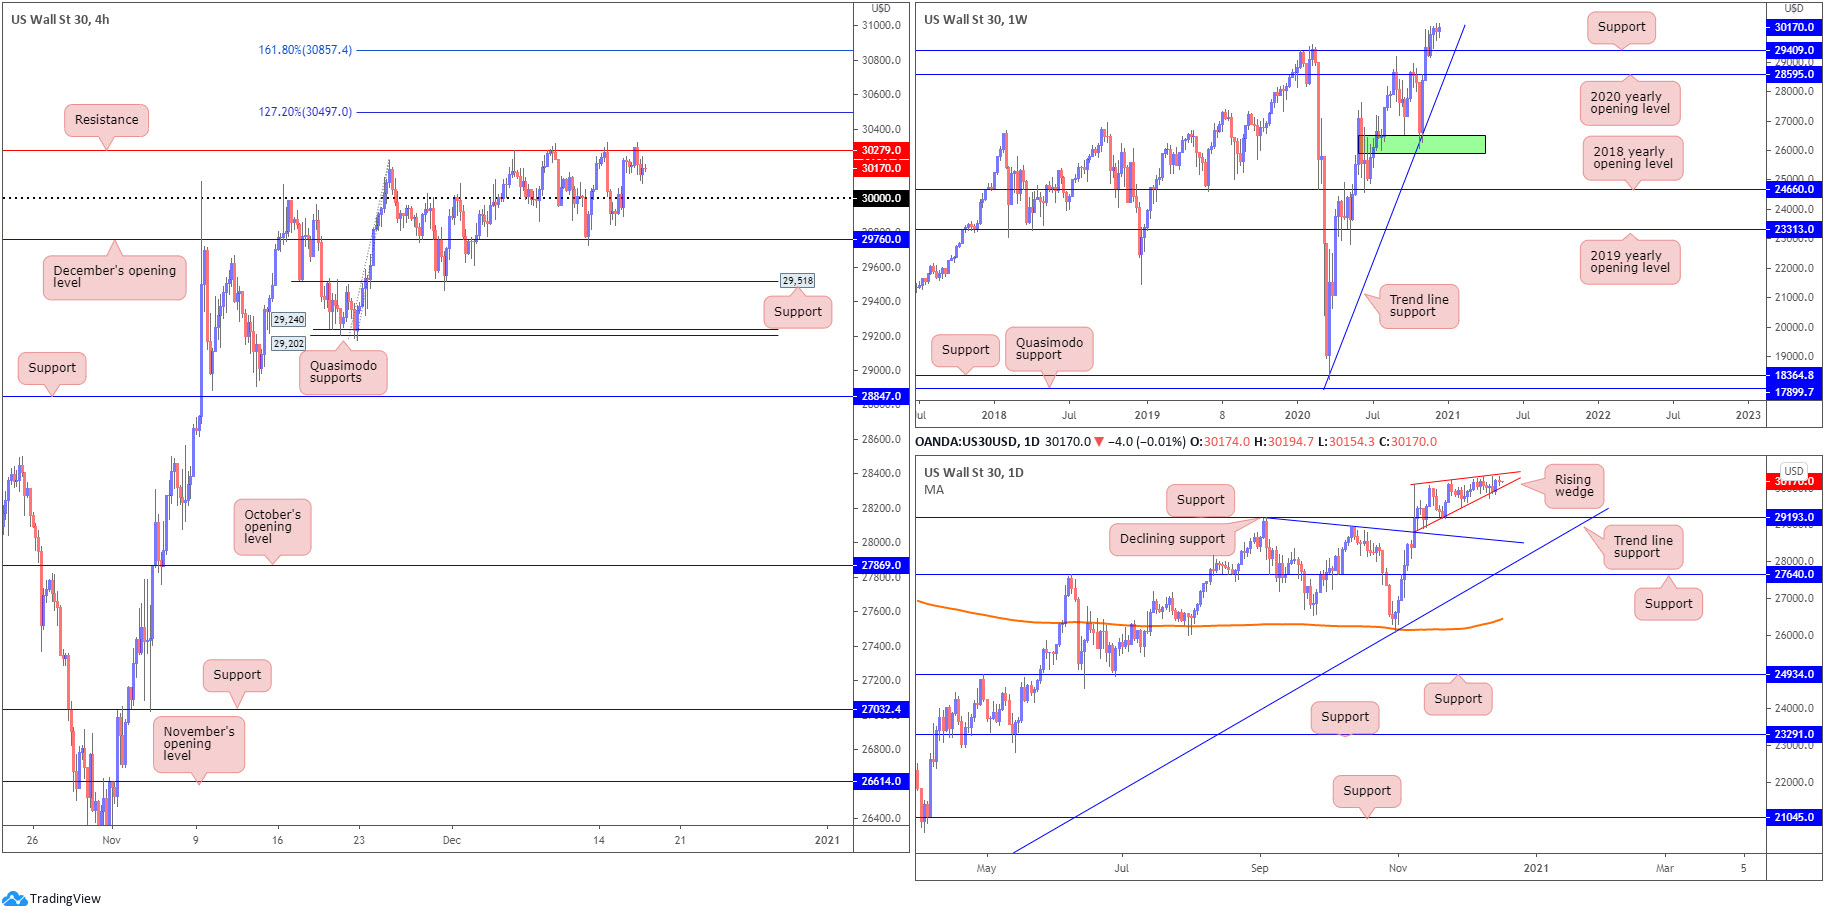
Technically speaking, there was limited change observed on the DJIA Wednesday, with H4 clinging to resistance at 30,279 (around YTD pinnacles), following Tuesday’s 30,000 break. Clearing 30,279 not only calls for fresh all-time highs, it also shines the spotlight on the 127.2% and 161.8% Fibonacci projection points at 30,497 and 30,857, respectively.
Further out on the weekly timeframe, we can see that should the unit correct, support at 29,409 (prior Quasimodo resistance) could be an area dip-buyers find interest in. The 2020 yearly opening value from 28,595 is also in the frame, tied together with trend line support, taken from the low 18,213. According to the daily timeframe, support is seen at 29,193. Pattern traders may also acknowledge the rising wedge forming between 28,940/30,097.
Areas of consideration:
Outlook unchanged due to lacklustre movement on Wednesday.
- Retesting 30,000 may draw buyer interest to take on H4 resistance at 30,279, followed by 30,497 and 30,857.
- A close below the daily rising wedge pattern could see sellers force a retest at daily support from 29,193. This would take H4 through supports at 29,760 and 29,518 to test Quasimodo supports at 29,202 and 29,240.
XAU/USD (GOLD):
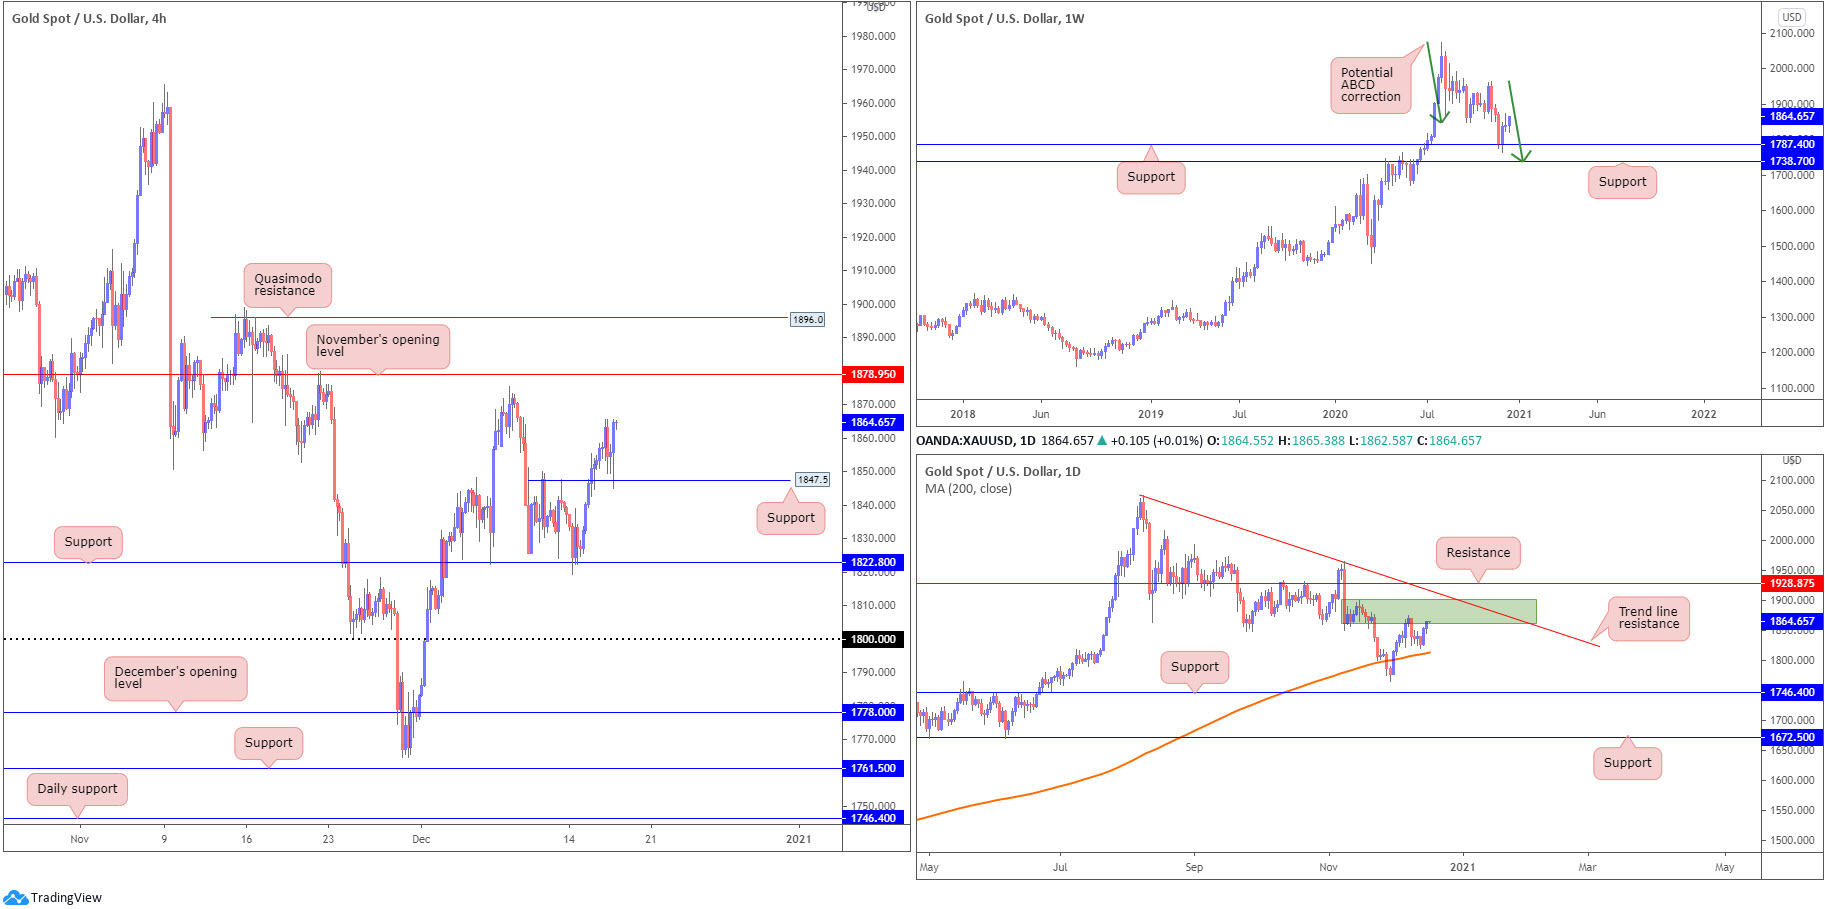
Dollar softness underpinned the yellow metal on Wednesday, with XAU/USD extending recovery gains by 0.6%. H4 support made an appearance at $1,847 in recent movement, throwing the $1,875 December 8th peak in the mix, closely shadowed by November’s opening value priced in at $1,878.
Higher up on the curve, despite last week’s action finishing significantly off best levels, the week currently trades higher by nearly 1.5%. Ultimately, weekly price is seen holding off support at $1,787 (sited ahead of another support at $1,738 and a potential ABCD correction [green arrows]).
The fact the yellow metal has been decisively trending higher since the beginning of 2016 adds to the bullish narrative off $1,787.
Meanwhile, on the daily chart, yesterday’s upside extension pulled price into supply around $1,870ish (green zone), an area that contained upside last week. Below current price, traders may acknowledge dynamic support rests close by at the 200-day SMA (orange – $1,813), while directly north of supply hangs trend line resistance, taken from the high $2,075.
Areas of consideration:
- The strong reaction from H4 support at $1,847 is likely to have interested buyers, due to where price is trading from on the weekly chart. H4 buyers are likely targeting November’s opening value priced in at $1,878, followed by H4 Quasimodo resistance at $1,896.
The accuracy, completeness and timeliness of the information contained on this site cannot be guaranteed. IC Markets does not warranty, guarantee or make any representations, or assume any liability regarding financial results based on the use of the information in the site.
News, views, opinions, recommendations and other information obtained from sources outside of www.icmarkets.com.au, used in this site are believed to be reliable, but we cannot guarantee their accuracy or completeness. All such information is subject to change at any time without notice. IC Markets assumes no responsibility for the content of any linked site.
The fact that such links may exist does not indicate approval or endorsement of any material contained on any linked site. IC Markets is not liable for any harm caused by the transmission, through accessing the services or information on this site, of a computer virus, or other computer code or programming device that might be used to access, delete, damage, disable, disrupt or otherwise impede in any manner, the operation of the site or of any user’s software, hardware, data or property


