
A note on lower timeframe confirming price action…
Waiting for lower timeframe confirmation is our main tool to confirm strength within higher timeframe zones, and has really been the key to our trading success. It takes a little time to understand the subtle nuances, however, as each trade is never the same, but once you master the rhythm so to speak, you will be saved from countless unnecessary losing trades. The following is a list of what we look for:
- A break/retest of supply or demand dependent on which way you’re trading.
- A trendline break/retest.
- Buying/selling tails – essentially we look for a cluster of very obvious spikes off of lower timeframe support and resistance levels within the higher timeframe zone.
- Candlestick patterns. We tend to only stick with pin bars and engulfing bars as these have proven to be the most effective.
For us, lower timeframe confirmation starts on the M15 and finishes up on the H1, since most of our higher timeframe areas begin with the H4.
EUR/USD:
The impact of yesterday’s highly anticipated Fed decision saw the Fed Funds Rate increased by 25 basis points, which sent the U.S dollar higher across the board. The impact of the Fed’s action was relatively modest on the EUR/USD, as price only managed to touch base with H4 demand coming in at 1.0879-1.0899, following a rather vicious spike north towards psychological resistance 1.1000.
Considering the location of current price, there appears to be a potential H4 bullish Gartley pattern forming, which terminates very nicely around the mid-level support 1.0850. Not only is this pattern’s completion point bolstered by a weekly range demand at 1.0519-1.0798, it is also supported by a combined daily demand/swap support area at 1.0796-1.0870.
Given the above, we are looking for the current H4 demand to be consumed today, and prices drive lower to connect with the above said area of confluence. Personally, we are not looking for a ‘to-the-pip’ touch here as this market could very easily fake lower (within the pink circle). Therefore, our plan of attack will be on looking for lower timeframe buy entries within this area.

Levels to watch/live orders:
- Buys: 1.0850/1.0813 is an area we’ll be watching for lower timeframe buy entries.
- Sells: Flat (Stop loss: N/A).
GBP/USD:
For those who read our previous report on Cable (http://www.icmarkets.com/blog/wednesday-16th-december-all-eyes-on-the-fed-today-traders/), you may recall us highlighting to watch for the H4 demand area marked with a black arrow at 1.5007-1.5023 to be faked into psychological support 1.5000 (combined with a deep 88.6% Fibonacci level at 1.4990). As can be seen from the H4 chart, this did indeed happen, but unfortunately we were unable to spot a lower timeframe entry here. Well done to any of our readers who managed to lock in some green pips from this brief bounce.
Following this the Fed’s decision to raise rates the Pound traded down to lows of 1.4958 (forming a nice-looking double-bottom formation between this low and the 8th December low at 1.4956), before closing around 1.5000 by the day’s end.
Technically, the trend on the GBP is still southbound in our estimation, but is at the same time lurking within both weekly and daily demand right now (1.4855-1.5052/1.4956-1.5005 [underpinned by both a daily demand at 1.4856-1.4925, and a relatively long-term daily trendline taken from the low 1.4565]). As such, we could see the market bounce once again from the 1.5000 region this week. In addition to this, the vicious spike north seen yesterday up to psychological resistance 1.5100 likely cleared out the majority of offers around mid-level resistance 1.5050 for further buying.
To that end, our prime focus today will, once again, be on looking for lower timeframe buy entries around the 1.5000 region, targeting 1.5050 first and foremost.
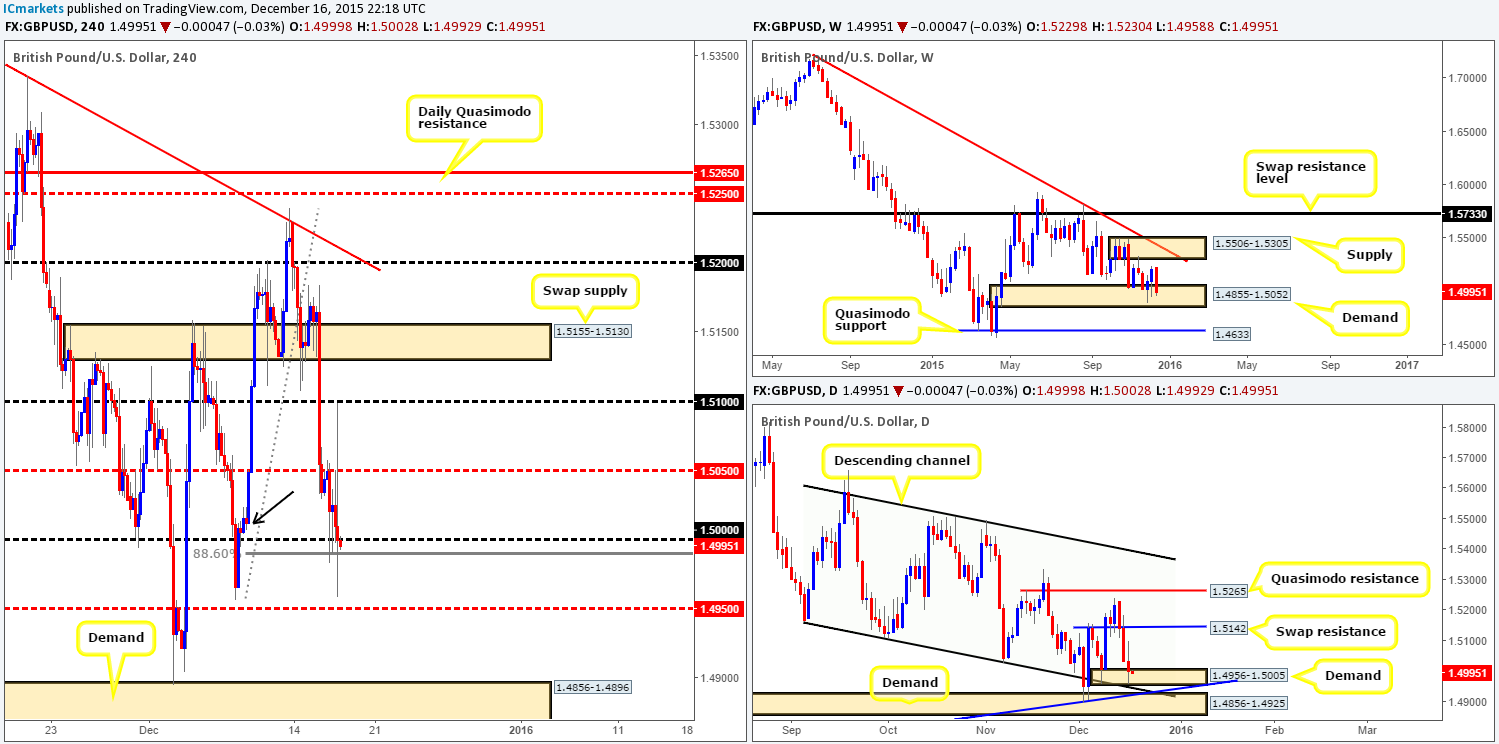
Levels to watch/ live orders:
- Buys: 1.5000 [Tentative – confirmation required] (Stop loss: dependent on where one confirms this level).
- Sells: Flat (Stop loss: N/A).
AUD/USD:
The impact of yesterday’s speech from Yellen was mixed on the Aussie dollar in our opinion, with price forming what looks to be a large H4 indecision candle. Alongside this, the weekly picture shows that price continues to be held lower by supply coming in at 0.7438-0.7315, and daily action is seen currently whipsawing between swap resistance at 0.7269 and a swap support at 0.7159.
In all honesty, with the above taken on board, the only levels that jump out to us this morning are as follows:
Sells:
- The H4 swap resistance level at 0.7282 (offers likely removed from 0.7250 from yesterday’s spike higher). This barrier sits on top of the above said daily swap (resistance) level, thus making it a hurdle which could repel prices. Lower timeframe confirmation would be needed here before we’d take a trade simply because a fakeout is possible up to psychological resistance 0.7300, which sits fifteen pips below the aforementioned weekly supply.
Buys:
- H4 demand taken from 0.7151-0.7167. Not only does this demand encapsulate the 61.8% Fibonacci level at 0.7154, it also is underpinned by a daily swap (support) level mentioned above at 0.7159. In addition to this, the spike lower generated from the Fed’s announcement yesterday likely took out the majority of bids from 0.7200, thus clearing the path down to our H4 demand base. Nevertheless, one cannot be too careful here. We mustn’t forget that weekly action is currently selling off from supply at 0.7438-0.7315, so we would recommend only entering long here if one can spot lower timeframe buying strength around this area beforehand.
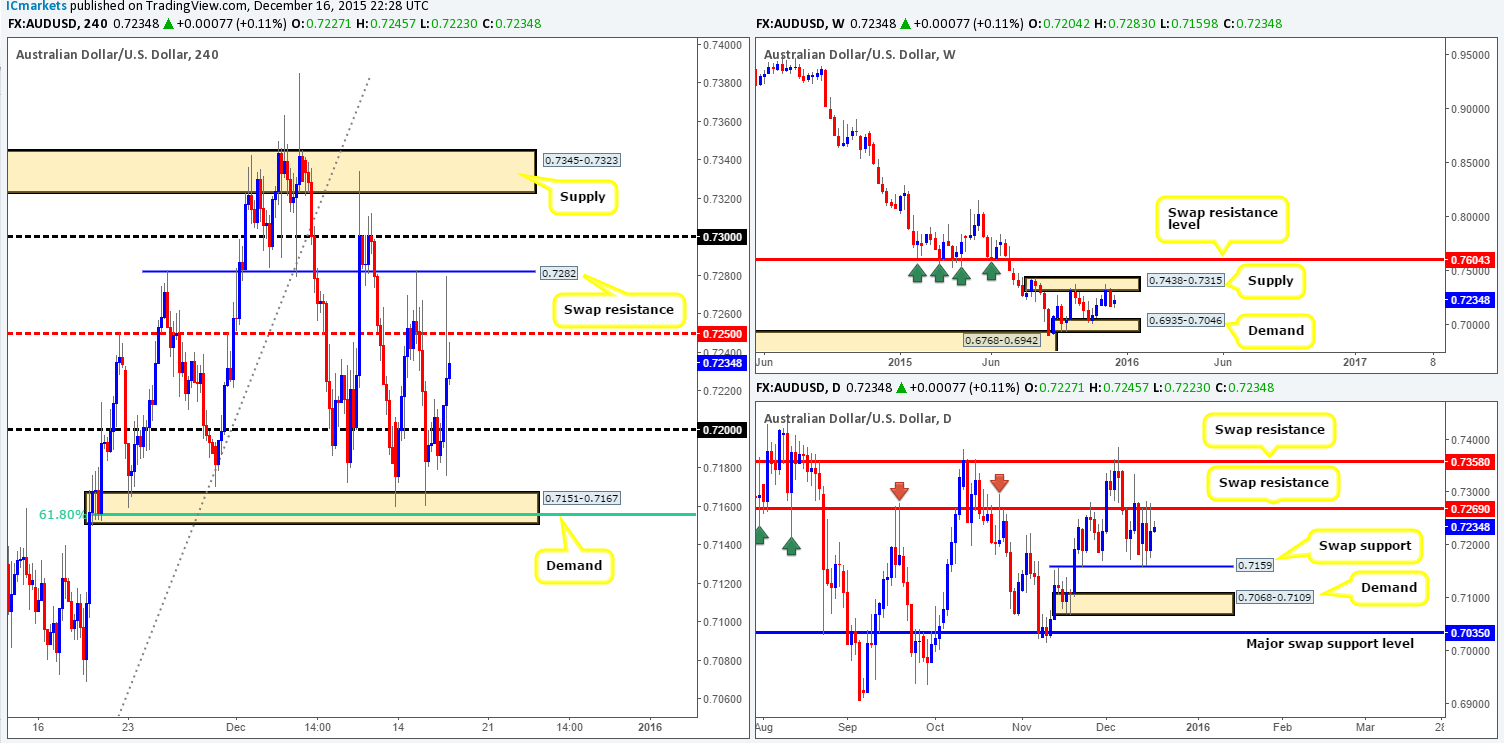
Levels to watch/ live orders:
- Buys: 0.7151-0.7167 [Tentative – confirmation required] (Stop loss: dependent on where one confirms this area).
- Sells: 0.7282 [Tentative – confirmation required] (Stop loss: dependent on where one confirms this level).
USD/JPY:
The USD/JPY pair, as you can see, drove higher on the back of the Fed’s decision to hike rates yesterday. This upside move engulfed offers around psychological resistance 122.00, which then cleared the path north for prices to drive into the H4 swap (supply) area seen at 122.22-122.42 (a noted area to look for confirmed shorts in our previous report).
With offers seen holding within this H4 area right now, let’s take a peek at what the higher timeframes are up to. The daily picture shows that yesterday’s rally has pushed prices into the jaws of a swap resistance level coming in at 122.22, which if you look to the left of current price, you’ll see recently provided this market with a relatively significant floor of support from mid-November to mid-December. Meanwhile, up on the weekly chart, we can see that prices are now trading slightly above a weekly swap (resistance) area at 122.01-121.40.
On account of the above, our team is going to focus their energy on looking for lower timeframe sell entries into the market within the current H4 swap supply zone, targeting 122.00 first and foremost. Should this area give way, however, we see little resistance to stop prices rallying up to at least 122.84. In the event this takes place and a retest is seen alongside lower timeframe confirming price action to buy, we would, dependent on the time of day, consider a long from here.
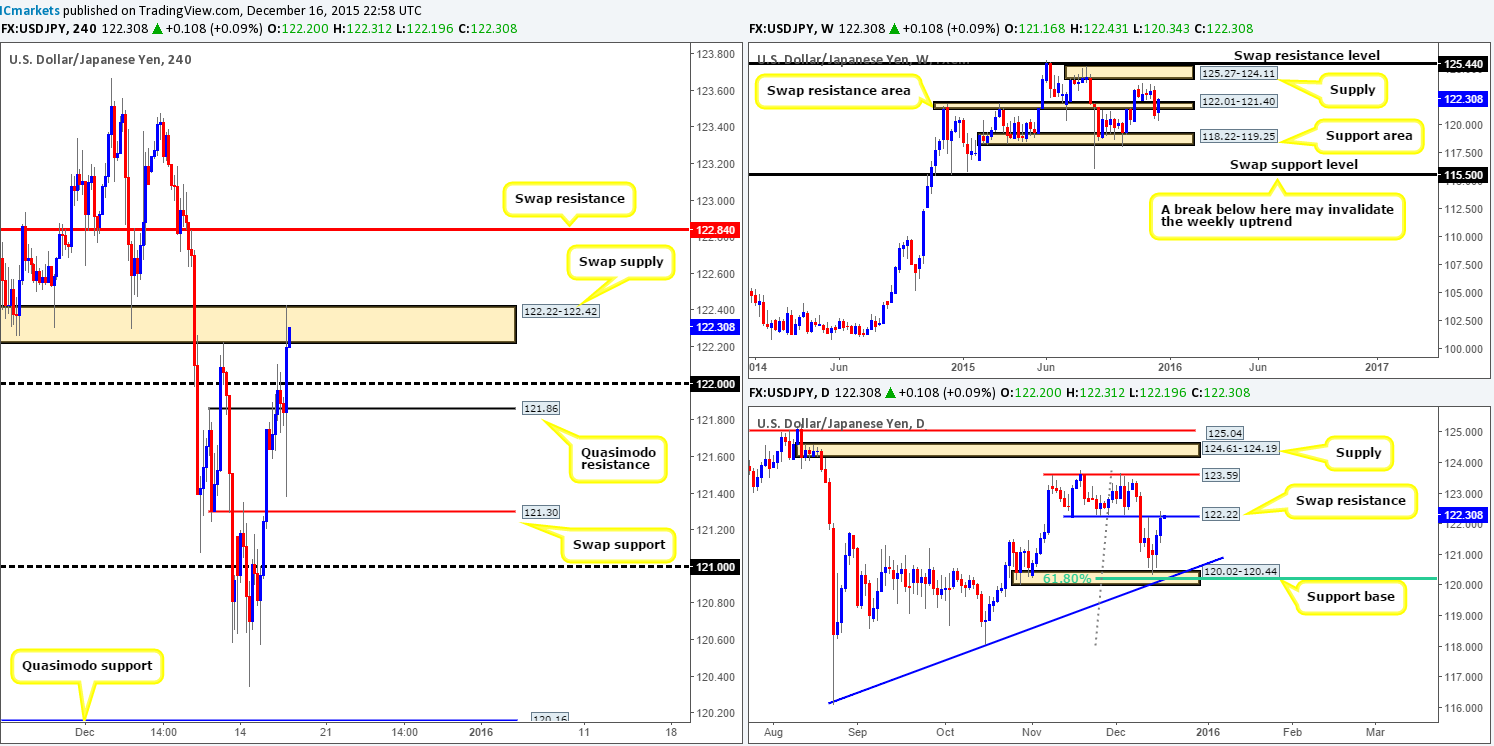
Levels to watch/ live orders:
- Buys: Watch for offers to be consumed around 122.22-122.42 and then look to trade any retest seen thereafter (confirmation required).
- Sells: 122.22-122.42 [Tentative – confirmation required] (Stop loss: dependent on where one confirms this area).
USD/CAD:
Early on in yesterday’s London session, we can see price was bid above mid-level resistance at 1.3750. The market held above this number going into the Fed’s highly anticipated speech. Consequent to this, a H4 indecision candle was painted, which, as you can see, forced price to retest 1.3750 as support. This was a noted move to watch for in our previous report – unfortunately we missed this since the market moved too fast to secure a lower timeframe entry.
Up on the bigger picture, yesterday’s movement saw price rally from a daily swap (support) level at 1.3721, with room seen to continue higher this week up to supply drawn from 1.4001-1.3904. Over on the weekly chart, recent action pierced weekly supply at 1.3818-1.3630, likely taking a ton of buy stops out of the market. To us, this suggests further upside is possible. However, when you take a quick look at the weekly action on oil, you’ll see it’s currently trading around some very heavy support at the $34.60 region, indicating a reversal may take place.
Quite frankly, the only logical opportunity we see today is if price closes above psychological resistance 1.3800 and retests it as support (confirmation required) without connecting with the mid-level resistance 1.3850. Should all go to plan and we manage to secure a lower timeframe entry at 1.3800, targets for this trade fall in at 1.3850, followed by 1.3900 (the underside of oncoming daily supply at 1.4001-1.3904).
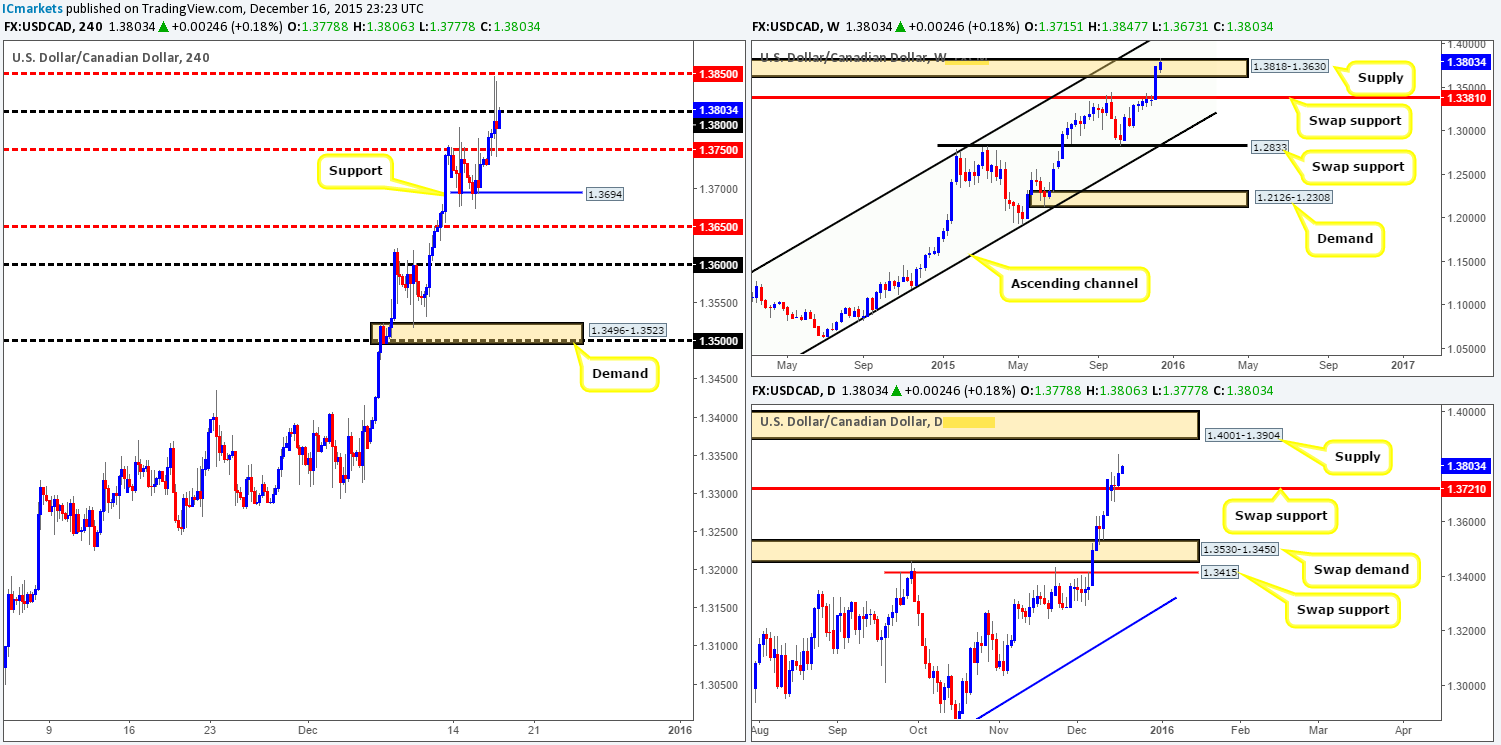
Levels to watch/ live orders:
- Buys: Watch for offers to be consumed around 1.3800 and then look to trade any retest seen thereafter (confirmation required).
- Sells: Flat (Stop loss: N/A).
USD/CHF:
Prior to the Fed’s speech yesterday, the Swissy sold off from H4 supply coming in at 0.9944-0.9919. During the Fed’s appearance, as can be seen from the chart, this pair aggressively spiked lower to a daily swap (support) level at 0.9822, following with a rather abrupt bounce from here up to highs of 0.9920 into the close. As a consequence, there was not much change seen from Tuesday’s close 0.9910.
With the buyers and sellers now competing for position within the above said supply, would we consider this to be a stable enough platform in which to look for shorts today? Put simply, no we wouldn’t. Here’s why… following the whipsaw below the weekly swap (support) area at 0.9796-0.9902, this pair has continued to appreciate thus far. The next upside target on this timeframe to be aware of falls in at a recently faked supply drawn from 1.0239-1.0131. On top of this, we can also see that the daily swap (support) level at 0.9875 has so far held ground. Should the buyers continue trading above this region, further upside is certainly possible towards swap supply base coming in at 0.9989-1.0043.
Similar to yesterday’s report, barring the current H4 supply, the technical picture, at least to us, appears bullish right now, hence our lack of interest to short the aforementioned H4 supply. Be that as it may, before we become buyers in this market, we’d need to see this supply consumed and retested (with lower timeframe confirmation) as demand, effectively clearing the path up to at least parity on this timeframe.
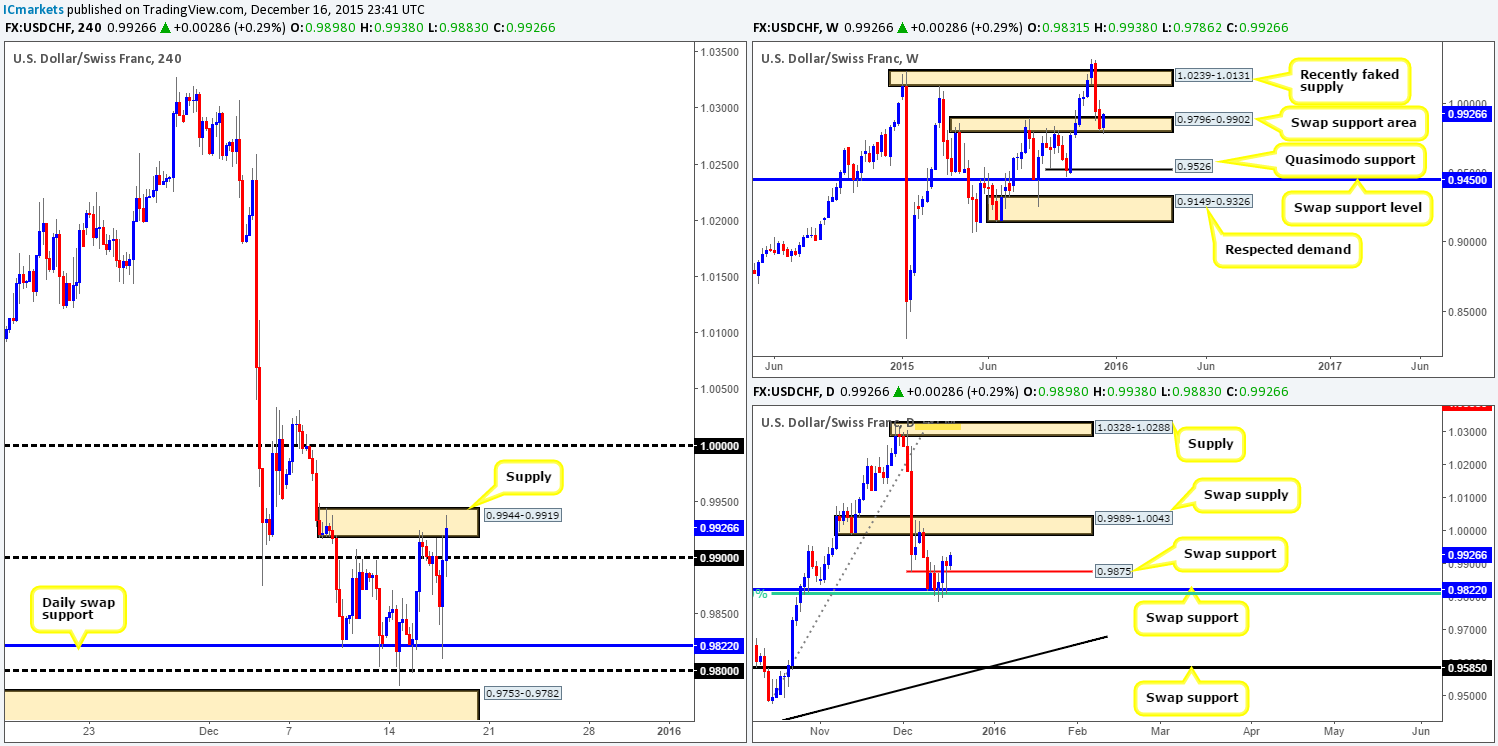
Levels to watch/ live orders:
- Buys: Watch for offers at 0.9944-0.9919 to be consumed and then look to trade any retest seen thereafter (confirmation required).
- Sells: Flat (Stop loss: N/A).
DOW 30
Following the Fed’s decision to raise interest rates yesterday, the DOW index increased in value consequently forcing prices above the H4 swap resistance (now support) level at 17658, finishing the day at highs of 17782. Due to the H4 supply consumption spikes marked with black arrows at 17768/17699, the path north looks very clear up to H4 supply area at 17880-17812.
What is more, in alignment with the current H4 structure is both the weekly and daily flow. The bounce from the weekly swap (support) level at 17135 continues to advance in the direction of the weekly trendline resistance taken from the high 18365. Regarding the daily picture, there appears little resistance in the way of price continuing to appreciate north up to supply drawn from 17977-17872 (converges nicely with the above said weekly trendline).
Given these points, our team is looking for price to pull back to the recently broken 17658 level and hold as support for a potential (confirmed) long into this market today. However, In the event that price reaches the H4 supply area at 17880-17812 (glued to the underside of the daily supply area mentioned above at 17977-17872) before retesting the H4 swap (support) level at 17658, we would consider the trade then to be invalid. The ideal scenario would be as per the red arrows.
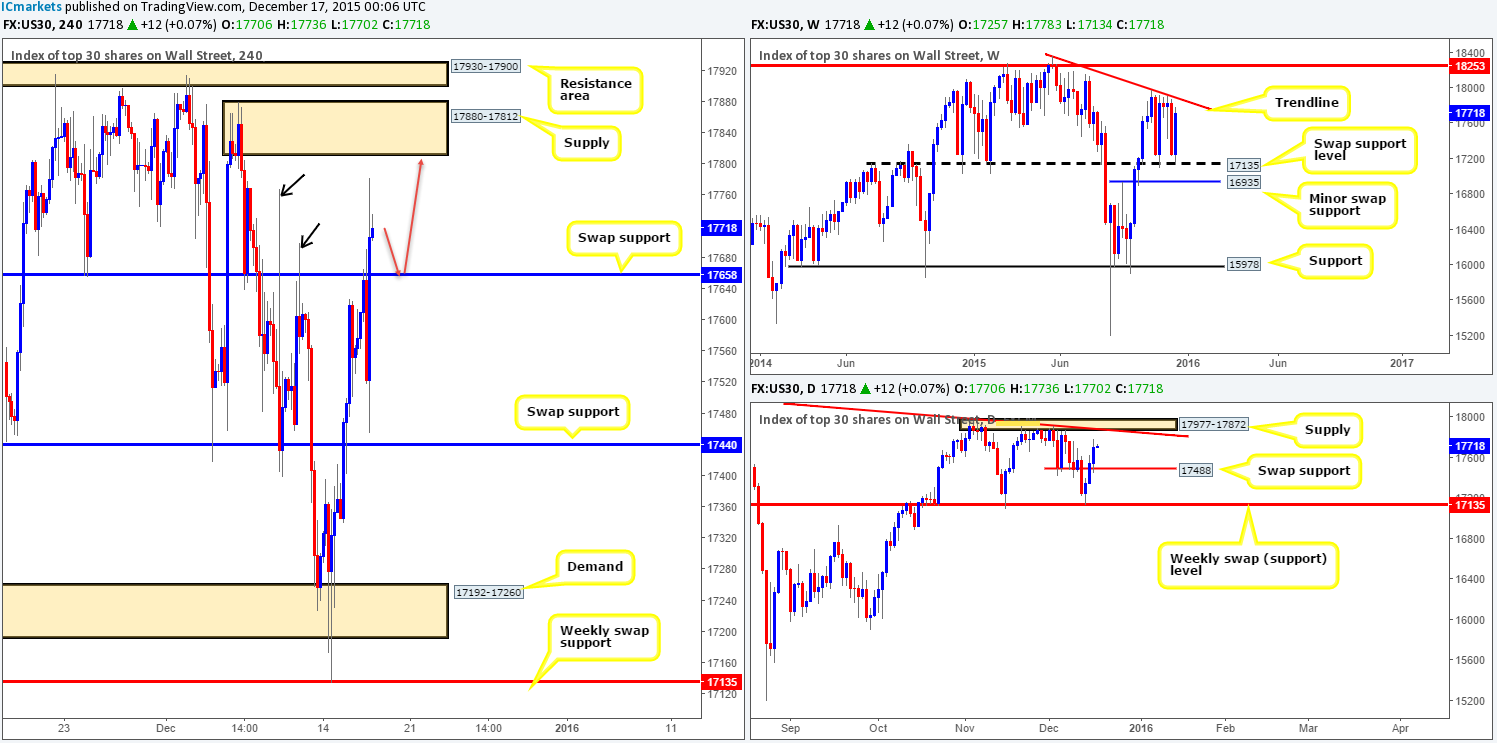
Levels to watch/ live orders:
- Buys: 17658 [Tentative – confirmation required] (Stop loss: dependent on where one confirms this level).
- Sells: Flat (Stop loss: N/A).
XAU/USD: (Gold)
The yellow metal initially reacted bearishly to the Fed’s decision to raise interest rates yesterday, but, as you can see, quickly bounced back from H4 demand at 1058.0-1062.4, with the high for the day (1078.2) just missing the H4 Quasimodo resistance level at 1078.9. To our way of seeing things right now, Gold is considered range bound between the two above said areas. Trading (with confirmation) this current H4 consolidation is certainly valid today, with a short from the upper boundary being the better trade to take in our opinion, due to it converging nicely with a daily swap (resistance) level at 1071.2. To be on the safe side here though guys, even with confirmation from the lower timeframes here, we’d still place our stop above the H4 trendline taken from the high 1098.0 lurking just above to avoid any fakeout that may take place.
With regards to the lower boundary of this H4 range: 1058.0-1062.4, this is still an area we’ll be looking at today. However, one should take into consideration that the top-side of weekly demand sits directly below it at 1054.8. This – coupled with the H4 Quasimodo support at 1052.6 has ‘fakeout’ written all over it! As a result, traders should also keep an eye on this region for potential (confirmed) buys today.
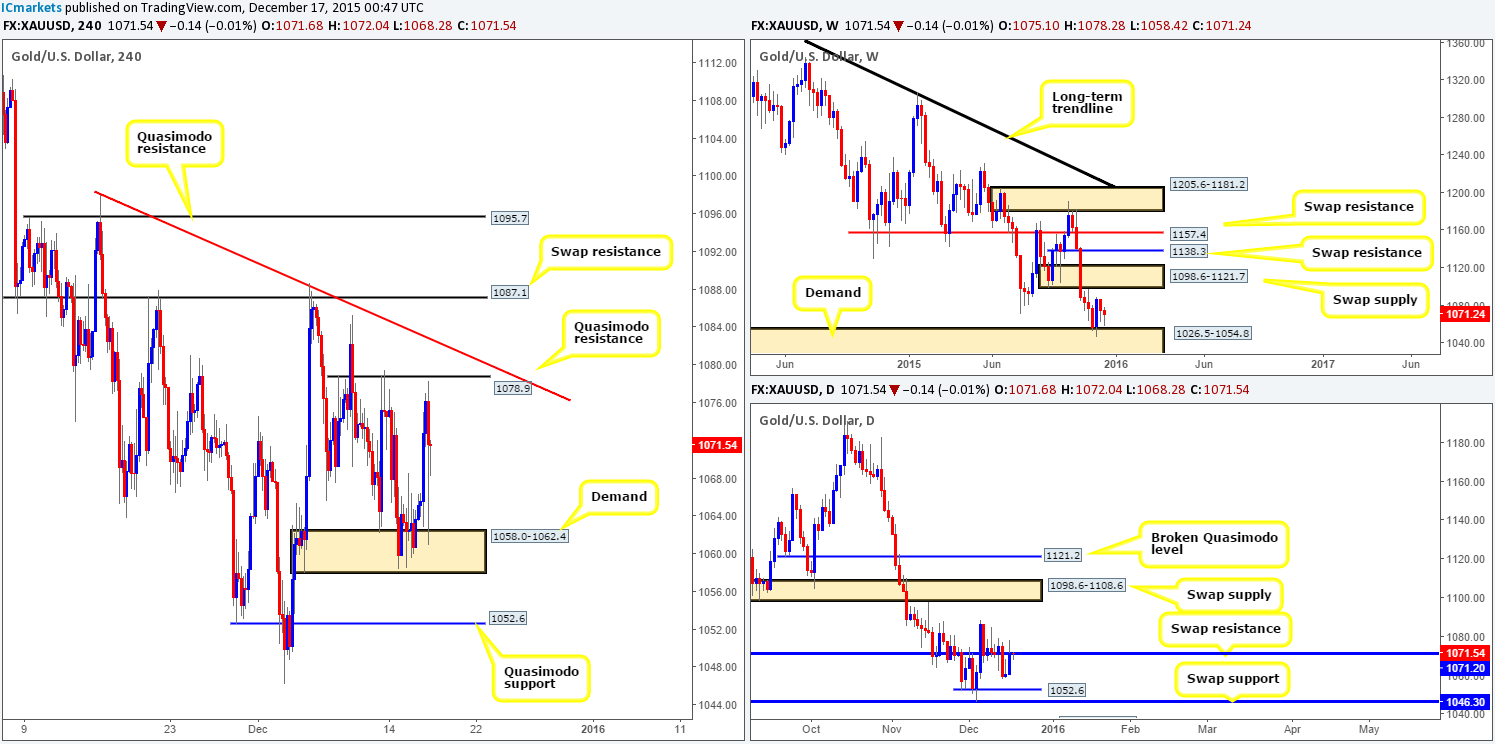
Levels to watch/ live orders:
- Buys: 1058.0-1062.4 [Tentative – confirmation required] (Stop loss: dependent on where one confirms this area). 1054.8/1052.6 [Tentative – confirmation required] (Stop loss: dependent on where one confirms this area).
- Sells: 1078.9 [Tentative – confirmation required] (Stop loss: dependent on where one confirms this level).


