A note on lower timeframe confirming price action…
Waiting for lower timeframe confirmation is our main tool to confirm strength within higher timeframe zones, andhas really been the key to our trading success. It takes a little time to understand the subtle nuances, however, as each trade is never the same, but once you master the rhythm so to speak, you will be saved from countless unnecessary losing trades. The following is a list of what we look for:
- A break/retest of supply or demand dependent on which way you’re trading.
- A trendline break/retest.
- Buying/selling tails – essentially we look for a cluster of very obvious spikes off of lower timeframe support and resistance levels within the higher timeframe zone.
- Candlestick patterns. We tend to only stick with pin bars and engulfing bars as these have proven to be the most effective.
For us, lower timeframe confirmation starts on the M15 and finishes up on the H1, since most of our higher timeframe areas begin with the H4.
EUR/USD:
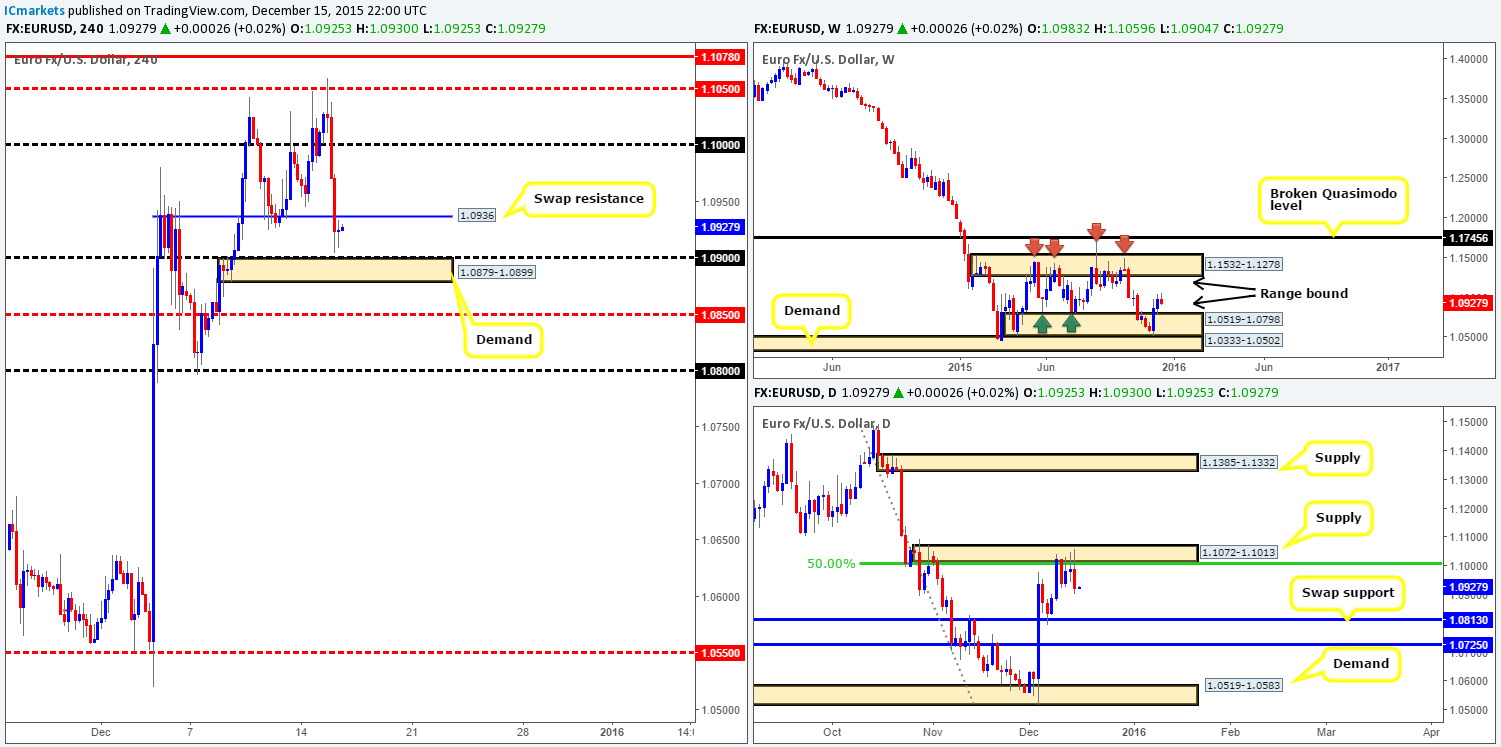
Starting from the top this morning, the weekly chart shows current movement is lurking within the lower limits of its range between demand at 1.0519-1.0798 and supply drawn from 1.1532-1.1278. Moving down one level to the daily chart, however, price sold off from supply coming in at 1.1072-1.1013 (converges 50.0% Fibonacci level at 1.1011), consequently engulfing three daily candles and setting a bearish tone ahead of the all-important Fed meeting today. Downside targets to keep an eye on fall in at the swap support level drawn from 1.0813, followed by another swap support at 1.0725, and possibly even demand coming in at 1.0519-1.0583.
Turning our attention to the H4 chart, yesterday’s selling which originated from the underside of mid-level resistance at 1.1050 engulfed multiple technical supports before stabilizing four pips above psychological support 1.0900 by the day’s end. It’s widely reported that the Fed will raise interest rates today, which could see this pair depreciate further. However, we trade what we see, not what we think, and right now there appears to be no logical entry into this market, apart from a break above and retest of 1.0936, targeting psychological resistance 1.1000. In spite of this, would you want to buy knowing price has just sold off from daily supply and is NOT YET touching base with the lower limits of the weekly range (see above)? We certainly wouldn’t. Therefore, we’ll remain on the sidelines for now and watch for further developments.
Levels to watch/live orders:
- Buys: Flat (Stop loss: N/A).
- Sells:Flat (Stop loss: N/A).
GBP/USD:
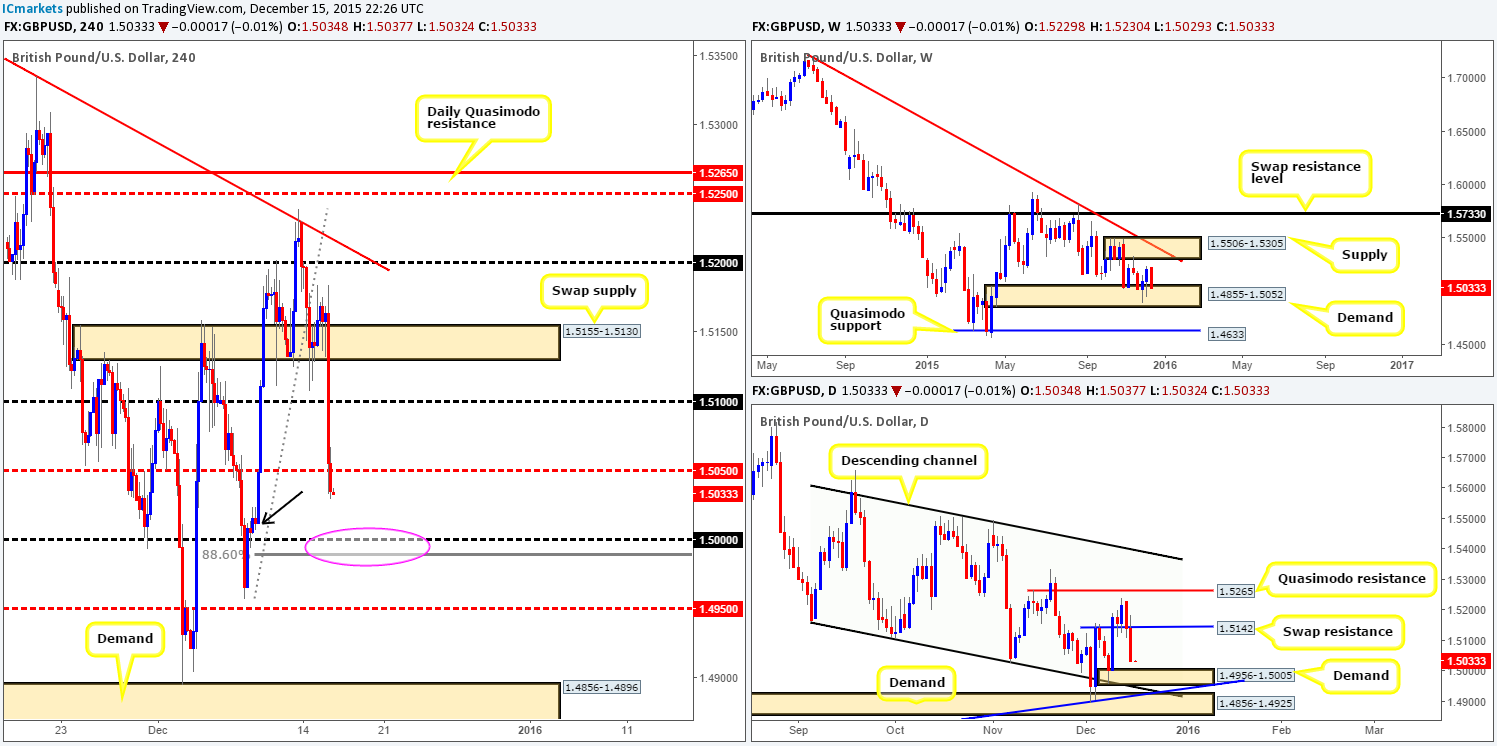
Beginning with the weekly timeframe this morning, we can see that after a short burst of buying from demand at 1.4855-1.5052, price is now trading back at the top-side of this area, suggesting bids are potentially weak here. Zooming in and looking at the daily structure, the recent two-day decline has forced price below swap support (now resistance) at 1.5142, and is now hovering above demand seen at 1.4956-1.5005 (underpinned by both a demand at 1.4856-1.4925, and a relatively long-term trendline taken from the low 1.4565).
Looking at the H4 chart, the most recent slump brought Cable below mid-level support 1.5050. Directly below this is a demand marked with a black arrow at 1.5007-1.5023. Usually we would consider this area a suitable platform in which to look for buys, but considering that the large psychological support 1.5000 combined with a deep 88.6% Fibonacci level at 1.4990 lurks just beneath (also sits just within both the above said weekly and daily demand areas [1.4855-1.5052/1.4956-1.5005[), we favor a fake of this demand before any buying can be seen. On account of this, technically our team is bullish from the 1.5000 region today as long as lower timeframe confirmation supports this. Fundamentally, nevertheless, the Fed’s decision later on today could alter any technical view we may have, so trade with caution today guys.
Levels to watch/ live orders:
- Buys: 1.5000 [Tentative – confirmation required] (Stop loss: dependent on where one confirms this level).
- Sells: Flat (Stop loss: N/A).
AUD/USD:
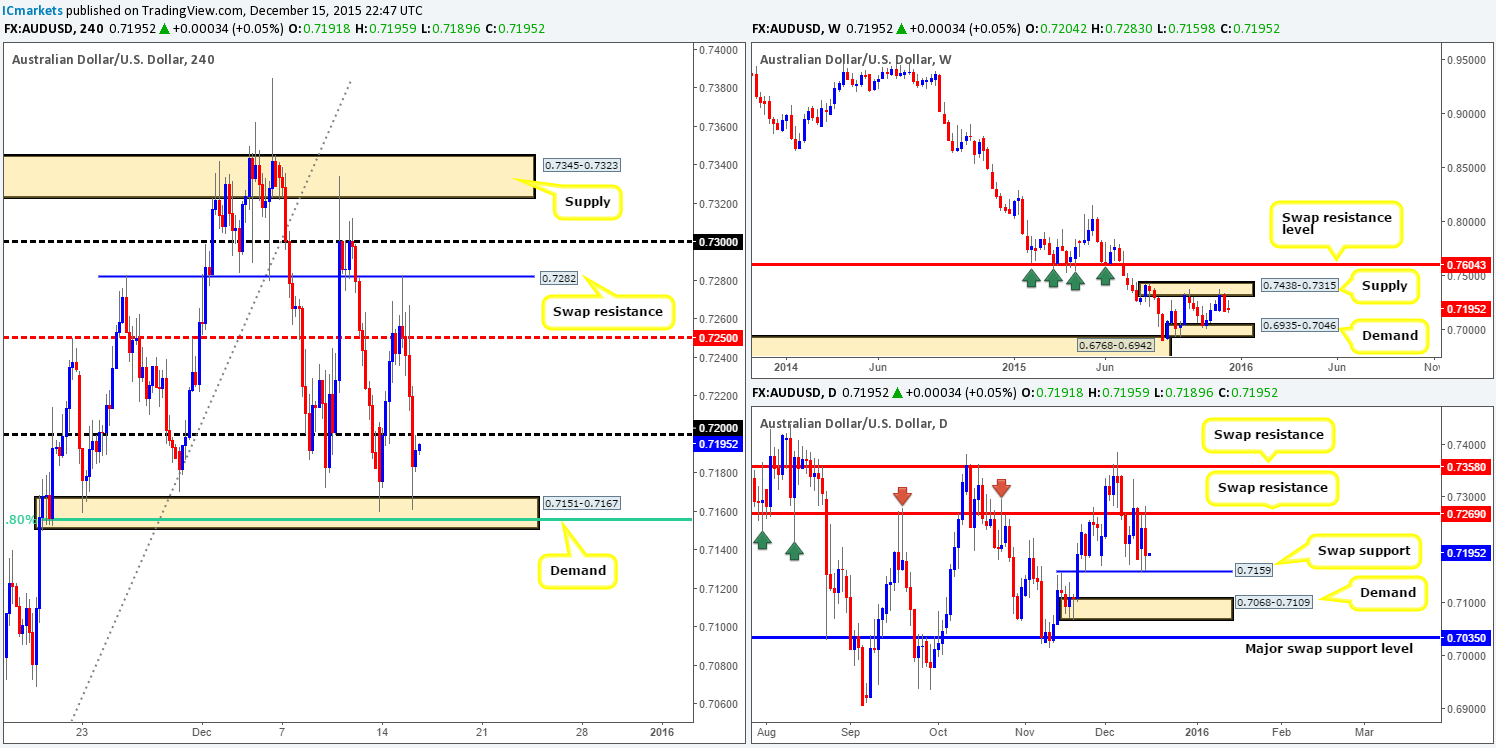
During the course of yesterday’s sessions, we saw the RBA minutes boost buying in the early hours of trade, forcing price to whipsaw up to a H4 swap resistance level drawn from 0.7282. It was from this point, the Greenback’s strength really started to flex its muscle. Psychological support at 0.7200 was taken out leaving price free to jab into bids sitting at H4 demand taken from 0.7151-0.7167. Not only does this demand encapsulate the 61.8% Fibonacci level at 0.7154, it also is underpinned by a daily swap (support) level at 0.7159.
However, as bullish as this sounds, one mustn’t forget that weekly action is currently selling off from supply at 0.7438-0.7315. Technically, we’d only be convinced that the buying from the current H4 demand is legit if we see a close above and retest of 0.7200. With this, we’ll have a clear path on the H4 to buy (with lower timeframe confirmation) up to at least 0.7250. Should this move come to fruition around news time, nonetheless, we’ll likely pass on the setup, since we are expecting some volatile moves in the markets today.
Levels to watch/ live orders:
- Buys: Watch for offers at 0.7200 to be consumed and then look to trade any retest seen thereafter (confirmation required).
- Sells: Flat (Stop loss: N/A).
USD/JPY:
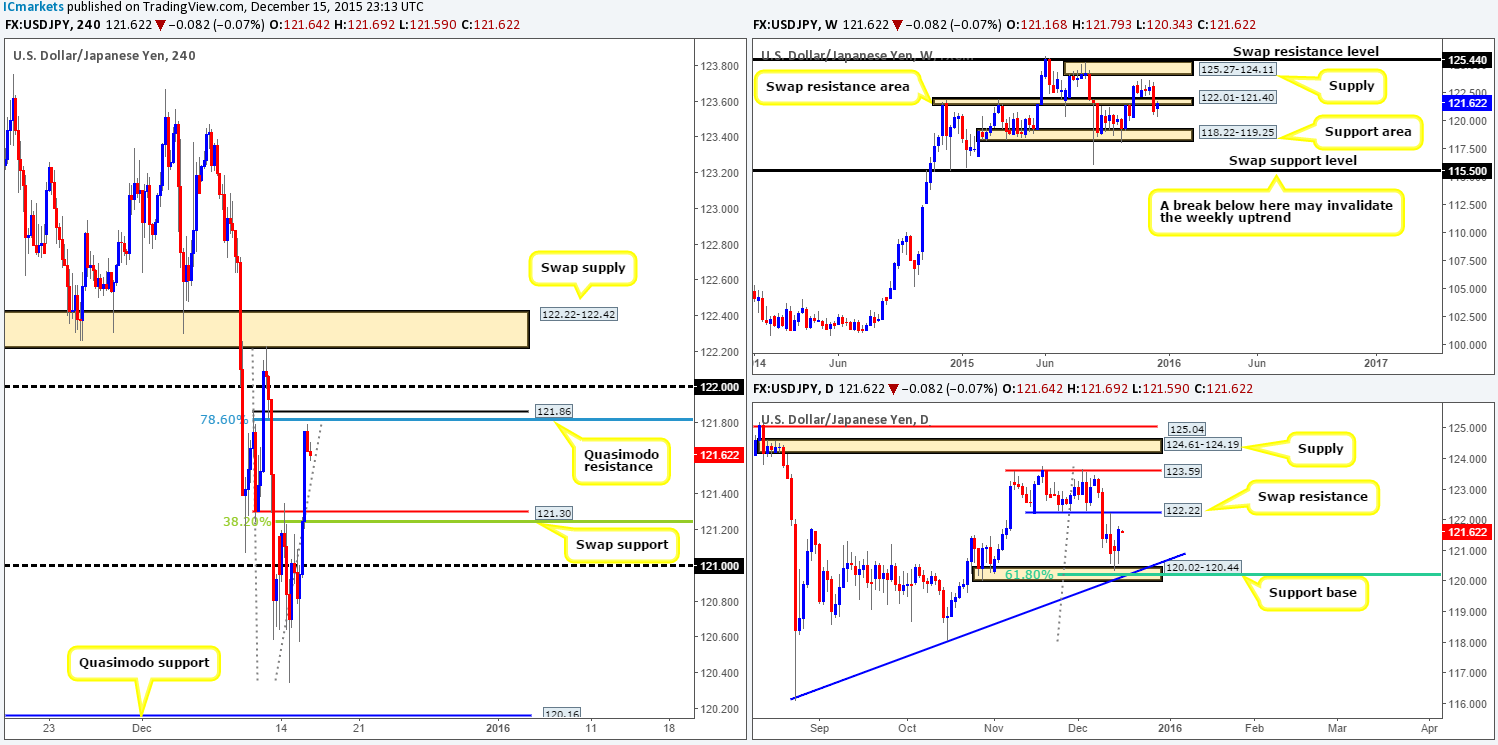
The value of the USD/JPY was heavily bid throughout the majority of yesterday’s trading, topping out for the day around the 121.79 mark. Given this, we have our eyes on the following areas today:
- The H4 swap (resistance) level at 121.86.This level – combined with a deep 78.6% Fibonacci level at 121.82 could provide a platform in which to look for a confirmed intraday bounce today. Be that as it may, a fakeout above is likely here to either the psychological resistance 122.00 or the daily swap (resistance) at 122.22, hence the need for confirmation.
- The H4 swap (support) level at 121.30. Much the same as the level highlighted above, we have a converging 38.2% Fibonacci level at 121.23 supporting this H4 base which could provide the bulls a floor to bounce prices today. We would advise only trading this should one be able to enter with lower timeframe confirmation, since a fake below to psychological support 121.00 could well take place.
- And finally, the H4 swap (supply) area at 122.22-122.42. This is probably the best area we have for you today. It converges nicely with the daily swap (resistance) level at 122.22 and is also positioned very close to the weekly swap (resistance) area at 122.01-121.40 (waiting for confirmation is still recommended here).
Due to today’s U.S. building permits release at 1.30pm GMT along with the Fed set to take the limelight at 7pm GMT, we would highly recommend only trading the above areas during times when news will not likely affect the technical outlook.
Levels to watch/ live orders:
- Buys: 121.30 [Tentative – confirmation required] (Stop loss: dependent on where one confirms this level).
- Sells:121.86 [Tentative – confirmation required] (Stop loss: dependent on where one confirms this level). 122.22-122.42 [Tentative – confirmation required] (Stop loss: dependent on where one confirms this area).
USD/CAD:
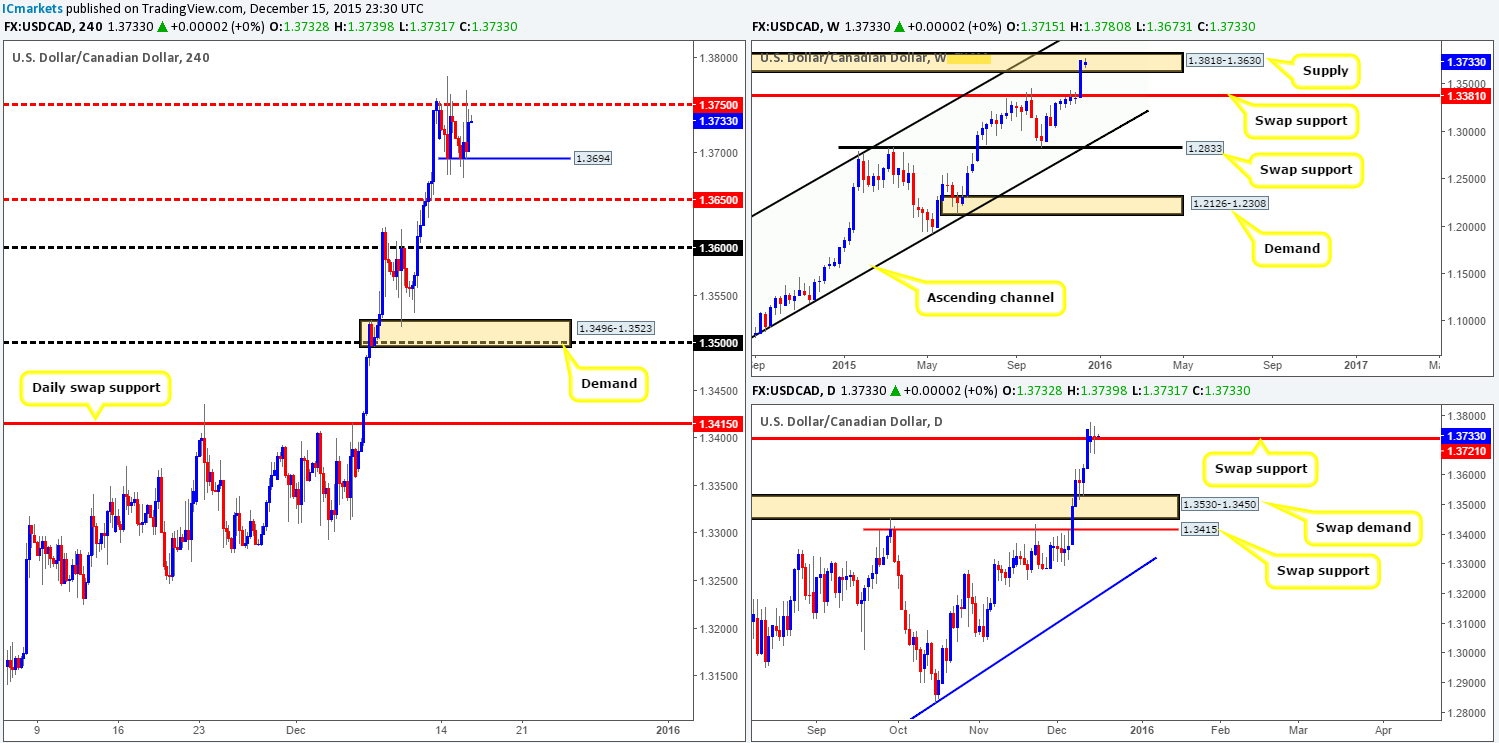
Due to yesterday’s trade remaining confined between the H4 mid-level resistance 1.3750 and H4 support drawn from 1.3694, much of the following analysis will be similar to the previous…
Starting with the weekly chart this morning, price is currently showing little response from supply at 1.3818-1.3630. Daily action on the other hand saw the market print its second-consecutive indecision candle on top of a swap support coming in at 1.3721. In the event that the buyers are able to keep this pair above here this week, the next upside target to be aware of falls in at supply drawn from 1.4001-1.3904.
Seeing as how this pair is trending extremely strong at the moment, and the fact that price is currently holding above a daily swap (support) barrier (see above), we feel the only logical path for this pair is north! Granted, we cannot ignore that weekly trade is loitering within supply (see above), but one cannot deny that this weekly area has its work cut out for it if it is to halt this current buying frenzy which will likely be strengthened should the Fed step in a raise rates later on today.
That being the case, our team will be looking for 1.3750 to be taken out and retested as support today. This, in turn, will effectively be our cue to begin hunting for lower timeframe buy setups into this market. Should the above come to fruition, psychological resistance 1.3800 is the next obvious target.
Levels to watch/ live orders:
- Buys: Watch for offers to be consumed around 1.3750 and then look to trade any retest seen at this level (confirmation required).
- Sells: Flat (Stop loss: N/A).
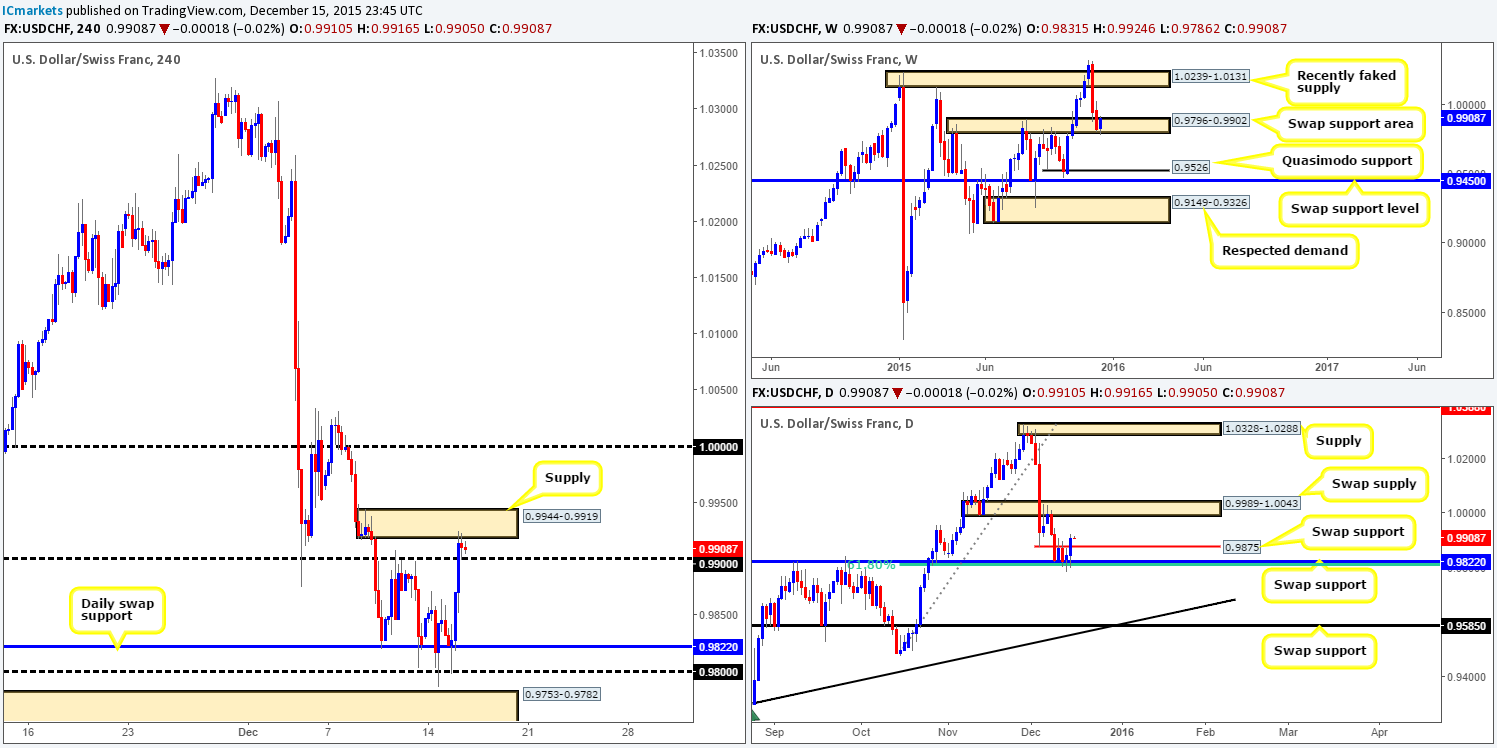
USD/CHF: (Live trade update: 75% of our position was already cashed in [see previous report], with price coming down to take us out at breakeven (0.97980) yesterday, before rallying north – what a bummer).
Kicking off our analysis with a look at the weekly chart shows that following the whipsaw below the swap support area at 0.9796-0.9902, the USD/CHF has begun to appreciate in value. The next upside target on this timeframe to be aware of falls in at a recently faked supply drawn from 1.0239-1.0131. Turning over to the daily chart, however, we can see that the swap resistance level at 0.9875 has been consumed, which should technically now hold as support. Should this come to pass, price appears relatively free to rally up to a swap supply base coming in at 0.9989-1.0043.
As we move into the pits of the H4 timeframe, nevertheless, the picture being drawn is slightly different. The recent surge in buying smashed through psychological resistance 0.9900 to cross swords with supply coming in at 0.9944-0.9919. In order for us to become buyers in this market, we’d need to see this supply consumed and retested (with lower timeframe confirmation) as demand, which should effectively clear the path up to at least parity on this timeframe.
Barring the current H4 supply, the technical picture, at least to us, appears bullish right now. For all that though, traders may want to note that on the fundamental side today, we have theU.S. building permits release at 1.30pm GMT along with the Fed set to take center stage at 7pm GMT. Therefore, trade cautiously today guys!
Levels to watch/ live orders:
- Buys: Watch for offers at 0.9944-0.9919 to be consumed and then look to trade any retest seen thereafter (confirmation required).
- Sells: Flat (Stop loss: N/A).
DOW 30
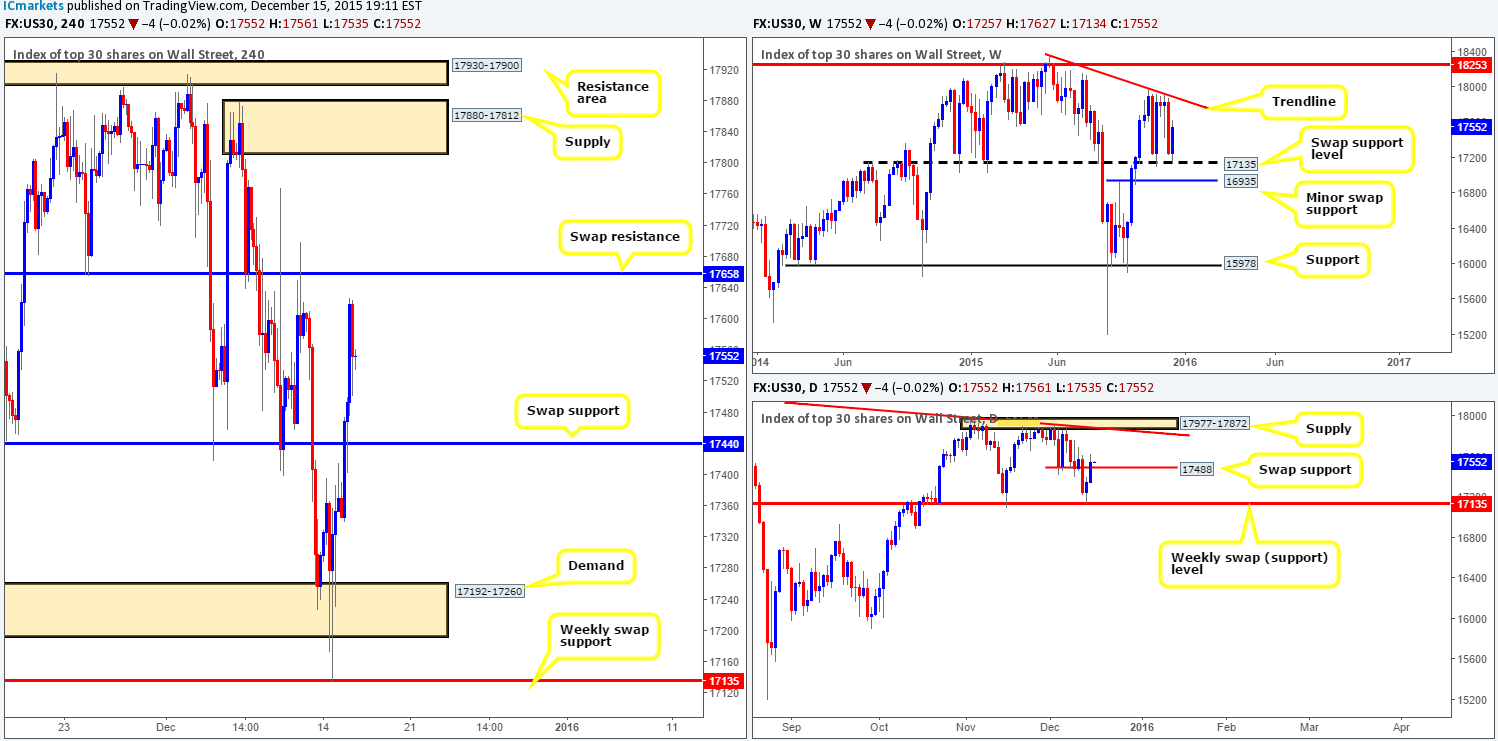
The bounce from the weekly swap (support) level at 17135 continues to advance in the direction of the weekly trendline resistance taken from the high 18365. On the other side of the ledger, this recent buying forced daily action to close above a swap resistance (now support) barrier coming in at 17488. Assuming that the bulls are able to hold ground here, there appears little active supply to the left to stop the DOW rallying up to at least supply drawn from 17977-17872 (converges nicely with the above said weekly trendline).
By contrast, the H4 timeframe shows active offers coming into the market from the 17620 mark, just below a swap resistance level at 17658. In the event that this selling continues, there’s little supportive structure stopping price from hitting the swap support seen at 17440. However, given the position of price on the higher timeframe picture (see above), we have absolutely no intention in selling. In fact, what we’re actually looking for is a close above the aforementioned swap resistance level, since above here looks clear for this index to rally up to supply visible at 17880-17812 (glued to the underside of the daily supply area mentioned above at 17977-17872).
Providing that we see a close higher today, our team will then begin watching for price to retest this level as support and then look to enter long alongside a lower timeframe buy signal. One thing to keep in mind here though traders is the Fed is set to raise interest rates later on today, likely causing volatility in this market. Therefore, during this time no technical setup, at least for us, will be traded.
Levels to watch/ live orders:
- Buys: Watch for offers at 17658 to be consumed and then look to trade any retest seen thereafter (confirmation required).
- Sells: Flat (Stop loss: N/A).
XAU/USD: (Gold)
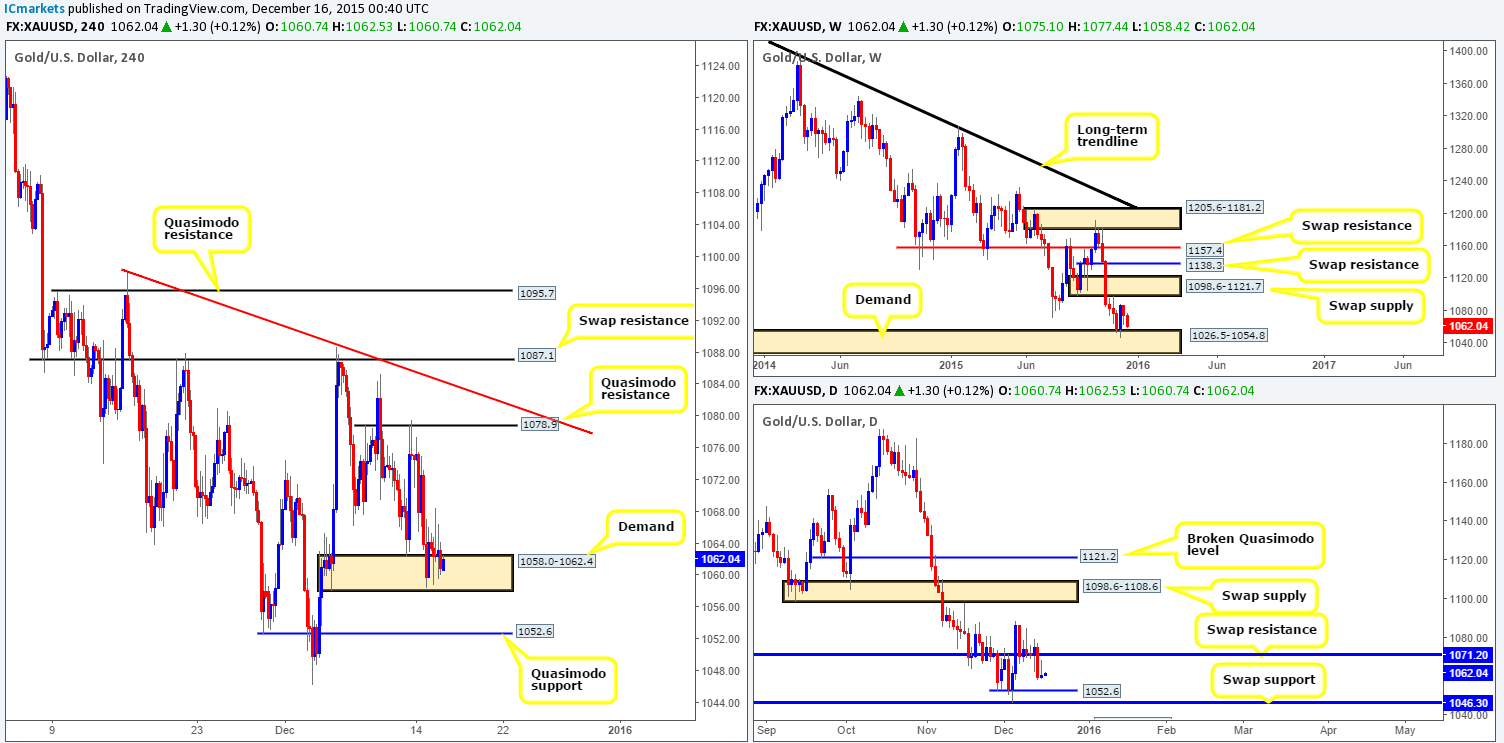
Following the rather precipitous fall from the underside of a H4 Quasimodo resistance at 1078.9 into H4 demand at 1058.0-1062.4, the yellow metal has entered into a phase of choppy consolidation. Given this, let’s see how the land lies on the higher timeframe picture… Up on the weekly chart, we can see that market participants continue to hover just above demand visible at 1026.5-1054.8. Meanwhile, daily action shows that price recently broke below a swap support (now resistance) level at 1071.2, and appears free to test Quasimodo support seen at 1052.6, followed by a swap support level at 1046.3.
In light of the above points and the fact that the Fed is set to likely raise interest rates later on, we feel Gold will likely take out the remaining bids left within the current H4 demand and head lower. Initially, we did highlight that we’d be interested in entering long (with confirmation) from the H4 Quasimodo support level at 1052.6 and also the daily swap (support) barrier at 1046.3. For all that though, we’re a little hesitant today as Gold is negatively correlated to the U.S. dollar, which if rates are indeed increased will likely see Gold plummet lower. Therefore, given that there is little room technically for this market to be sold, and buying with the Fed shenanigans just around the corner, remaining flat until more conducive price action presents itself is the route we’ve chosen to take.
Levels to watch/ live orders:
- Buys: Flat (Stop loss: N/A).
- Sells: Flat (Stop loss: N/A).


