
EUR/USD:
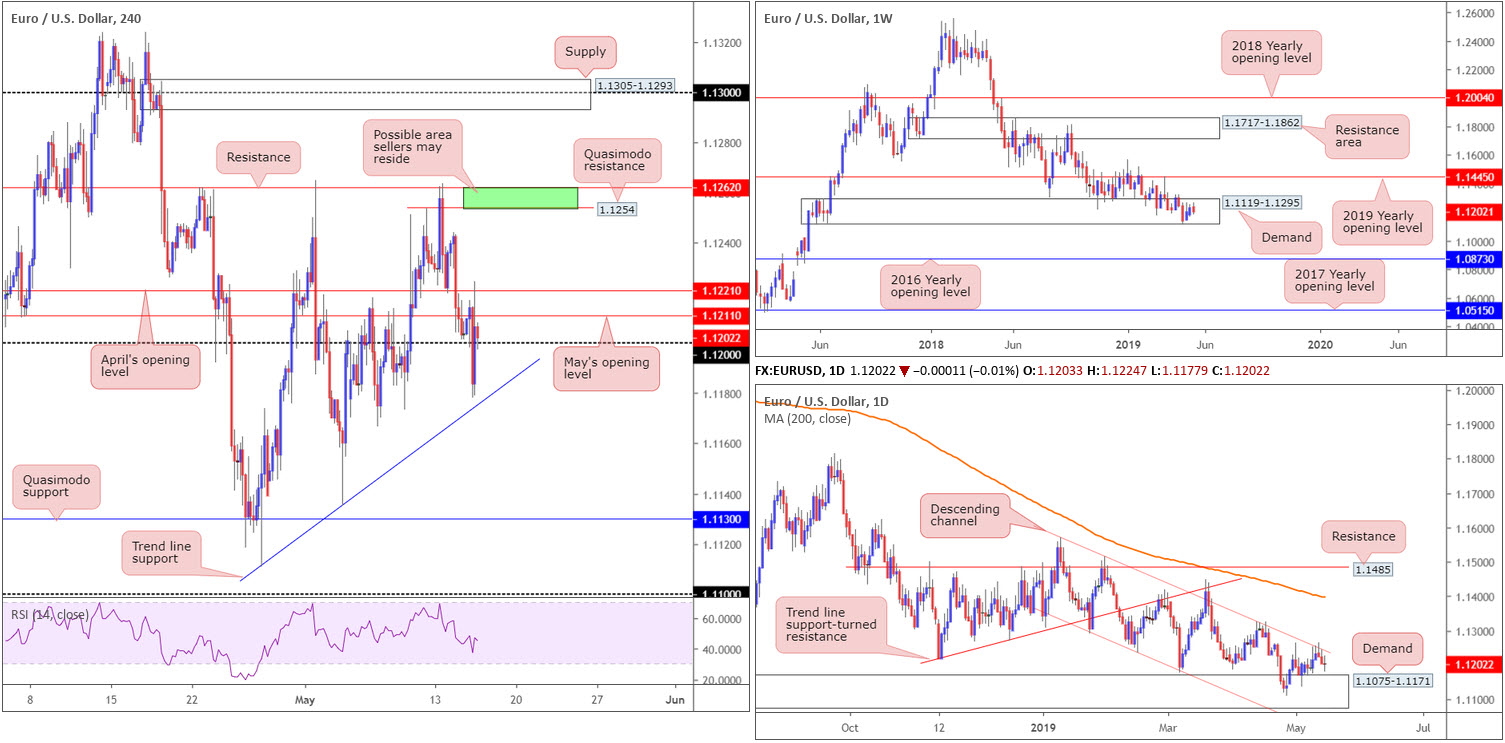
The US dollar, according to the US dollar index, largely disregarded the weaker-than-expected April retail sales report Wednesday, though eventually yielded to selling pressure on news US President Trump would delay tariffs on EU automobiles. This delivered the euro fresh impetus against its dollar counterpart, lifting the unit beyond 1.12 to a high of 1.1224, before rotating lower and retesting 1.12 as support. April and May’s opening levels at 1.1221 and 1.1211 are key resistances in play right now on the H4 timeframe. Beneath 1.12, the next port of call can be seen at a trend line support etched from the low 1.1110.
Focus on the weekly timeframe remains within the walls of a long-standing demand zone at 1.1119-1.1295, perhaps absorbing sellers from the daily channel resistance stretched from the high 1.1569. Interestingly, the next downside target on the daily timeframe falls in at demand drawn from 1.1075-1.1171, glued to the underside of the current weekly demand base.
Areas of consideration:
A point of interest on the H4 timeframe resides between resistance at 1.1262 and a Quasimodo resistance at 1.1254 (green). The combination of these two levels, the overall trend pointing in a southerly bearing and the nearby daily channel resistance highlighted above, is likely sufficient confluence to entice seller interest. To avoid falling victim to a fakeout, as 1.1262/1.1254 offers a narrow range, traders may opt to wait for additional confirmation to form prior to pulling the trigger. Entry and risk parameters can then be determined according to the selected confirmation technique.
Technically, the research team is not as enthusiastic about the current H4 trend line support. This is due to the fact price failed to produce a higher high (peak) following its previous bounce.
Today’s data points: German Buba President Weidmann Speaks; US Building Permits; Philly Fed Manufacturing Index; FOMC Member Brainard Speaks.
GBP/USD:
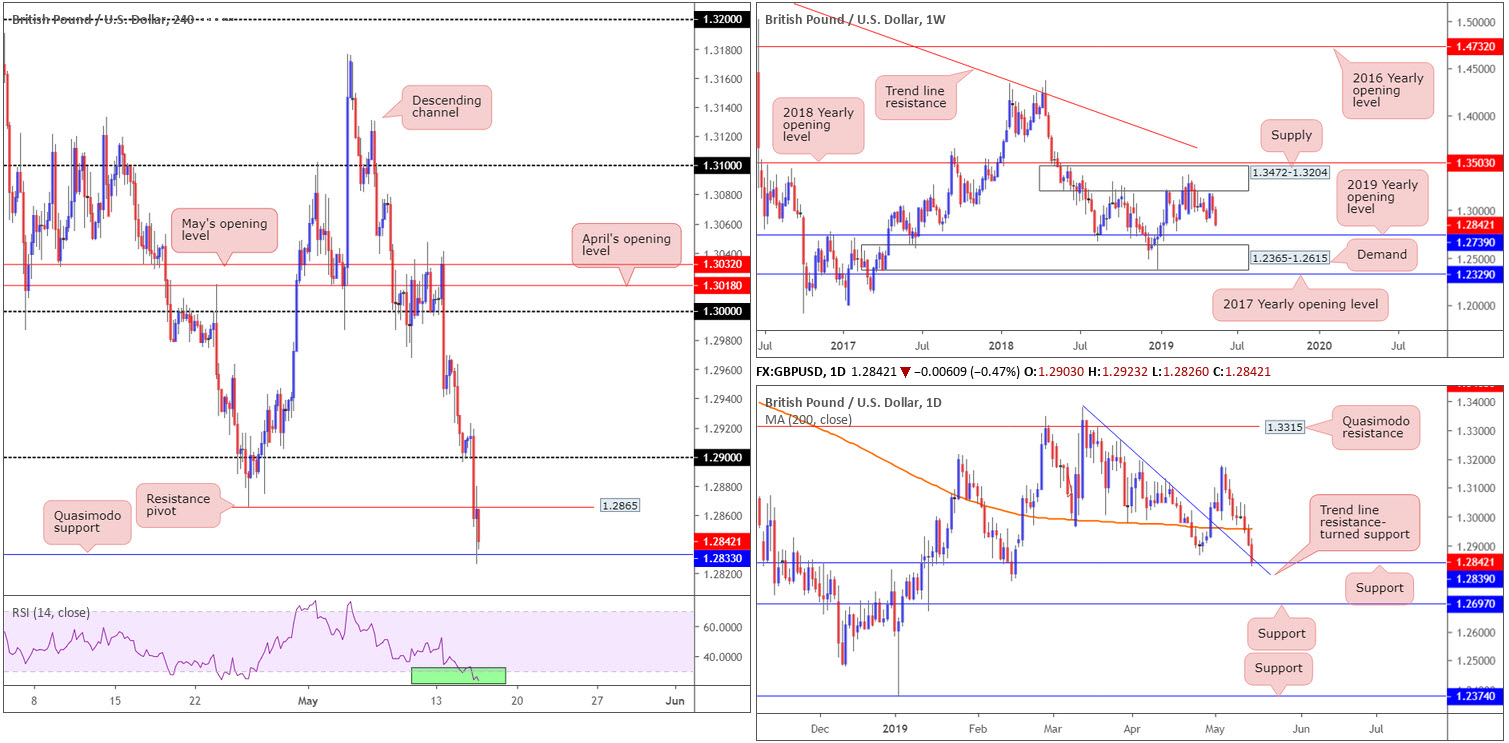
A clear G10 laggard, the pound was undermined by a broad downturn in sentiment and the on-going Brexit impasse between the Tory and Labour Parties Wednesday. Losing grip of the 1.29 handle on the H4 timeframe, the technical picture has the GBP/USD nursing losses off a Quasimodo support drawn from February 12 at 1.2833.
Although a H4 pivot resistance at 1.2865 is capping upside right now, traders are urged to pencil in the additional confluence bolstering the current Quasimodo support. Daily movement, thanks to yesterday’s slide, is also shaking hands with support coming in at 1.2839 and a merging trend line resistance-turned support extended from the high 1.3380. This – coupled with the H4 RSI indicator testing oversold terrain – may be enough to offer sterling some much-needed respite today.
The only caveat to entering long from 1.2833 can be found on the weekly timeframe. Price action, as you can see, exhibits scope to explore lower ground, with a possible downside target residing around the 2019 yearly opening level at 1.2739.
Areas of consideration:
Although weekly flow suggests further losses may be upon us, a reasonably sizeable bounce from the H4 Quasimodo support at 1.2833 could still be in store. Aggressive traders may look at the lower head of the Quasimodo formation seen at 1.2772 (quite a stop distance), whereas conservative traders might feel waiting for a H4 bullish candlestick signal to form (entry and risk parameters can be defined according to this structure) may be the better path to take.
Irrespective of which entry technique is employed, a H4 close above 1.2865 would be an ideal trigger to reduce risk to breakeven, with the expectation then of a follow-through move to at least 1.29.
Today’s data points: MPC Member Haskel Speaks; US Building Permits; Philly Fed Manufacturing Index; FOMC Member Brainard Speaks.
AUD/USD:
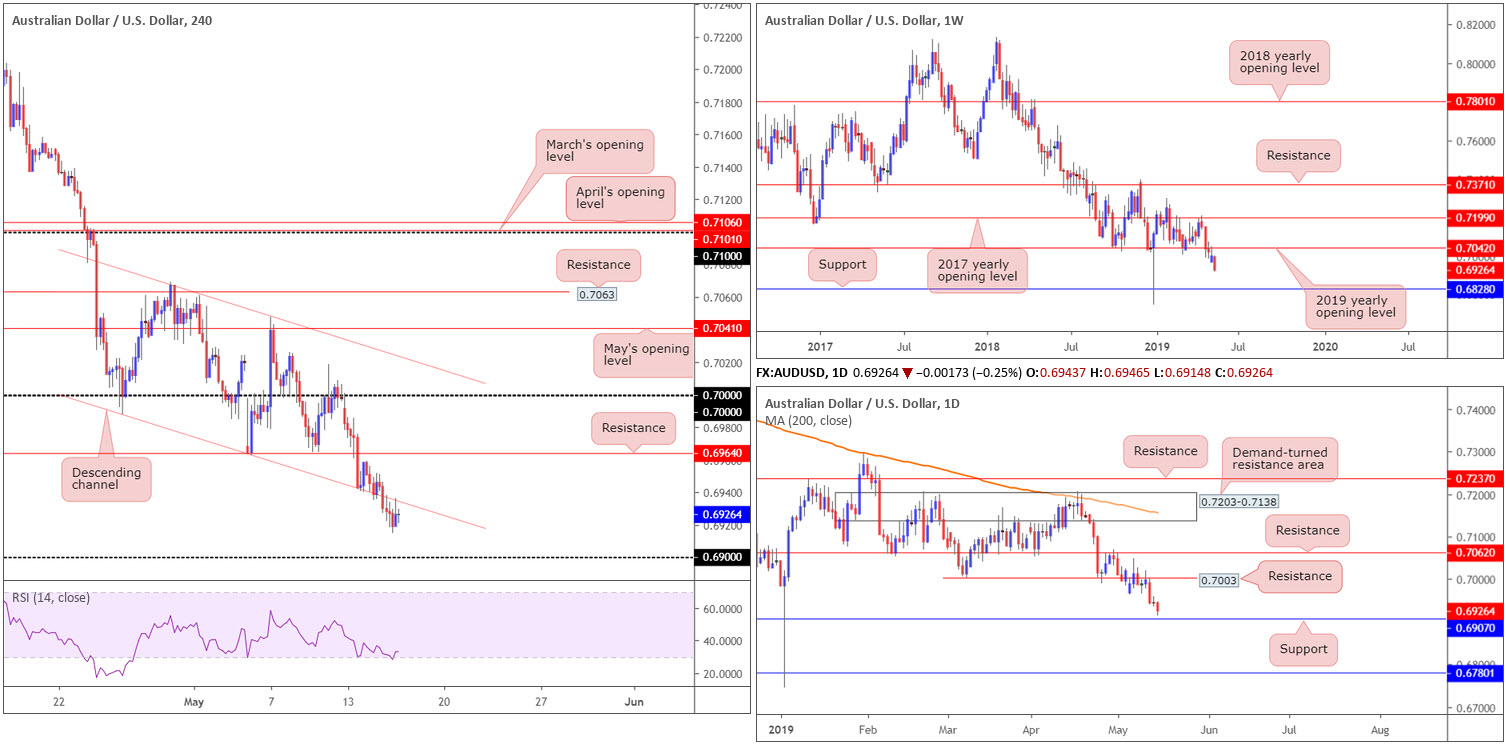
Early hours Wednesday witnessed the Australian dollar sink lower vs. the US dollar, weighed on by weaker-than-forecast data out of Australia and China. Technically speaking this threw the H4 candles beneath its channel support extended from the low 0.6988.
USD selling pressure on news US President Trump would delay tariffs on EU automobiles, provided fresh juice to the AUD/USD market going into US hours, consequently forcing a revisit to the underside of the recently broken channel support level, which, as evident from the chart, held firm as resistance and could potentially set the stage for a run towards 0.69.
As highlighted in Wednesday’s outlook, the research team notes additional moves to the downside are likely upon us, according to the higher-timeframe charts. Distancing itself further from the underside of its 2019 yearly opening level at 0.7042 on the weekly timeframe, the pair is seen starved of support until shaking hands with 0.6828. While daily price also shows scope to press lower, neighbouring support falls in at 0.6907, situated a few points above the round number 0.69 on the H4 timeframe.
Areas of consideration:
On account of the technical picture, a short term selling opportunity from the underside of the H4 channel support-turned resistance is certainly a consideration today. However, before pressing the sell button, traders are encouraged to weigh up risk/reward. Ideally you want more than a 1:1 ratio to daily support at 0.6907. Do recall, though, we could eventually push as far south as weekly support priced in at 0.6828.
Today’s data points: Australian Employment Change; Australian Unemployment Rate; RBA Assist Gov. Bullock Speaks; US Building Permits; Philly Fed Manufacturing Index; FOMC Member Brainard Speaks.
USD/JPY:
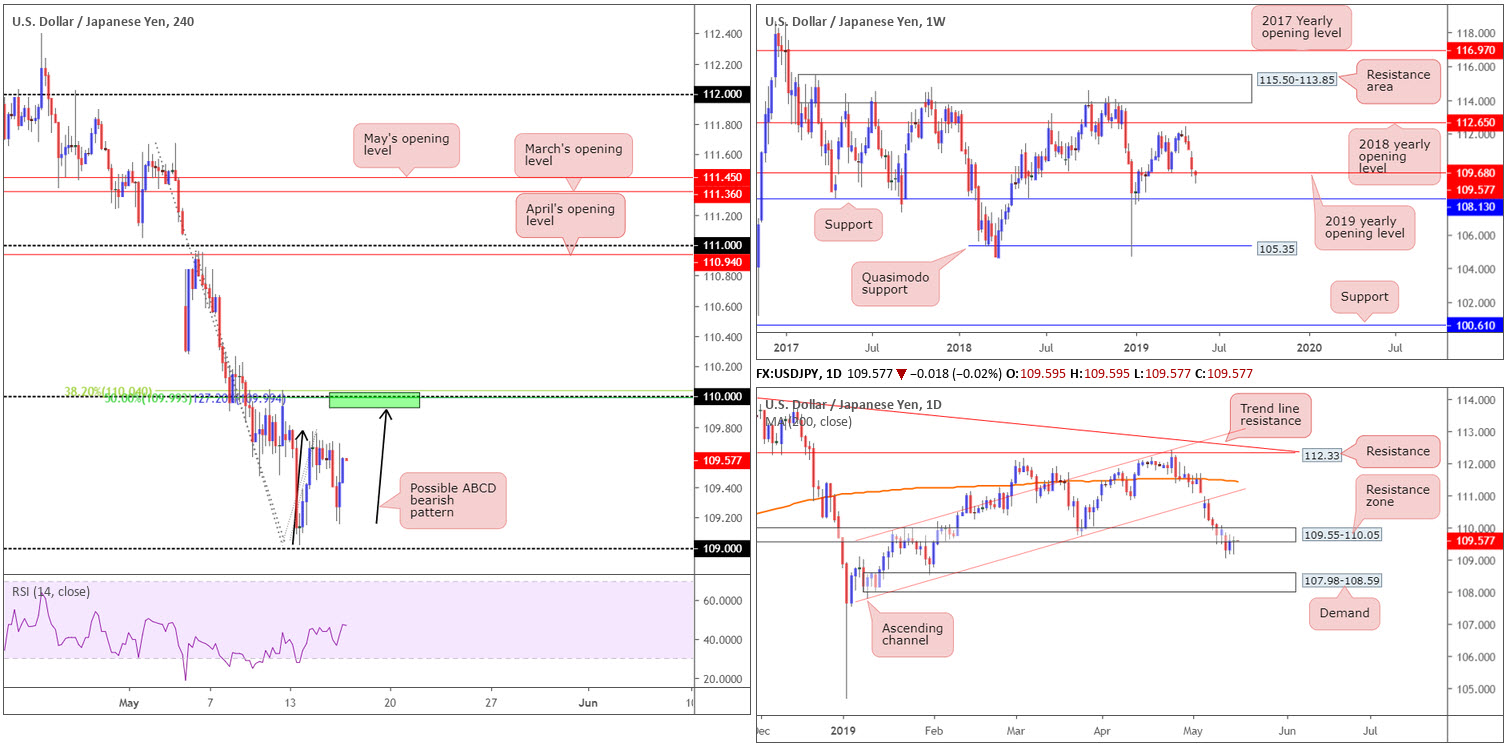
Several news outlets reported US President Trump is planning to delay tariffs on EU automobiles Wednesday, which was welcomed across equity markets. Investors dumped the safe-haven Japanese yen, reinforcing a reasonably strong bid tone in USD/JPY.
Heading into Asia Pac trading, the technical landscape on the H4 timeframe is clear in terms of resistance. The 110 handle, a resistance by and of itself, is sandwiched closely together with a 38.2% Fibonacci retracement at 110.04, a 50.0% retracement at 109.99 and a Fibonacci extension point also at 109.99. Note the 127.2% Fibonacci line brings with it a potential ABCD (black arrows) bearish formation at 109.93. Therefore, H4 structure has firm resistance in sight this morning between 110.04/109.93 (green).
Supporting the 110 handle on the daily timeframe is a resistance area plotted at 109.55-110.05. Note 110 is seen in within the upper limit of this area, however. Also located close by is the 2019 yearly opening level at 109.68.
Areas of consideration:
In light of our technical studies, the 110 handle is in focus today as possible resistance. While it is ultimately down to the individual trader, waiting for additional confirmation to form at 110 is encouraged before pulling the trigger, due to round numbers being prone to whipsaws (fakeouts).
In terms of take-profit targets, at this point there’s not much to be garnered from the chart structurally without seeing the approach. Nevertheless, traditional take-profit targets from ABCD patterns are taken at the 38.2% and 61.8% Fibonacci retracements of legs A-D.
Today’s data points: US Building Permits; Philly Fed Manufacturing Index; FOMC Member Brainard Speaks.
USD/CAD:
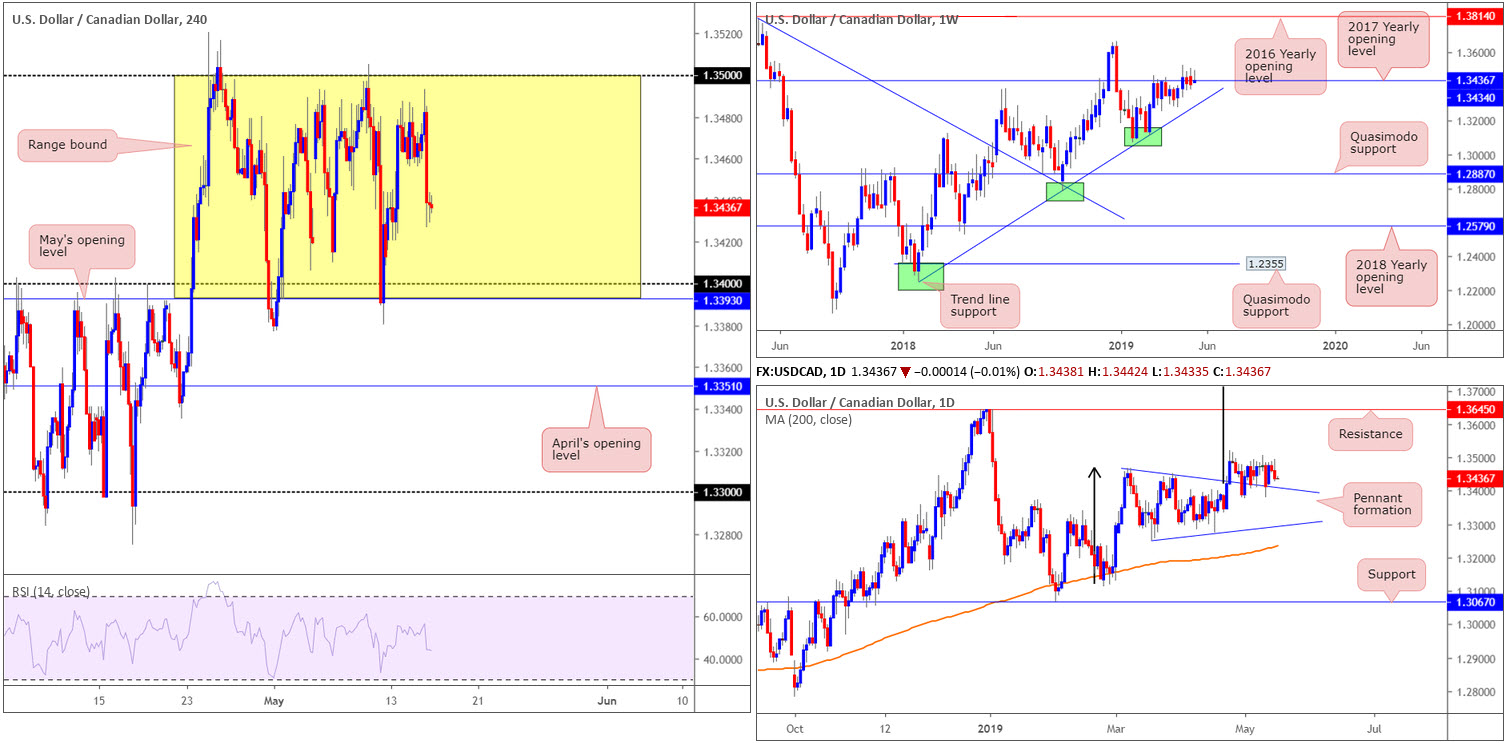
In recent sessions, the USD/CAD made a run for 1.35, though fell short at a weekly high of 1.3493 in early US trade and turned lower.
On the data front, Canadian CPI rose 0.4% in April, in line with expectations, and the year-on-year rate accelerated to 2.0%, also in line with expectations. Out of the US we also had weaker-than-expected April retail sales. Both reports, according to the charts, were largely disregarded, though the market eventually yielded to selling pressure on news US President Trump would delay tariffs on EU automobiles.
Technically speaking, the H4 candles remain within a 100-point+ range between May’s opening level at 1.3393 and the round number 1.35. Analysis of price action on the daily timeframe shows the unit continues to feed off support drawn from the top edge of a pennant pattern (1.3467). Although the traditional price target (calculated by taking the distance from the beginning of the preceding move and adding it to the breakout price) remains on the chart at 1.3768 (black arrows), the next upside target from a structural standpoint falls in around resistance at 1.3645.
Weekly activity, on the other hand, is chalking up an indecisive tone around its 2017 yearly opening level at 1.3434. Areas outside of this level to be aware of fall in around the 2018 yearly high of 1.3664, and a trend line support etched from the low 1.2247.
Areas of consideration:
The 1.34/May’s opening level at 1.3393 zone is an area of interest today for possible longs. Not only does this base represent the lower edge of the current H4 range, it is also further reinforced by the top edge of the daily pennant formation highlighted above. For conservative traders, waiting for a H4 bullish candlestick to print from this region helps identify buyer intent and also serves as a structure for entry and risk levels to work with.
In the event we fail to reach 1.34 and turn higher, nonetheless, the market may observe a H4 close form above 1.35. Should this occur, traders have the choice of either buying the breakout candle and placing stop-loss orders beneath its tail, or waiting and seeing if a retest scenario takes shape and entering on the back of the rejection candle’s structure. The next upside target on the H4 scale can be seen around 1.3570, though according to the higher timeframes we could be heading much higher.
Today’s data points: US Building Permits; Philly Fed Manufacturing Index; FOMC Member Brainard Speaks; Canadian Manufacturing Sales m/m; BoC Gov. Poloz Speaks.
USD/CHF:
Outlook unchanged.
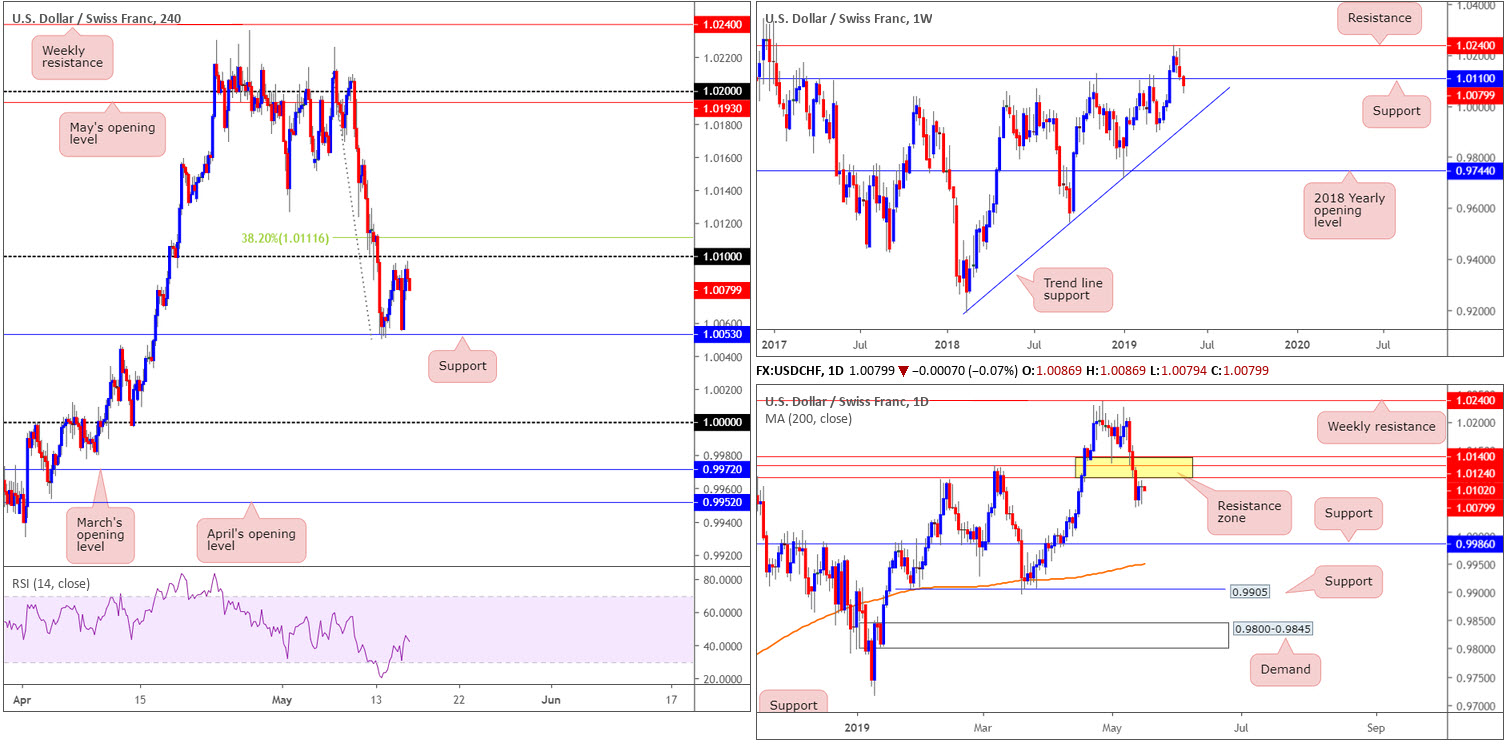
Despite ranging more than 40 points, USD/CHF prices concluded Wednesday’s segment unchanged. As a result of this, a large portion of the following analysis will echo aspects of yesterday’s outlook.
With downside attempts limited by H4 support priced in at 1.0053, the pair appears poised to approach the underside of 1.01, shadowed closely by a 38.2% Fibonacci resistance at 1.0111. What’s also notable from a technical perspective here is the nearby daily resistance zone (yellow) at 1.0102/1.0140, as well as the underside of a weekly support-turned potential resistance at 1.0110.
Areas of consideration:
Today’s focus remains drawn towards the 1.01 level on the H4 timeframe for shorting opportunities. Conservative stop-loss placement, according to our technical studies, is above the top edge of the daily resistance area at 1.0140.
Aggressive traders, nonetheless, may look to decrease risk size by opting to use the weekly support-turned potential resistance at 1.0110 as a platform to position stops. The initial downside target can be seen at H4 support mentioned above at 1.0053, followed by parity (1.0000).
Today’s data points: US Building Permits; Philly Fed Manufacturing Index; FOMC Member Brainard Speaks.
Dow Jones Industrial Average (DOW 30):
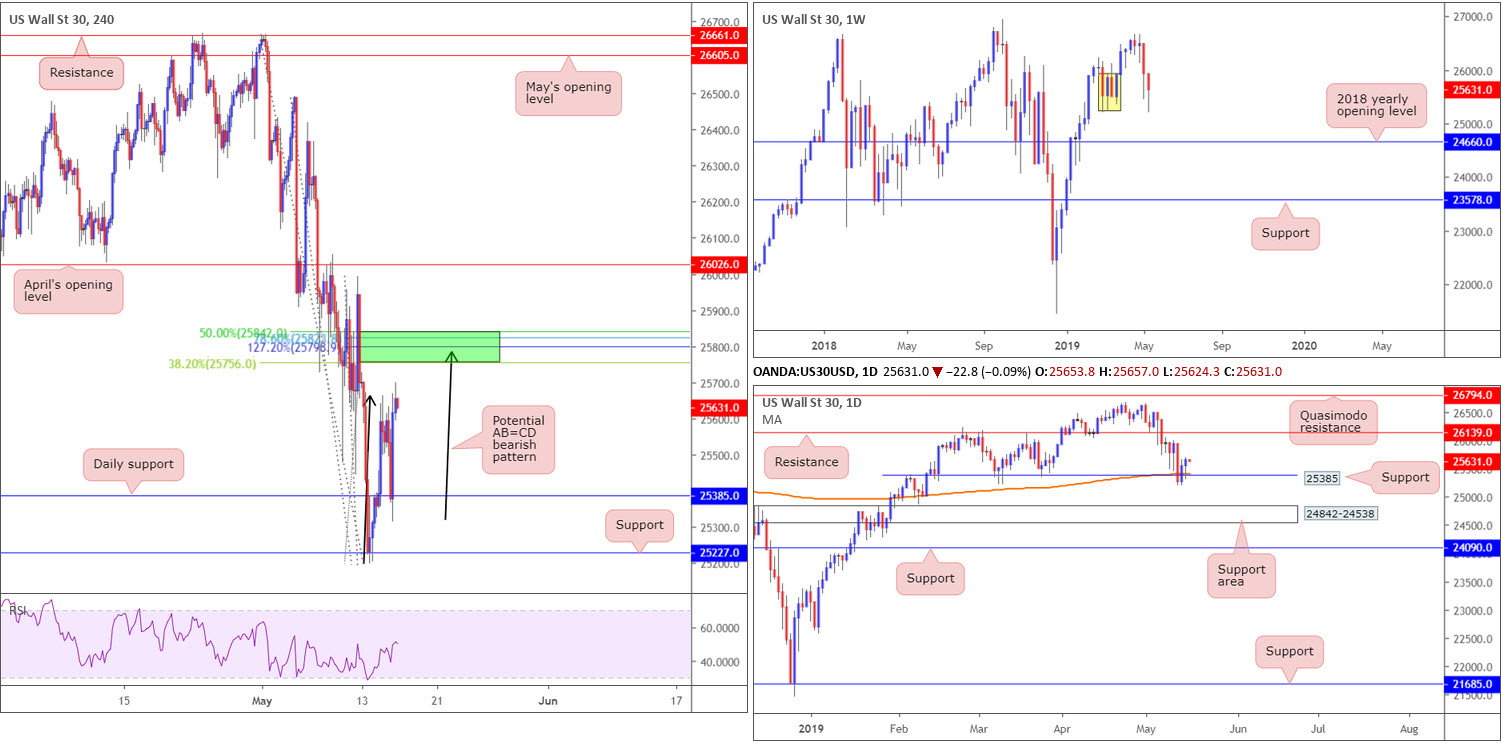
US stocks climbed higher Wednesday, advancing for a second consecutive session amid hopes of thawing trade concerns. Earlier in the day, the Dow Jones Industrial Average erased intraday losses after Treasury Secretary Mnuchin stated US negotiators are likely to travel to China soon.
Traders who read Wednesday’s morning brief may recall the piece highlighted daily support at 25385 (aligning with the 200-day SMA) as a potential platform to base longs from. As you can see, the H4 candles dipped from a high of 25666 and retested 25385 and held firm. Well done to any of our readers who managed to take advantage of this move.
While both weekly (seen reversing course within minor demand [yellow] at 25217-25927) and daily structure shows promise to the upside (next upside target on the daily timeframe can be seen around 26139), traders are urged to take note of a H4 AB=CD (black arrows) bearish resistance formation at 25842/25756 (green). Not only does this area enclose the AB=CD’s termination point at 25785, the zone houses a number of Fibonacci levels within (a Fibonacci cluster). This is similar to the USD/JPY’s H4 chart, which are strongly correlated markets.
Areas of consideration:
Traders currently long this market off the daily support level highlighted above at 25385 are encouraged to consider taking partial profits (or at least reducing risk to breakeven) around the H4 resistance area at 25842/25756. A clearance of this zone has April’s opening level to target at 26026, an ideal second take-profit zone.
Today’s data points: US Building Permits; Philly Fed Manufacturing Index; FOMC Member Brainard Speaks.
XAU/USD (GOLD):
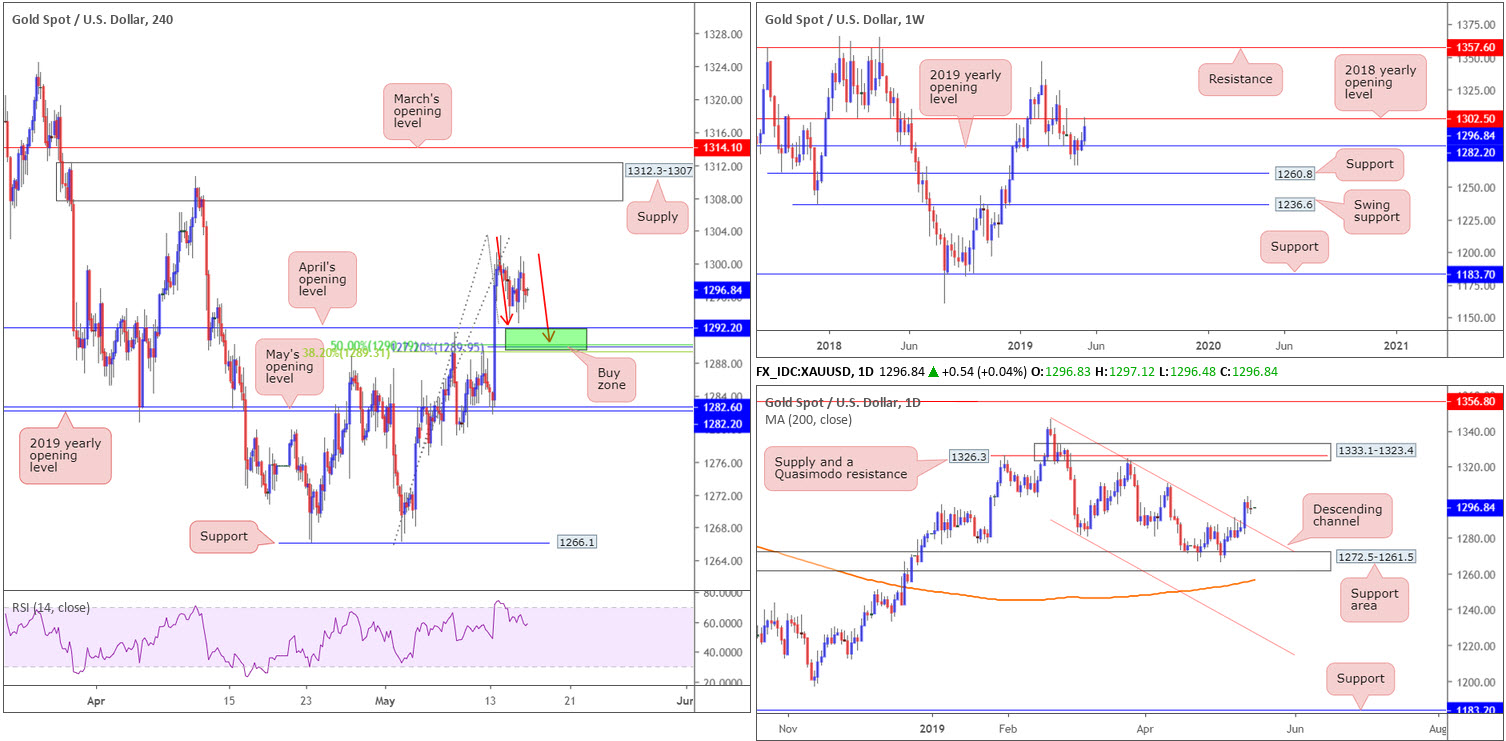
Gold prices are little changed this morning, consequently forming a daily indecision candle yesterday (albeit with a slight bearish twang to it).
As underscored as a possibility in previous analysis, the 2018 yearly opening level at 1302.5 on the weekly timeframe is now serving as resistance. Further pressure to the downside from here may eventually call for a test of the 2019 yearly opening level plotted at 1282.2.
Contrary to the weekly timeframe’s position, though, the daily candles exhibit scope to explore higher ground, targeting the 1310.6 April 10 high, followed by a supply zone at 1333.1-1323.4. Before reaching the said areas, pencilling in the possibility of a retest of channel resistance-turned support (extended from the high 1346.7) may be an idea.
Across on the H4 timeframe, price action is poised to retest April’s opening level at 1292.2 as support, perhaps by way of a 127.2% ABCD approach (red arrows) that terminates at 1289.9. Also reinforcing the said barrier is a 38.2% Fibonacci support value at 1289.3 and a 50.0% support at 1290.1 (green zone). The runway north from here, aside from Tuesday’s high 1303.4, leads to a supply zone coming in at 1312.3-1307.7.
Areas of consideration:
As both daily and H4 timeframes exhibit scope to press higher, a retest of 1289.3/1292.2 as support on the H4 timeframe remains of interest. However, seeing as we’re also trading from weekly resistance, waiting for additional confirmation to materialise before pulling the trigger is certainly something to consider. This could be anything from a bullish candlestick reversal signal, an MA crossover or even drilling down to the lower timeframes and entering based on local structure: support and resistance.
Failure to retest 1289.3/1292.2 before turning higher, focus is then drawn towards the H4 supply at 1312.3-1307.7 for shorts, given the close connection the area has to weekly resistance at 1302.5. Conservative stop-loss placement is seen above March’s opening level at 1314.1.
The accuracy, completeness and timeliness of the information contained on this site cannot be guaranteed. IC Markets does not warranty, guarantee or make any representations, or assume any liability with regard to financial results based on the use of the information in the site.
News, views, opinions, recommendations and other information obtained from sources outside of www.icmarkets.com.au, used in this site are believed to be reliable, but we cannot guarantee their accuracy or completeness. All such information is subject to change at any time without notice. IC Markets assumes no responsibility for the content of any linked site. The fact that such links may exist does not indicate approval or endorsement of any material contained on any linked site.
IC Markets is not liable for any harm caused by the transmission, through accessing the services or information on this site, of a computer virus, or other computer code or programming device that might be used to access, delete, damage, disable, disrupt or otherwise impede in any manner, the operation of the site or of any user’s software, hardware, data or property.


