
Key risk events today:
Thursday: Australia Employment Change and Unemployment Rate; China GDP q/y; UK Jobs Data; BoE Credit Conditions Survey; ECB Main Refinancing Rate, Monetary Policy Statement and Press Conference; US Core Retail Sales m/m and Retail Sales m/m; Philly Fed Manufacturing Index; US Unemployment Claims.
(Previous analysis as well as outside sources – italics).
EUR/USD:
EUR/USD peaked heading into US hours Wednesday after the US dollar index regained some composure and recouped a large portion of earlier losses. A mild deterioration in risk sentiment elevated the dollar back to around the 96.00 handle, albeit tentatively.
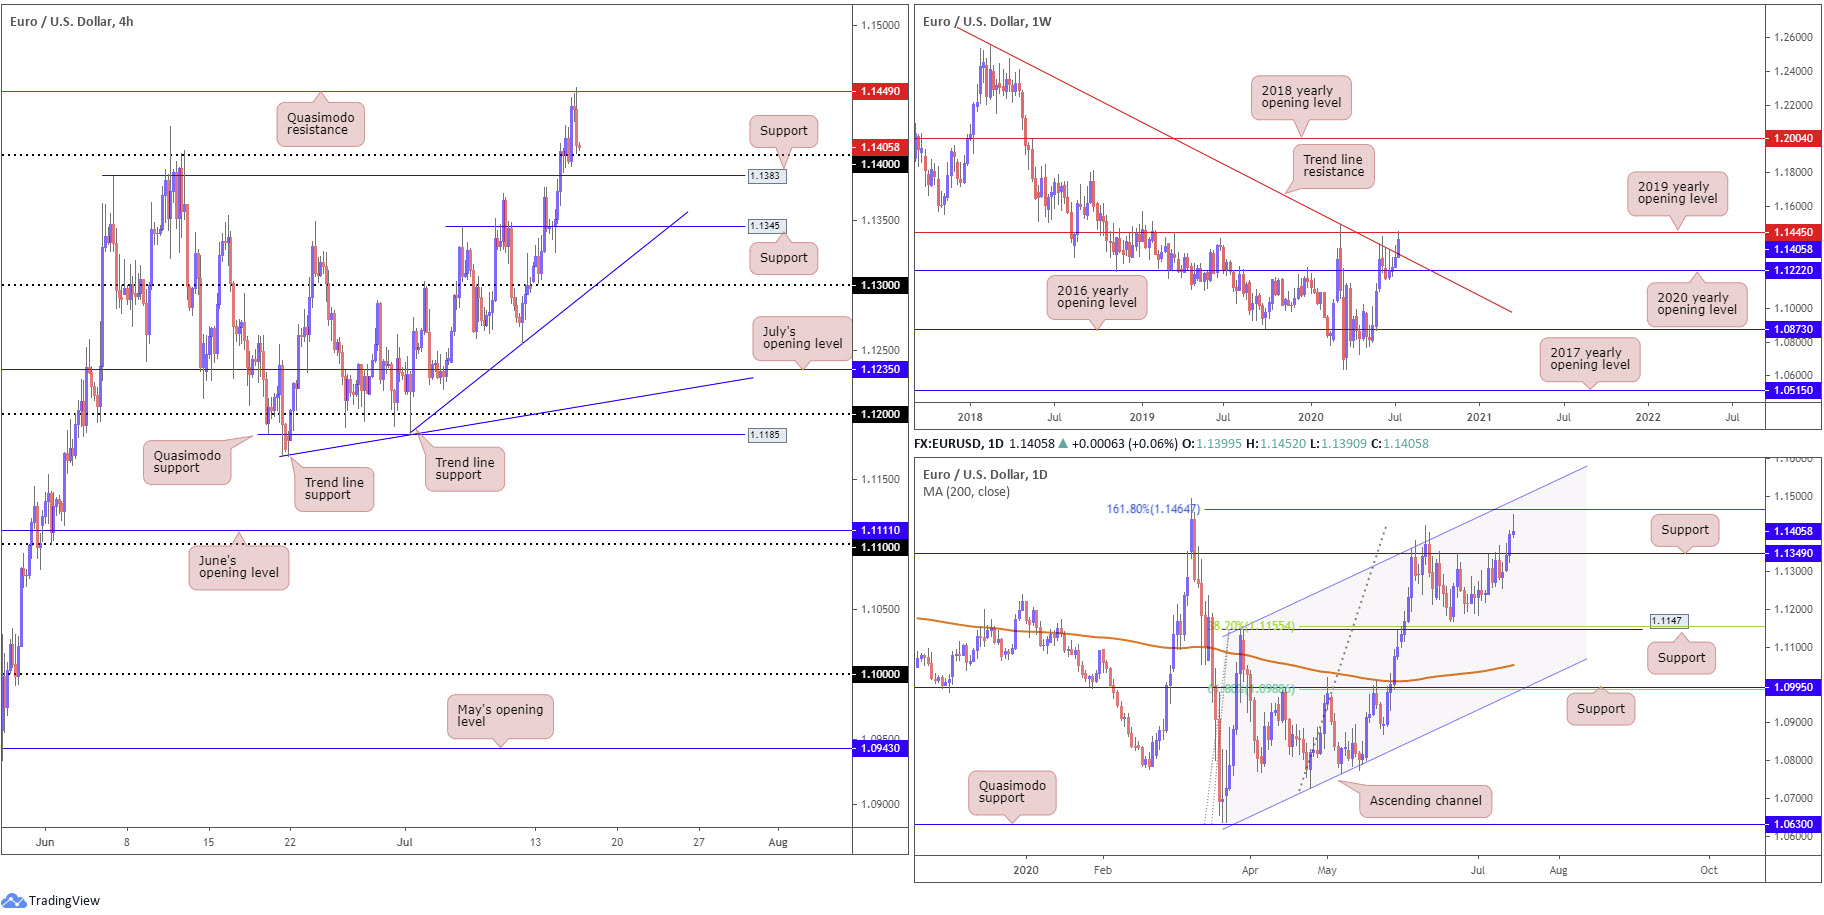
In terms of price action on EUR/USD, traders watched H4 Quasimodo resistance at 1.1449 make an appearance yesterday, following an advance north of the 1.14 handle. The response from 1.1449, as you can see, has had price settle just ahead of 1.14, closely followed by H4 support at 1.1383.
Further afield, we see weekly price recently trekked above long-term trend line resistance, extended from the high 1.2555, and shook hands with the 2019 yearly opening level at 1.1445. With respect to the overall trend, the pair remains southbound until breaking the 1.1495 March 9 high.
A closer reading of price action on the daily timeframe reveals the pair topped ahead of a 161.8% Fibonacci extension point at 1.1464, positioned nearby channel resistance, extended from the high 1.1147. Candlestick enthusiasts will also acknowledge daily flow finished Wednesday in the shape of a shooting star pattern (bearish), with eyes now on 1.1349 support.
Areas of consideration:
For those who read Wednesday’s technical briefing you may recall the following (italics):
The broad bullish tone evident on the weekly and daily timeframes could keep the euro on the winning side of the table around 1.14 on the H4 today. A H4 close north of the latter has 1.1445 on the weekly timeframe (2019 yearly opening level) to target, followed by H4 Quasimodo resistance at 1.1449 and the 161.8% Fibonacci extension point on the daily timeframe at 1.1464.
As evident from the chart this morning, price did indeed make its way above 1.14 and connect not only with H4 Quasimodo resistance at 1.1449, but also weekly resistance at 1.1445 (2019 yearly opening level).
Sellers short weekly resistance now face support at 1.14 on the H4 as well as 1.1383, which may have some traders reduce risk to breakeven. A break of the latter, on the other hand, could unlock the door for additional bearish scenarios today, targeting daily support priced in at 1.1349 and H4 support at 1.1345. Conservative traders will likely find a retest at the underside of 1.14/1.1383 particularly appealing.
GBP/USD:
Similar to EUR/USD, GBP/USD tracked risk sentiment Wednesday, wrapping up off best levels as the buck regained a bullish footing.
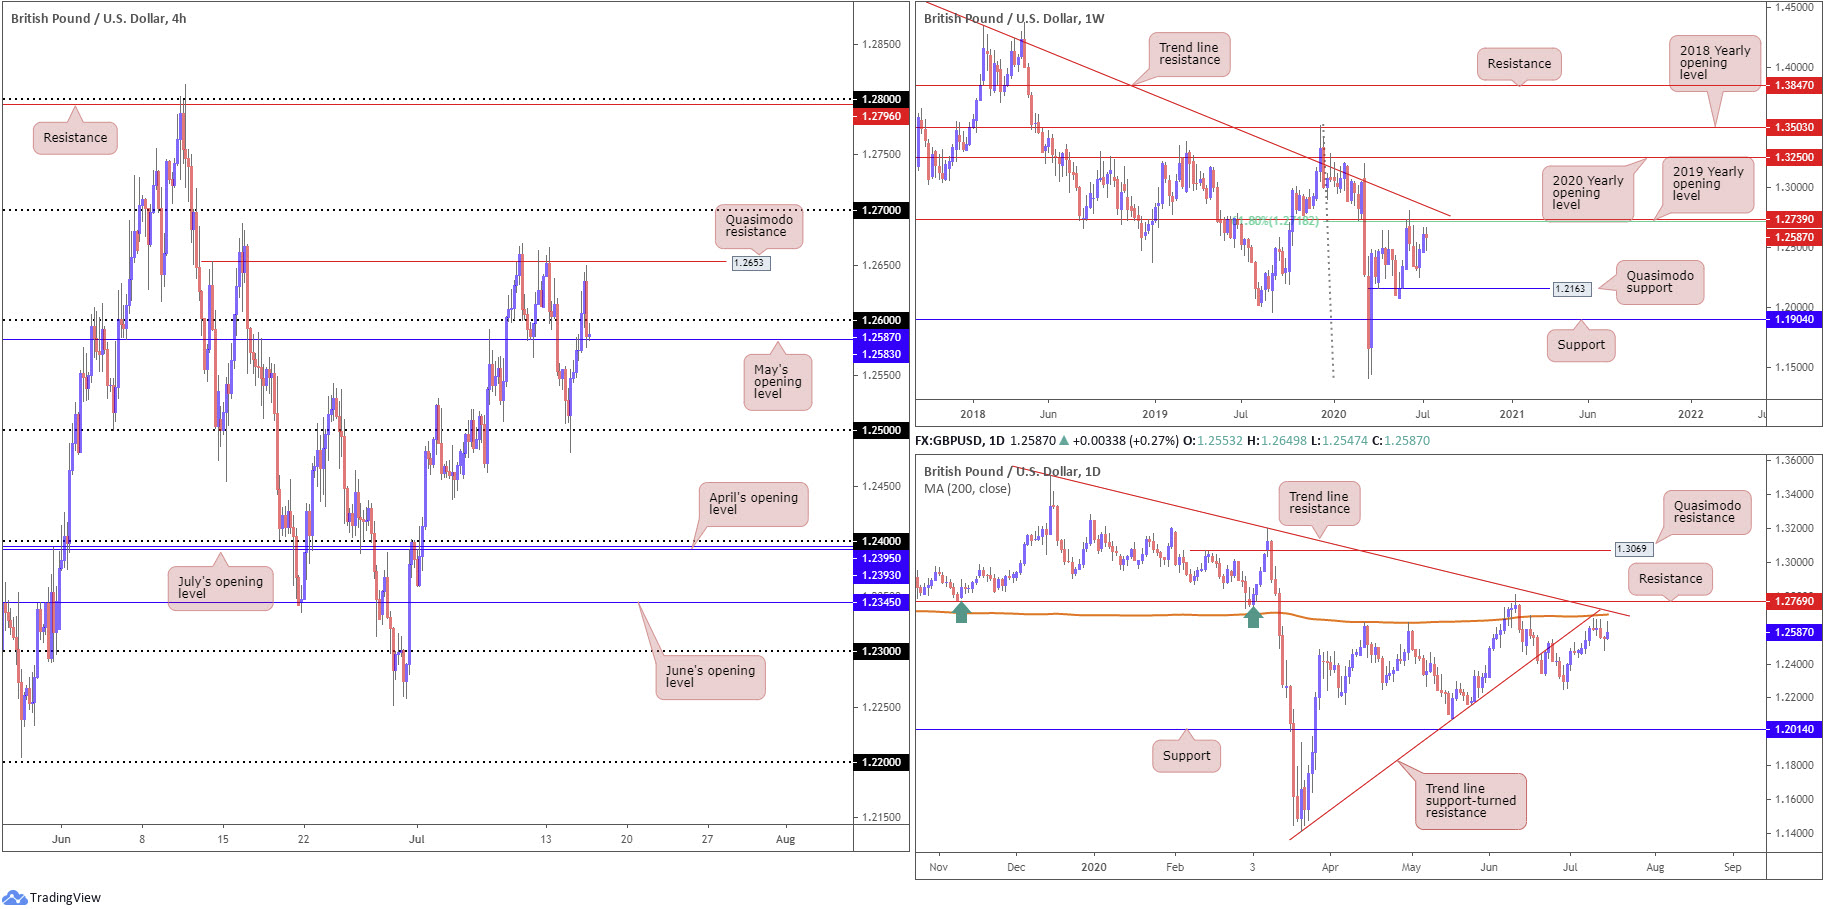
From the weekly timeframe, following two consecutive weeks of gains, we can see the unit has price located within touching distance of considerable resistance, made up of a 61.8% Fibonacci retracement ratio at 1.2718 and the 2019 yearly opening level at 1.2739.
Movement on the daily timeframe, meanwhile, consolidates just south of substantial resistance, made up of trend line support-turned resistance, taken from the low 1.1409, another trend line resistance, extended from the high 1.3514, the 200-day SMA (orange – 1.2692) and resistance at 1.2769. This resistance combination also boasts a connection to the aforementioned weekly resistances. Candlestick traders may also want to acknowledge Tuesday’s hammer pattern (bullish) failed to deliver, with Wednesday chalking up a shooting star pattern (bearish).
Across the page, H4 price is crossing swords with the upper edge of May’s opening level at 1.2583, after peaking a few pips ahead of Quasimodo resistance at 1.2653. Note the round number 1.26 lurks just north of current action. A violation of May’s opening level today throws an intraday bearish tone into the mix, targeting 1.25. Above 1.2653, nevertheless, the 1.27 base is there to contend with.
Areas of consideration:
A H4 close under 1.2583 today may extend yesterday’s pullback and invite sellers into play. A solid retest at the underside of 1.26/1.2583 would be a welcomed sight for conservative traders.
In the event we hold 1.2583 and make progress north of 1.26, buyers will be looking at H4 Quasimodo resistance from 1.2653 as an upside target, followed by 1.27. The latter also remains an interesting point. Not only does the psychological base represent a take-profit target for longs, the round number emphasises robust resistance, joined closely by a collection of daily and weekly resistances (highlighted above).
AUD/USD:
Stalking risk sentiment, AUD/USD bulls came into Wednesday swinging.
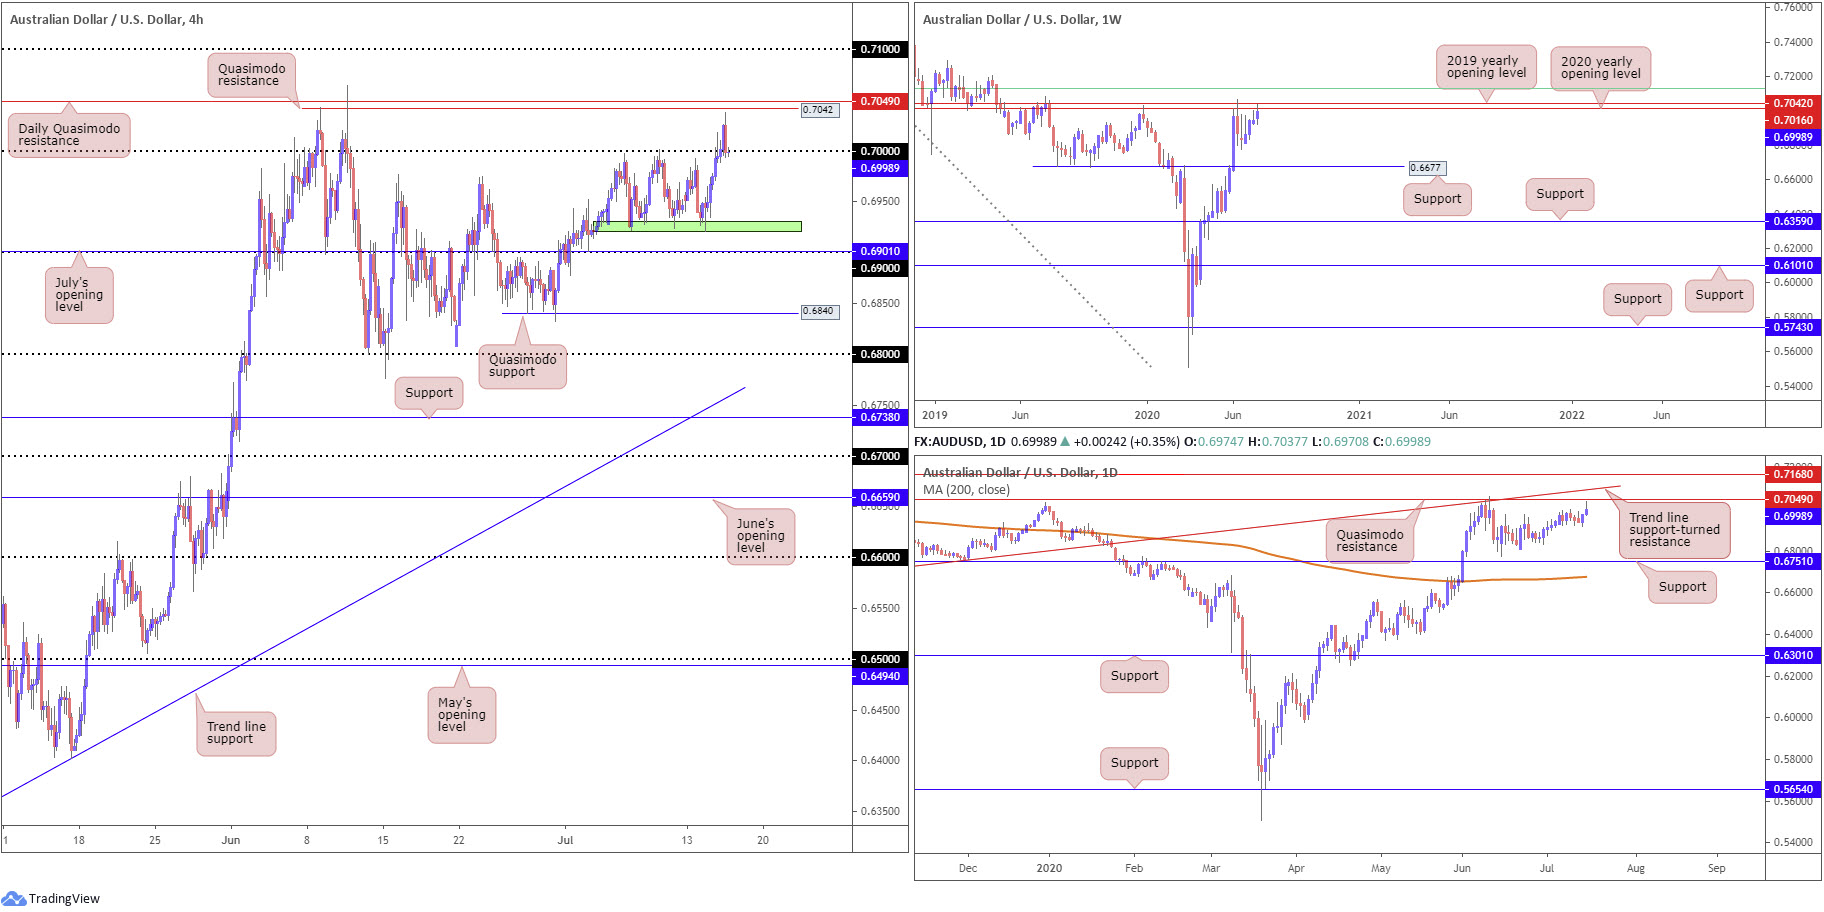
However, after reaching highs at 0.7037, a few pips under H4 Quasimodo resistance at 0.7042, the pair rotated southbound amid risk deterioration and landed back at the key figure 0.70. Letting go of 0.70 today opens up the possibility of a run back to H4 support around 0.6930ish (green), an area that held since early July.
Resistance, forged in the shape of a 2020 yearly opening level and a 2019 yearly opening level, at 0.7016 and 0.7042, respectively, took hold in recent trading. It might also interest some traders to note just above the said resistances we have a 61.8% Fibonacci retracement ratio sited at 0.7128 (green). In terms of support on the weekly timeframe, crosshairs remain fixed on 0.6677.
A closer reading of candle action on the daily timeframe shows price recently tested levels just south of Quasimodo resistance positioned at 0.7049, a level linking with trend line support-turned resistance, taken from the low 0.6670. Another level worth noting is support coming in at 0.6751 and the 200-day SMA (orange – 0.6677).
Areas of consideration:
Having noted weekly resistances (0.7042/0.7016) enter play, the 0.70 figure on the H4 may struggle to produce much of an upside move, despite intraday traders potentially seeking dip-buying strategies off the aforementioned level. This is not to say a rally from 0.70 will fail to take hold, as it might – the immediate trend is strongly to the upside.
A H4 close south of 0.70, however, will likely attract breakout sellers, effectively shorting the breakout candle’s close. A H4 retest at 0.70 as resistance, preferably in the form of a H4 bearish candlestick, would also likely see additional shorts join the party.
USD/JPY:
The US dollar came under pressure against the Japanese yen Wednesday, mostly tracking the US dollar index as it responds to risk sentiment.
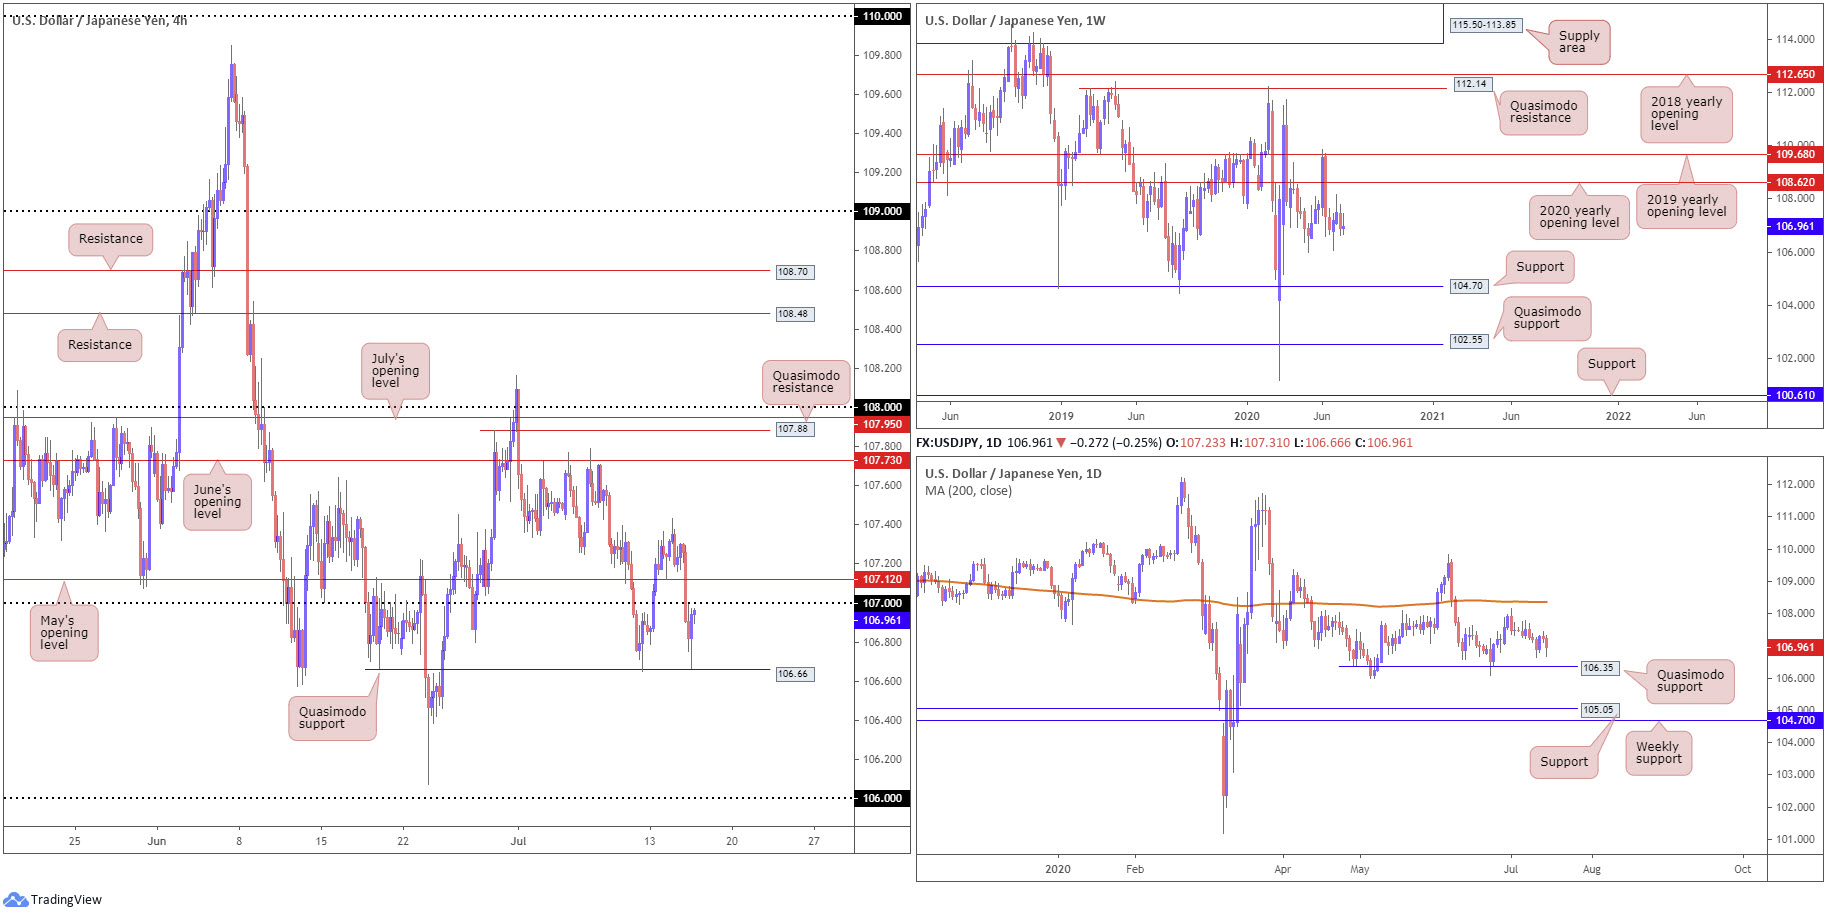
USD/JPY leapt through May’s opening level at 107.12 on the H4 timeframe and the 107 handle, clearing the pathway for familiar Quasimodo support coming in at 106.66. The latter, as you can see, provided some much-needed respite, lifting H4 back to just south of 107.
Further out on the weekly timeframe, price is seen consolidating beneath the 2020 yearly opening level at 108.62. Support, on the other hand, can be derived from the 105.98 6th May low, with a break uncovering long-term support plotted at 104.70. Technical structure on the daily timeframe remains focused on Quasimodo support from 106.35 and the 200-day SMA (orange – 108.36), assuming we get past the 108.16 July 1st high.
Areas of consideration:
With respect to technical confluence, the 107 handle, aside from nearby resistance at 107.12 (May’s opening level [H4]) is somewhat lacking. Therefore, bearish themes between 107.12/107 may struggle. With that being the case, conservative traders still interested in the resistance base may engage if additional confirmation is observed, a bearish candlestick formation, for example.
A retest at the aforementioned H4 Quasimodo support could also come to fruition, though despite holding in recent trade, is unfortunately is in the same position – lacks technical confluence.
USD/CAD:
USD/CAD spiralled south Wednesday after the Bank of Canada’s (BoC) meeting and press conference. The main takeaway, aside from the central bank keeping its monetary policy stance unchanged, was rates were not going anywhere.
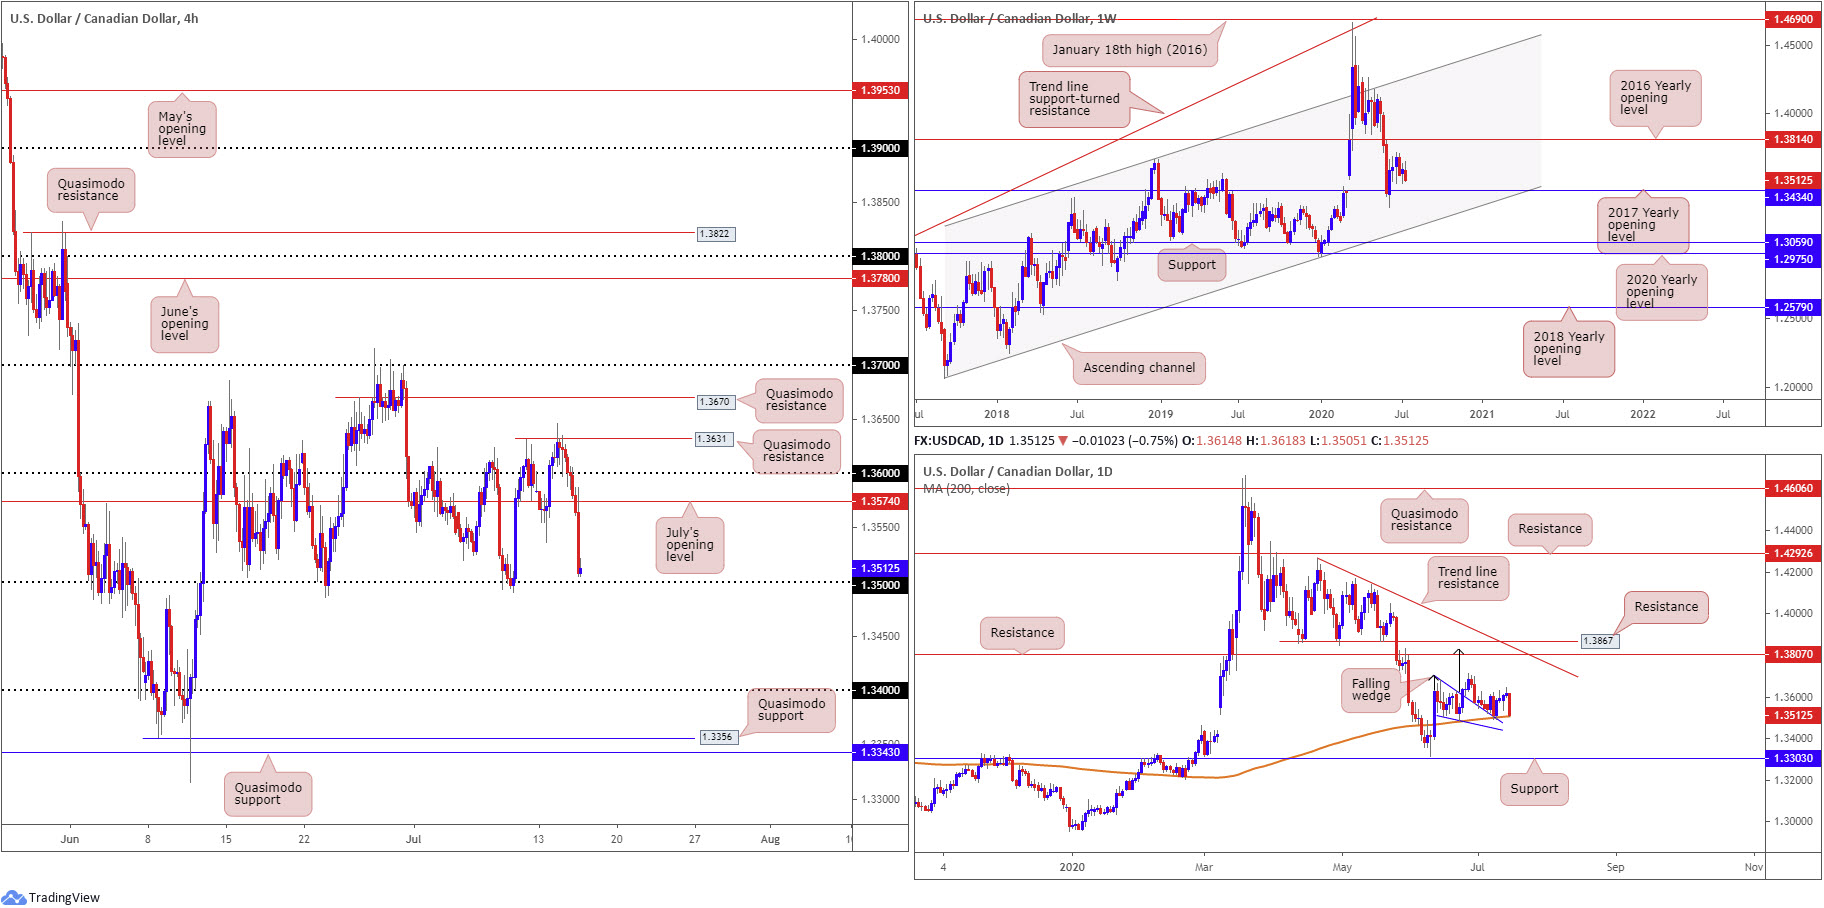
1.36 and July’s opening level at 1.3574 on the H4 put up little fight as a support base, forcing moves to the 1.35 region. As things stand, a break beneath 1.35 could direct H4 candles towards 1.34 and, with effort, maybe even Quasimodo support at 1.3556.
Action on the weekly timeframe is currently stationed north of the 2017 yearly opening level at 1.3434. Beyond 1.3434, channel support, taken from the low 1.2061, can be viewed as the next potential floor. A USD/CAD bid throws the 2016 yearly opening level at 1.3814 in the pot as feasible resistance, with follow-through buying to try and tackle a dense block of supply between 1.4190/1.3912.
Technical movement on the daily timeframe recently witnessed a recovery form from the upper edge of a breached falling wedge pattern (1.3686/1.3504), merging with the 200-day SMA (1.3507). As you can see, though, yesterday’s sell-off has brought price back to the aforementioned 200-day SMA. Should we recover, take-profit targets out of a falling wedge pattern can be measured by taking the base value and adding this figure to the breakout point (black arrows), which as you can see in this case, meets closely with resistance at 1.3807, followed by another layer of resistance at 1.3867.
Areas of consideration:
With the 200-day SMA aligning closely with the 1.35 handle on the H4, the round number offers a platform for buyers to consider today. Conservative traders, owing to the threat of fakeouts around psychological levels, may seek additional confirmation before pulling the trigger.
A break of 1.35 has weekly support at 1.3434 (2017 yearly opening level) to target, followed by 1.34 on the H4.
USD/CHF:
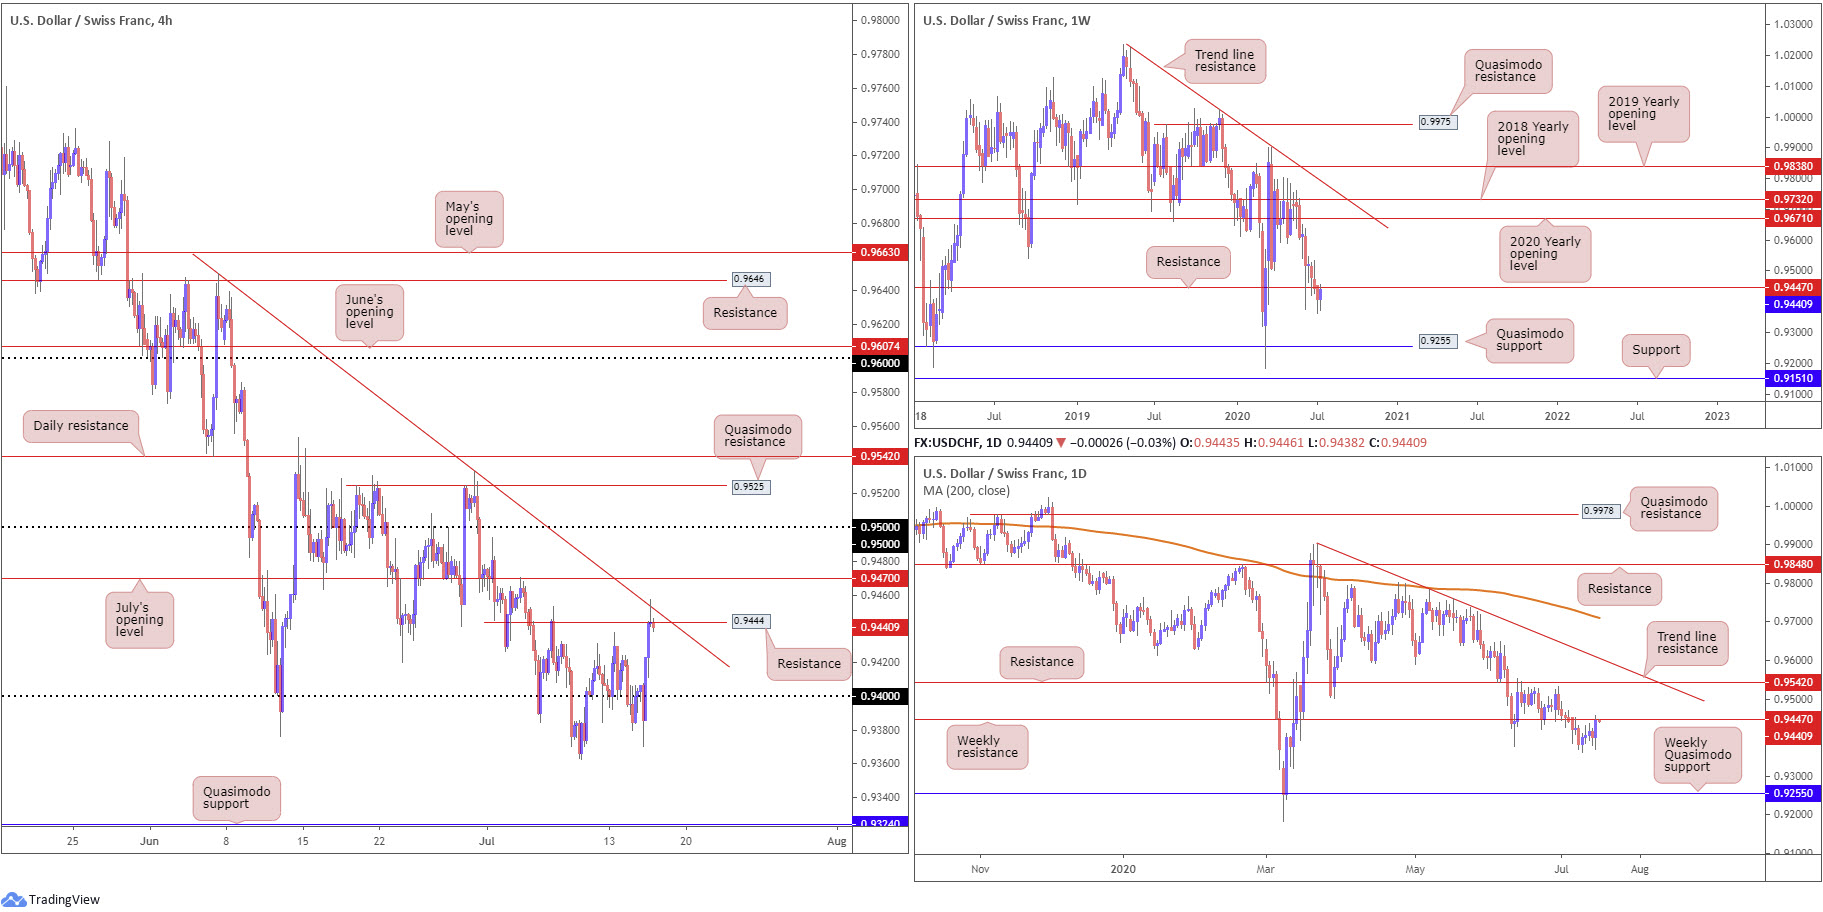
USD/CHF bulls entered an offensive phase Wednesday, retaking 0.94 and crossing paths with H4 resistance coming in at 0.9444 and trend line resistance, extended from the high 0.9650. Above here, traders will acknowledge July’s opening level at 0.9470 and then the 0.95 handle.
Price action, based on the higher timeframes, is seen gripping the underside of weekly resistance at 0.9447. This comes after probing lows at 0.9362.
Areas of consideration:
Keeping things simple this morning, bearish scenarios off H4 resistance at 0.9444 is likely on the watchlists for many traders today, owing to the confluence the level attracts, both locally and on the higher timeframes. With some traders tucking protective stop-loss orders above H4 trend line resistance, the initial downside target will likely be set at 0.94.
Dow Jones Industrial Average:
US equities finished Wednesday higher on COVID-19 developments. The Dow Jones Industrial Average advanced 227.51 points, or 0.85%; the S&P 500 advanced 29.04 points, or 0.91%, and the tech-heavy Nasdaq 100 concluded higher by 12.16 points, or 0.11%.
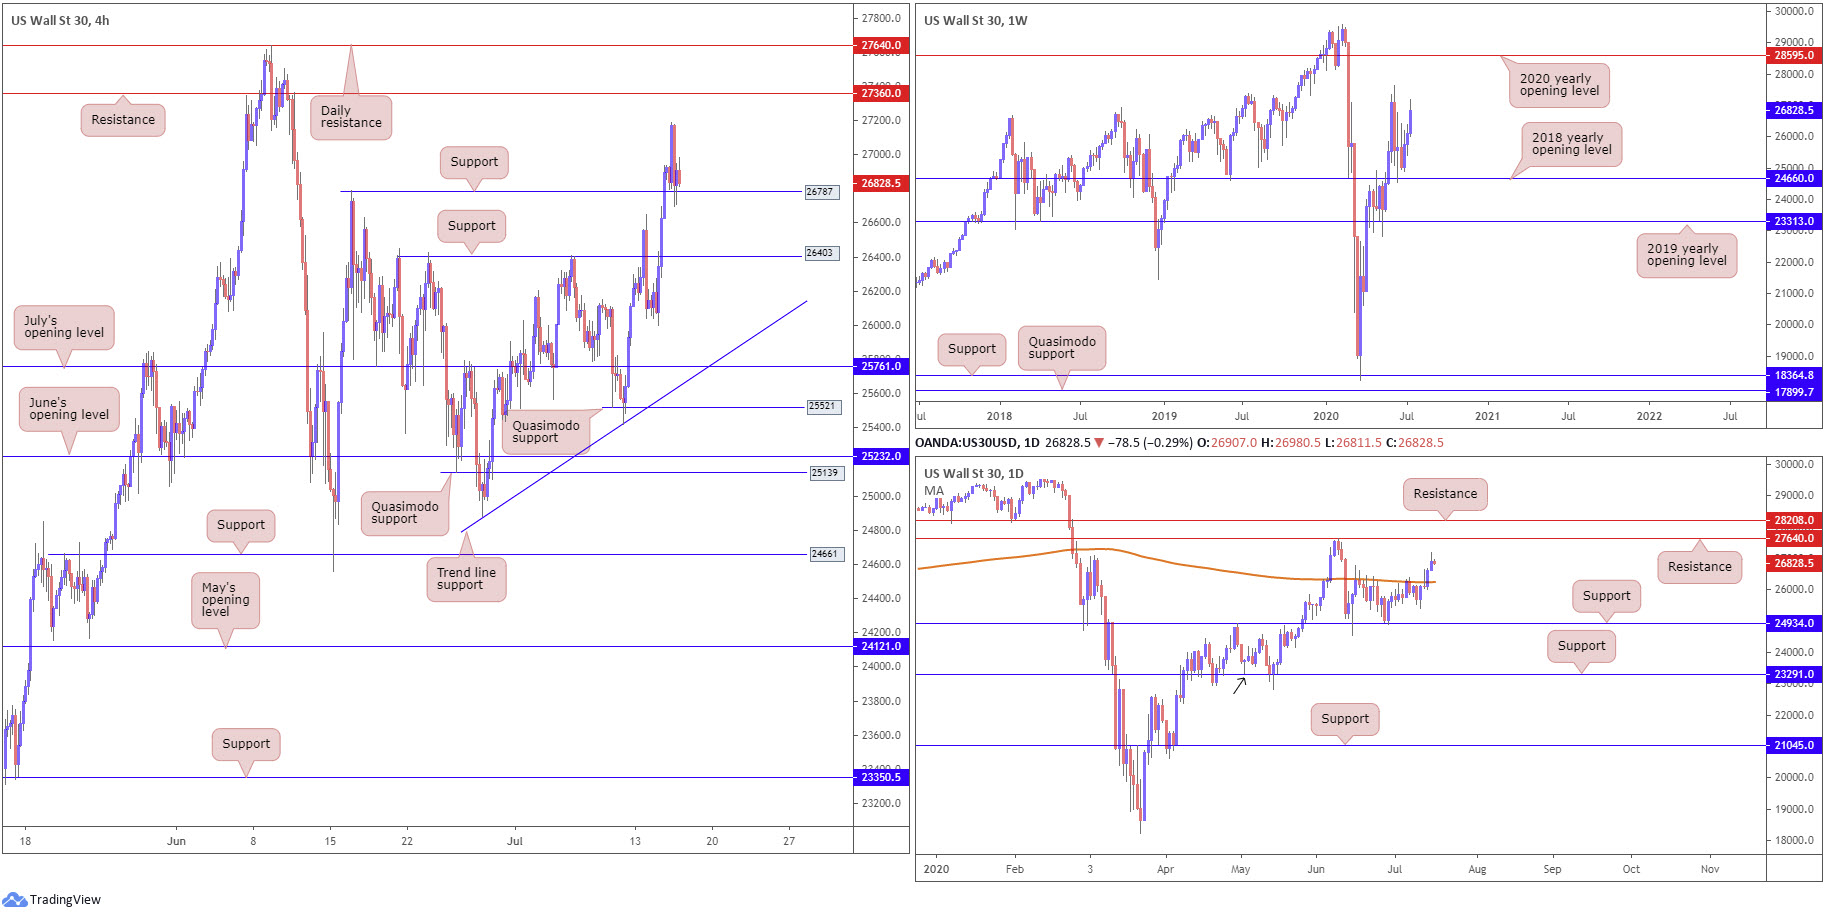
In recent sessions, traders observed price action retest 26787 on the H4 (June 16 high), after recording fresh weekly pinnacles around 27187. This, assuming the retest continues to hold, shines the spotlight on H4 resistance coming in at 27360.
The story on the daily timeframe reveals the 200-day SMA (orange – 26249) recently gave way, a dynamic value capping upside since mid-June. The move higher shifts interest towards resistance at 27640. From the weekly timeframe, the 2018 yearly opening level at 24660 remains an important base of support. In the event traders manage to keep their head above water here, we are likely to pull in the 27638 high, followed by the 2020 yearly opening level at 28595.
Areas of consideration:
Recently closing above the 200-day SMA and extending gains yesterday places H4 buyers on firm footing off support mentioned above at 26787. A clear H4 bullish candlestick signal generated from the said support may be enough to entice buyers into the market today and push for H4 resistance at 27360.
XAU/USD (GOLD):
XAU/USD prices were pretty much unmoved in recent trading, though did manage to secure a fresh intraday high at 1815.2. But as things stand, the yellow metal concluded in the shape of a doji indecision candle on the daily timeframe.
Wednesday’s technical briefing had the following to report on the H4 timeframe (italics):
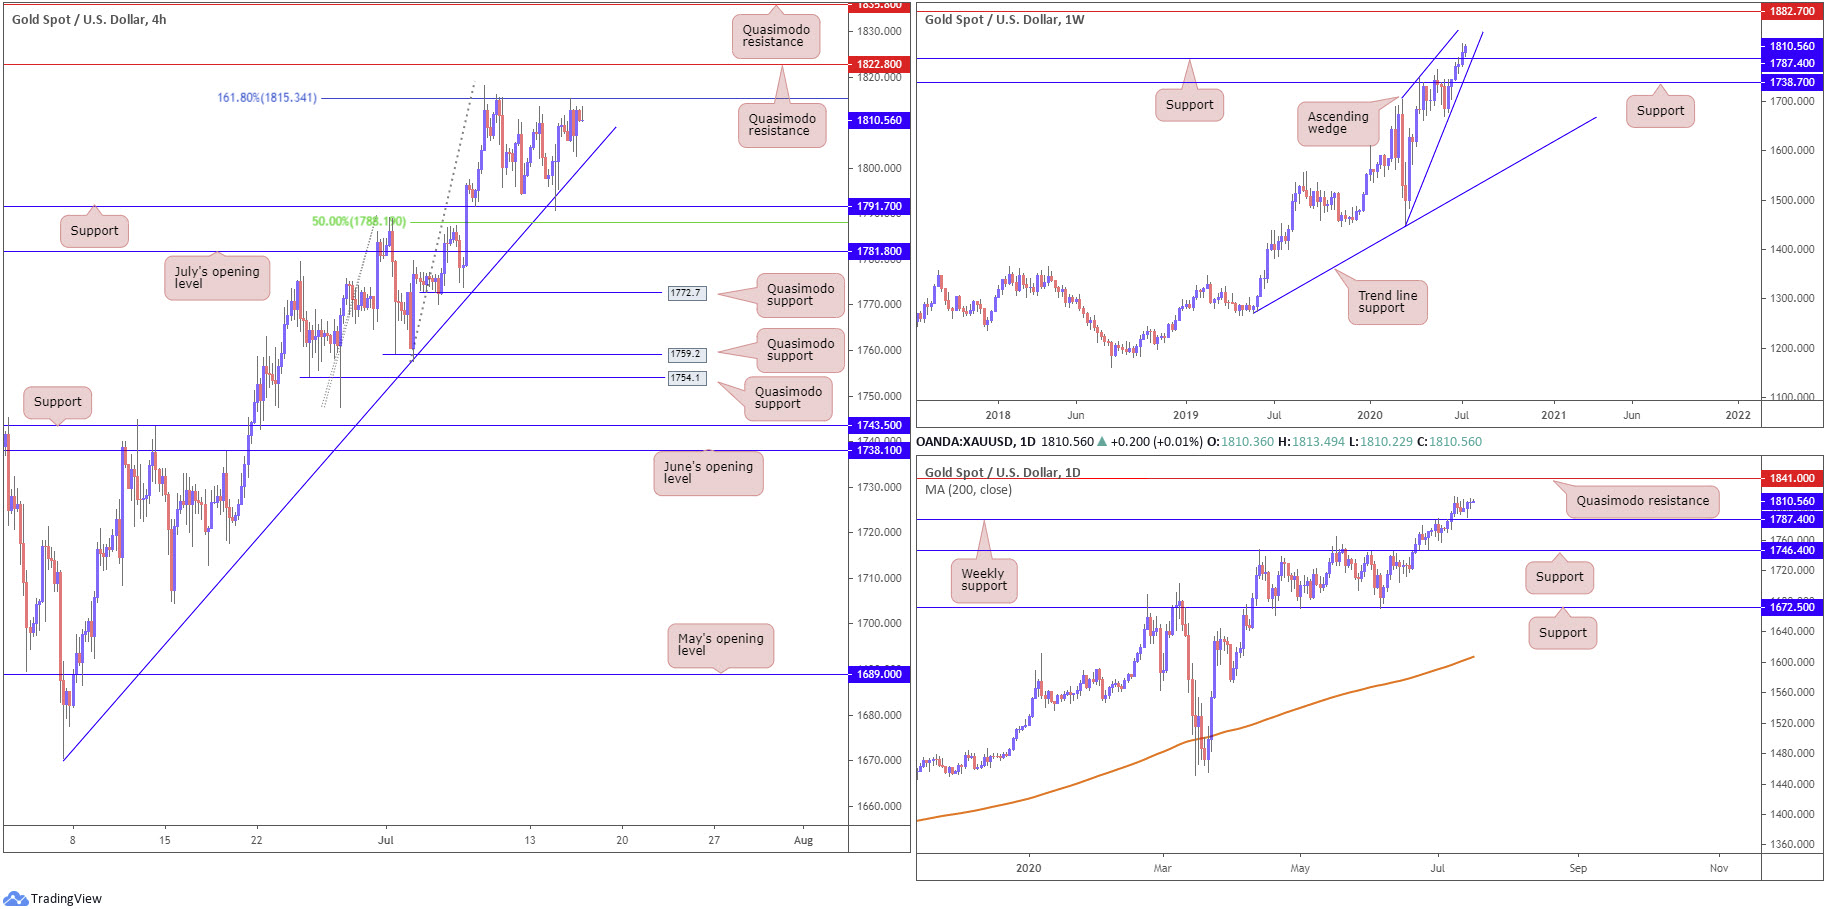
As evident from the H4 chart this morning, Tuesday had price action cross swords with support at 1791.7 and merging trendline support, extended from the low 1670.4, missing a 50.00% retracement ratio at 1788.1 by a hair before turning higher. What’s appealing about the aforementioned H4 structure is its connection with weekly support at 1787.4.
Going forward, we can see H4 price brought in the 161.8% H4 Fibonacci extension point at 1815.3 yesterday, a noted take-profit zone, with H4 Quasimodo resistance at 1822.8 set as the next point of interest. It was also noted in Wednesday’s report that should we reach this far north, traders are urged to pencil in the possibility of climbing to another H4 Quasimodo resistance at 1835.8. This is the point the yellow metal may begin to close in on higher timeframe resistances: 1882.7 and 1841.0.
As a reminder, here’s where we stand on the higher timeframes (italics):
From the weekly timeframe, bulls elbowed above Quasimodo resistance at 1787.4 (now a serving support) in recent trading. In line with the underlying trend, the break higher has perhaps laid the foundation for continuation buying to resistance stationed at 1882.7. Also of interest on the weekly timeframe is a potential ascending wedge pattern, forming between 1451.4/1703.2. In addition, clearing weekly Quasimodo resistance at 1787.4 on the daily timeframe stresses a possible run to daily Quasimodo resistance at 1841.0.
Areas of consideration:
Traders long the 1791.7 retest have likely reduced risk to breakeven and banked partial profits at the 161.8% H4 Fibonacci extension point from 1815.3.
With the higher timeframes pointing to further upside, as underscored in recent writing, additional buying opportunities might be found above 1822.8.
The accuracy, completeness and timeliness of the information contained on this site cannot be guaranteed. IC Markets does not warranty, guarantee or make any representations, or assume any liability regarding financial results based on the use of the information in the site.
News, views, opinions, recommendations and other information obtained from sources outside of www.icmarkets.com.au, used in this site are believed to be reliable, but we cannot guarantee their accuracy or completeness. All such information is subject to change at any time without notice. IC Markets assumes no responsibility for the content of any linked site.
The fact that such links may exist does not indicate approval or endorsement of any material contained on any linked site. IC Markets is not liable for any harm caused by the transmission, through accessing the services or information on this site, of a computer virus, or other computer code or programming device that might be used to access, delete, damage, disable, disrupt or otherwise impede in any manner, the operation of the site or of any user’s software, hardware, data or property.


