
Key risk events today:
Australia Job’s Data; BoE Credit Conditions Survey; Canada Manufacturing Sales m/m; US Unemployment Claims; US Building Permits; Philly Fed Manufacturing Index.
(Previous analysis as well as outside sources – italics).
EUR/USD:
Wednesday had the US dollar index recover in strong fashion, albeit off best levels south of 100.00. As of writing, the DXY is seen flirting with 99.50.
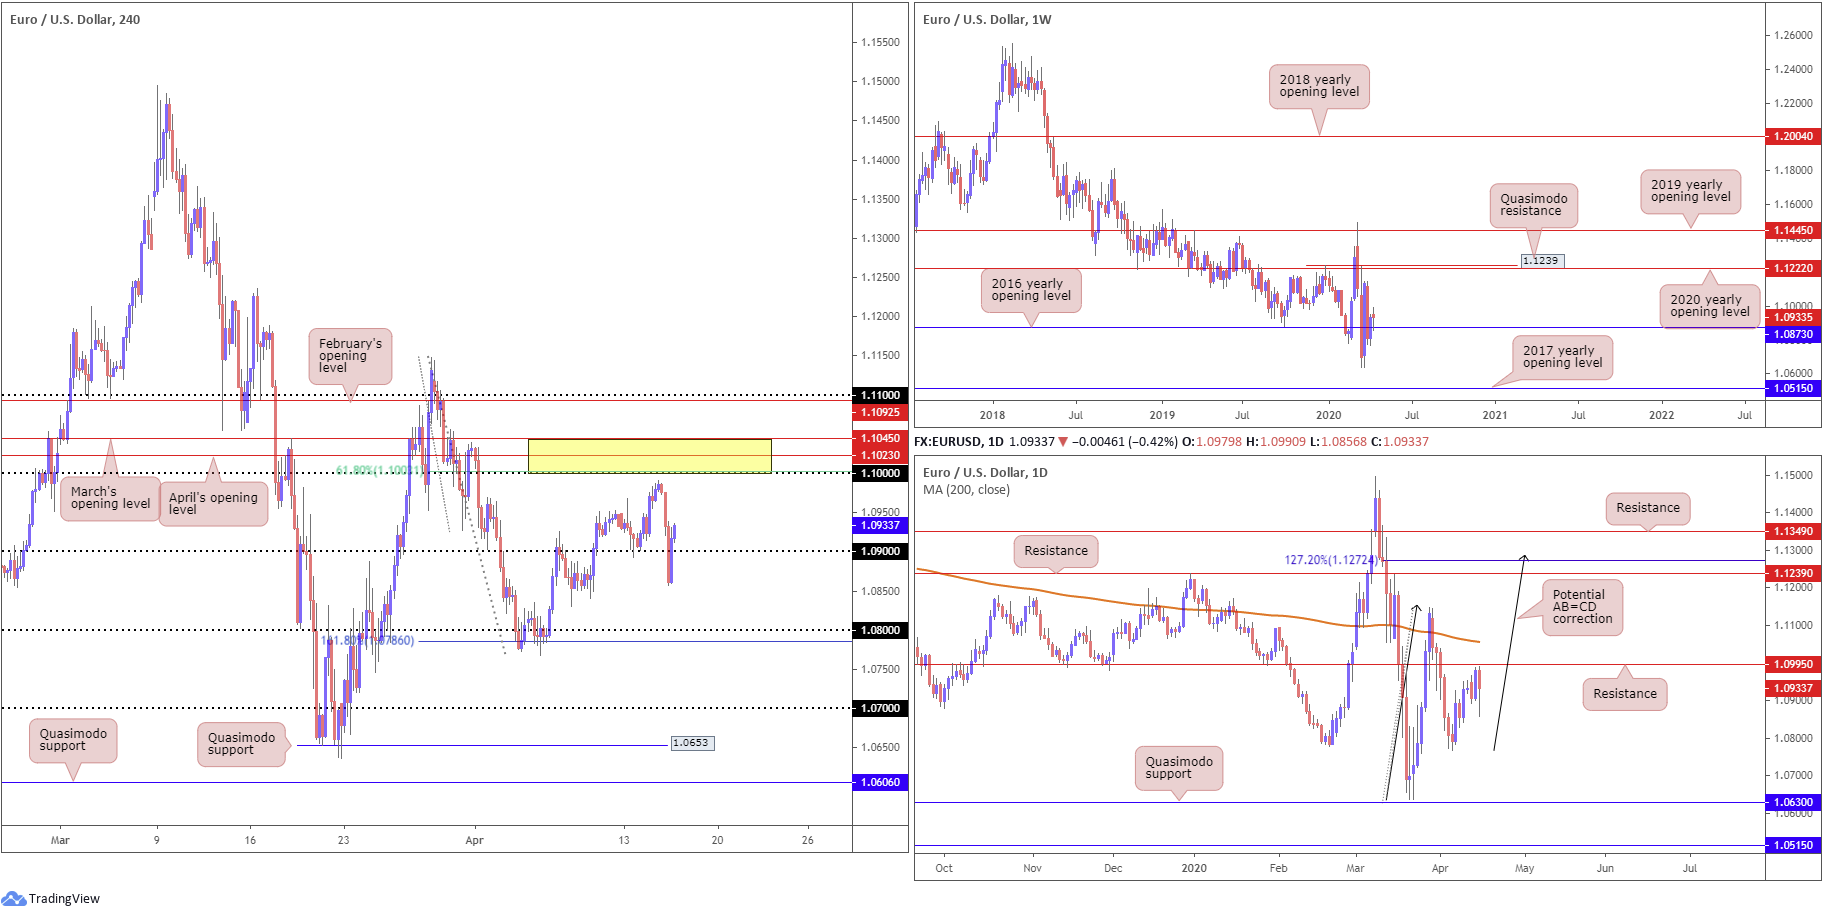
EUR/USD movement, on the other hand, collapsed lower. Leaving the key figure 1.10 unchallenged, the pair surpassed 1.09, clocking lows of 1.0857 before reclaiming 1.09+ status into US trade. In the event we make a play for higher levels north of the said round number today, crosshairs will likely be fixed on 1.1045/1.10 (yellow). 1.1045/1.10 is comprised of March and April’s opening levels at 1.1045 and 1.1023, a 61.8% Fibonacci retracement at 1.1003 and the key figure 1.10.
Beyond H4 studies, weekly price recently retested the 2016 yearly opening level at 1.0873 and held. Skies above here are reasonably blue; a run to the 2020 yearly opening level at 1.1222, shadowed by a Quasimodo resistance at 1.1239 is certainly not out of the question.
From the daily timeframe, however, price action ran into waters just beneath resistance at 1.0995, which, as you can see, is stationed beneath a 200-day SMA (orange – 1.1056). Continued downside could see the 1.0783 April 7 low come into existence. Above the said structures, nonetheless, harmonic traders will note a potential 127.2% AB=CD correction (black arrows) at 1.1272, sited a few points above resistance priced in at 1.1239.
Areas of consideration:
A retest at 1.09, preferably served up in the shape of a H4 bullish candlestick pattern, may offer buyers a window of opportunity into this market, targeting the 1.10ish region. This is bolstered by the fact we’re coming off weekly support, by way of the 2016 yearly opening level at 1.0873.
The H4 resistance area at 1.1045/1.10, as highlighted above, is a key base traders still likely have eyes on. Not only does it offer buyers a take-profit target from 1.09, sellers may consider this a location for shorts. In addition to its H4 confluence, daily resistance mentioned above at 1.0995 converges close by, adding to its bearish presence.
GBP/USD:
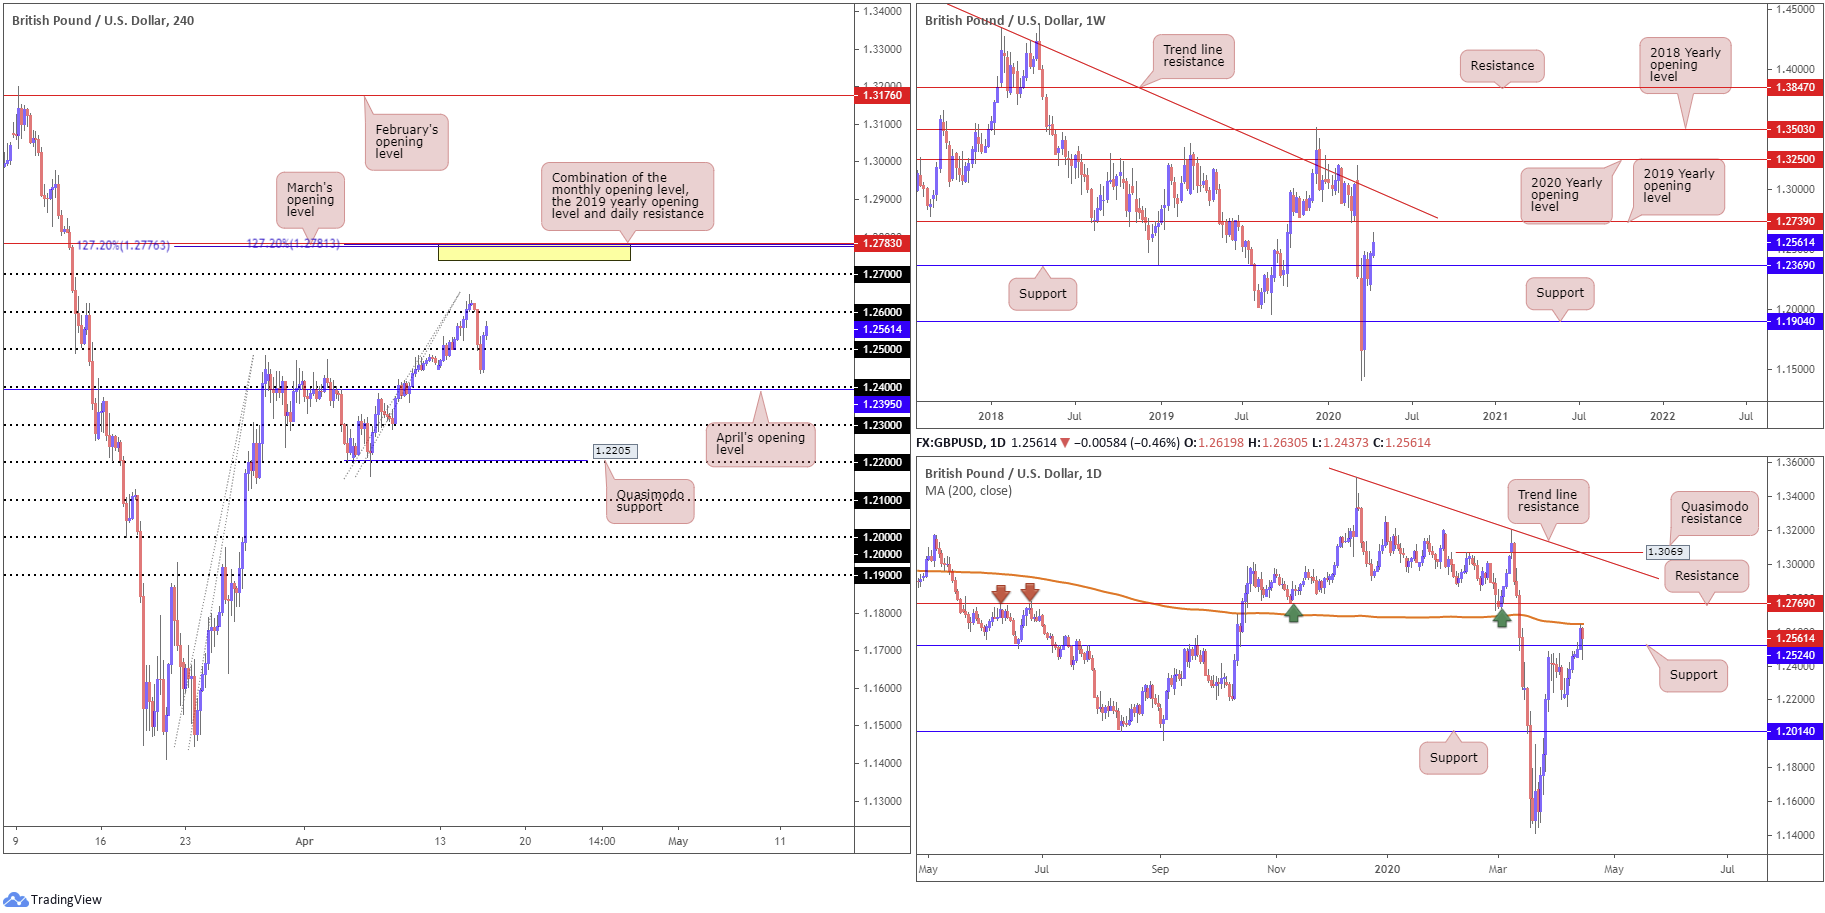
Sterling failed to sustain gains above 1.26 Wednesday amid resurgent USD demand. The H4 candles voyaged sub 1.25 and struck session lows at 1.2437, likely tripping sell-stop liquidity before chalking up strong recovery gains into US movement. 1.26 re-entered sight, with a break exposing 1.27 and March’s opening level at 1.2783.
Across the page on the daily timeframe, the action faded the 200-day SMA (orange – 1.2647) and shook hands with neighbouring support at 1.2524. Chart studies also indicates resistance lurking close by at 1.2769 – note the level boasts strong history (arrows). Another school of thought on the weekly timeframe, however, has price action tilting towards the 2019 yearly opening level at 1.2739, after overrunning resistance at 1.2369 (now serving as support).
Areas of consideration:
Although another response from the 200-day SMA is feasible today, we cannot rule out the possibility of fresh upside attempts, having noted the weekly timeframe’s position. Therefore, a retest at 1.25 could be an idea worth keeping an eye out for today for buying opportunities. Alternatively, a push through 1.26 may trigger breakout buying strategies, targeting 1.27 as the initial port of call.
The yellow zone on the H4 timeframe between 1.2783/1.2739 also remains a point of interest in this market, made up of March’s opening level at 1.2783, daily resistance at 1.2769, weekly resistance at 1.2739 and two 127.2% Fibonacci extension levels at 1.2781 and 1.2776. Not only is this a logical target for any longs, it represents a potential resistance zone for sellers to make an appearance.
AUD/USD:
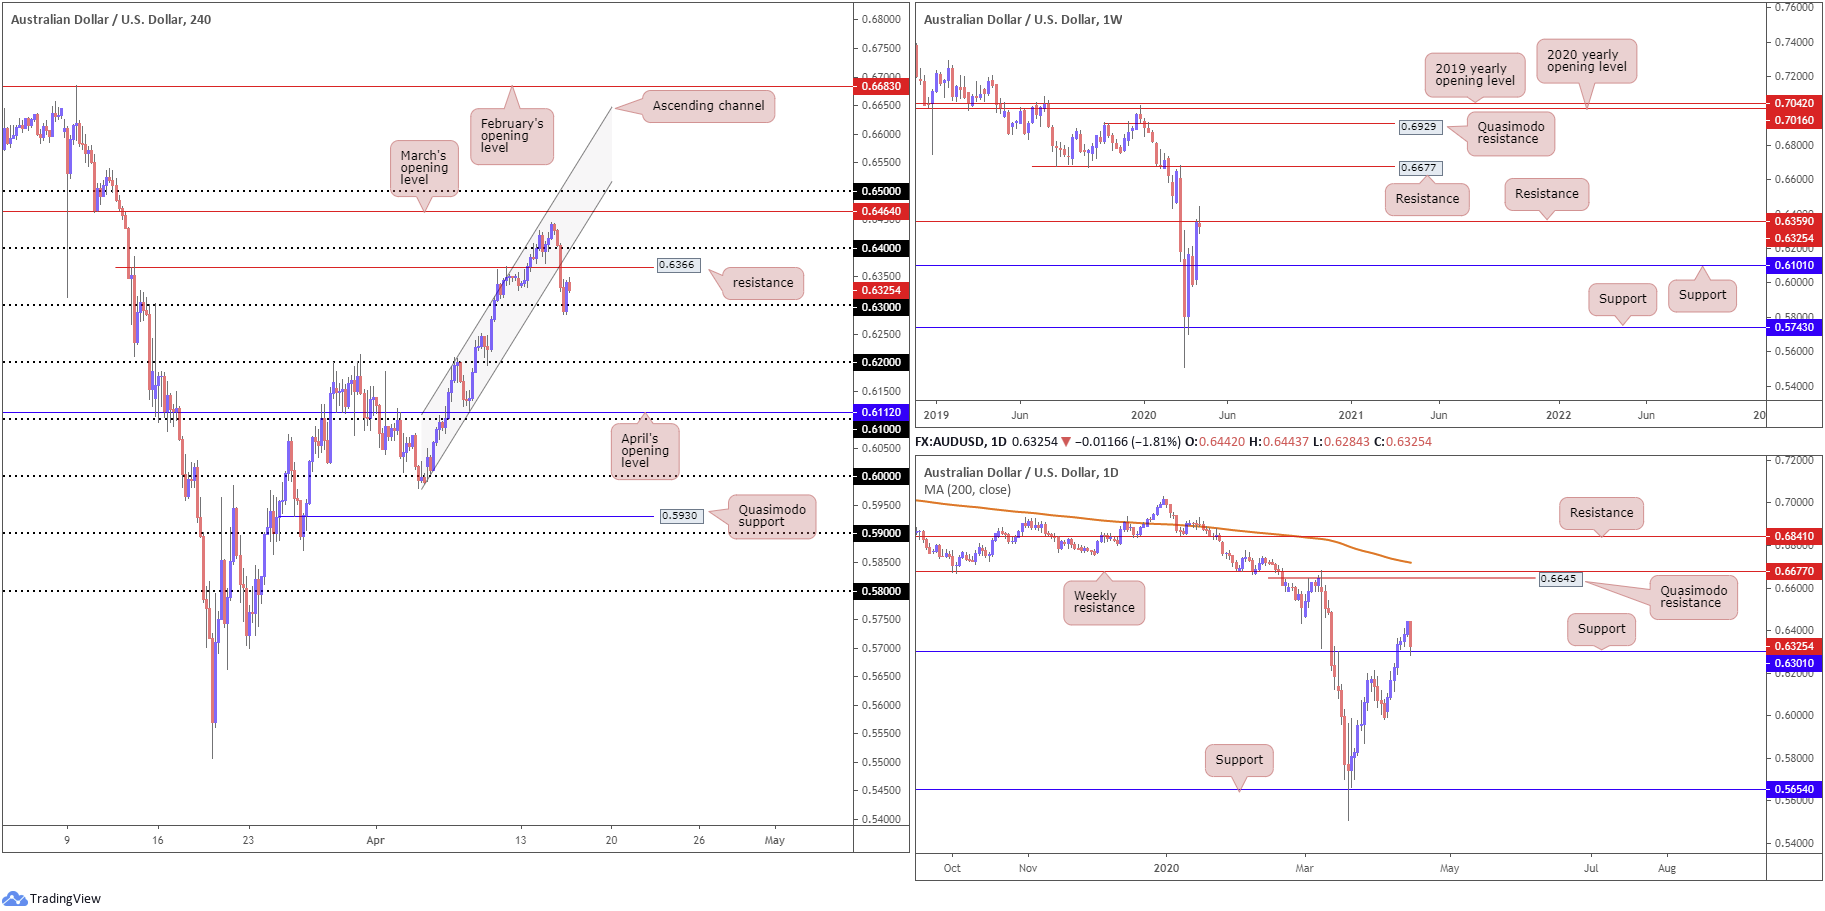
The Australian dollar wrapped up lower against a healthier buck Wednesday, snapping the pair’s seven-day bullish phase. AUD/USD, based on the H4 timeframe, threw itself south of 0.64 in early European hours and attacked nearby support at 0.6366 as well as channel support, taken from the low 0.5988.
The day ended with H4 price unsurprisingly rebounding from 0.63, having seen the level align closely with daily support pencilled in at 0.6301. The problem with this, technically speaking, is we also note weekly sellers attempting to make a show off resistance at 0.6359, formed by a potential shooting star candlestick pattern – generally considered a bearish signal among candlestick enthusiasts.
Areas of consideration:
Technical studies suggest lower levels could be on the cards from weekly resistance, due to the theory that higher-timeframe structure tends to overrule the lower timeframes. As a result, bearish scenarios sub 0.63 could be in the offing today, targeting 0.62 as an initial take-profit zone.
USD/JPY:
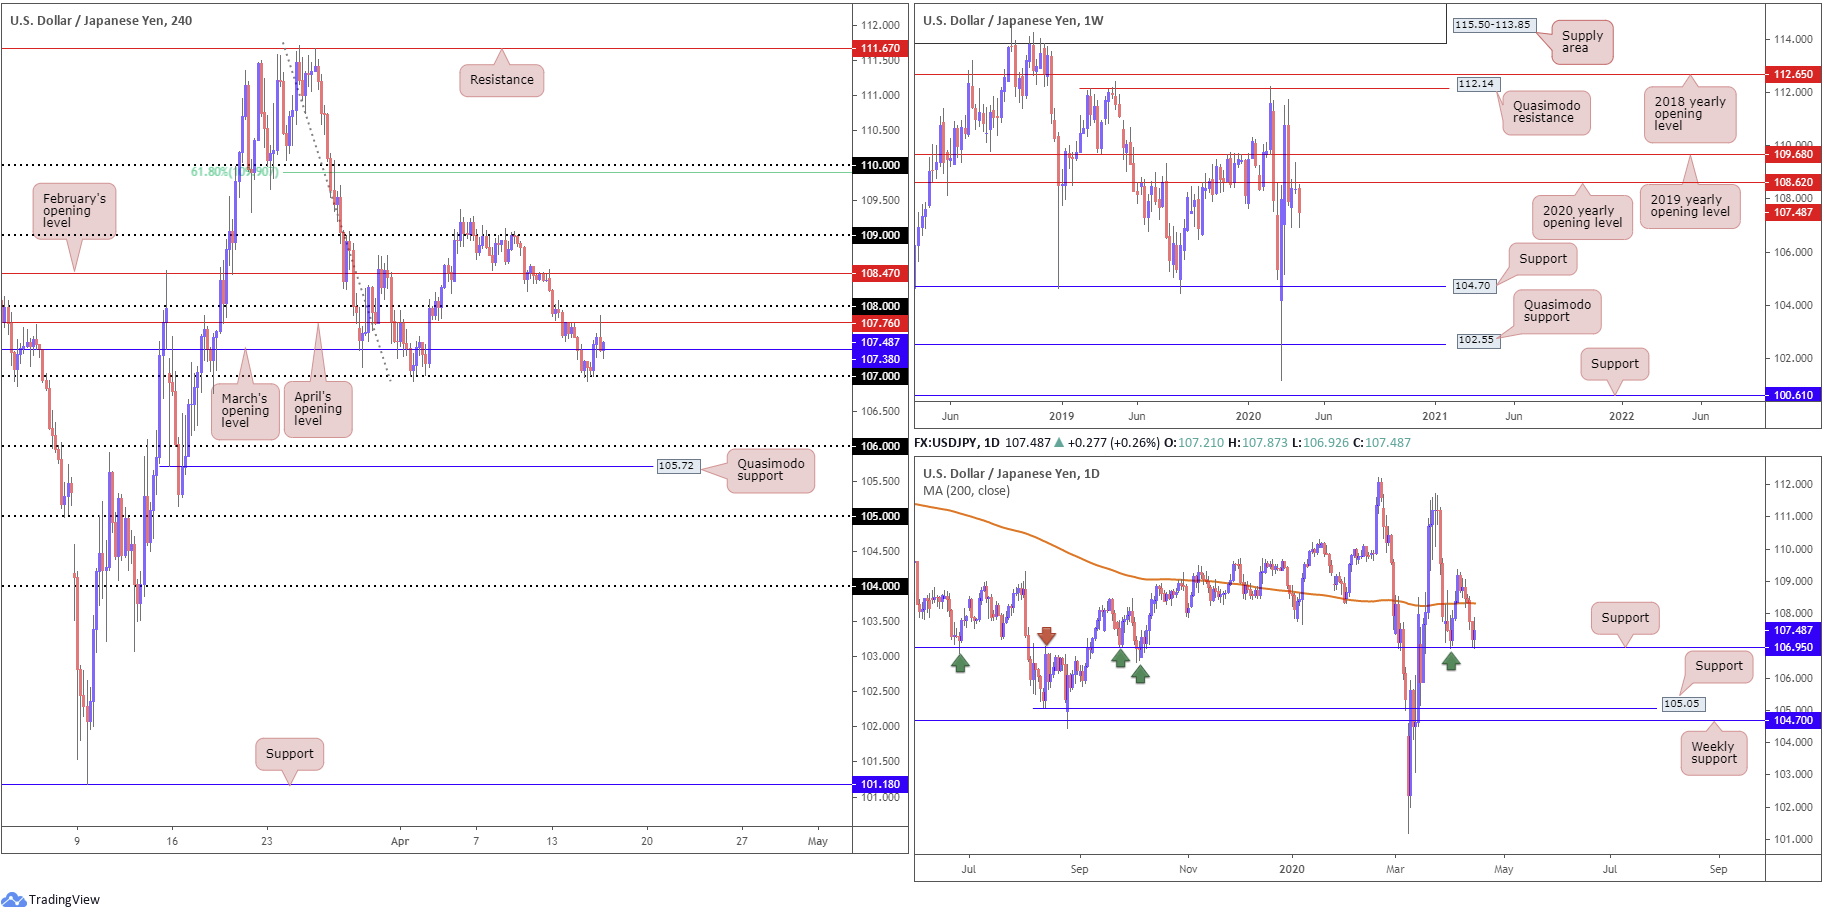
The pair found technical support off the 107 handle on the H4 timeframe in recent trade, bolstered by daily support at 106.95, which brings with it strong historical significance (arrows). April’s opening level at 107.76 capped upside in recent hours, forming a notable selling wick that missed 108 by only a handful of points. As of current price, we’re discovering modest support off March’s opening level at 107.38.
Despite the above, the vibe on the weekly timeframe communicates a bearish tone – price action concluded last week by way of a clear-cut shooting star candlestick configuration off the 2020 yearly opening level at 108.62, with this week so far following through to the downside. The next support target is not seen until 104.70. Note this figure also represents the lower boundary of a multi-month range between Quasimodo resistance at 112.14.
Areas of consideration:
Weekly price suggesting lower levels certainly places a question mark on further gains above 107. Although additional upside is not out of the question, traders are urged to pencil in the possibility of moves materialising through 107, perhaps re-opening the door for bearish scenarios to 106.
USD/CAD:
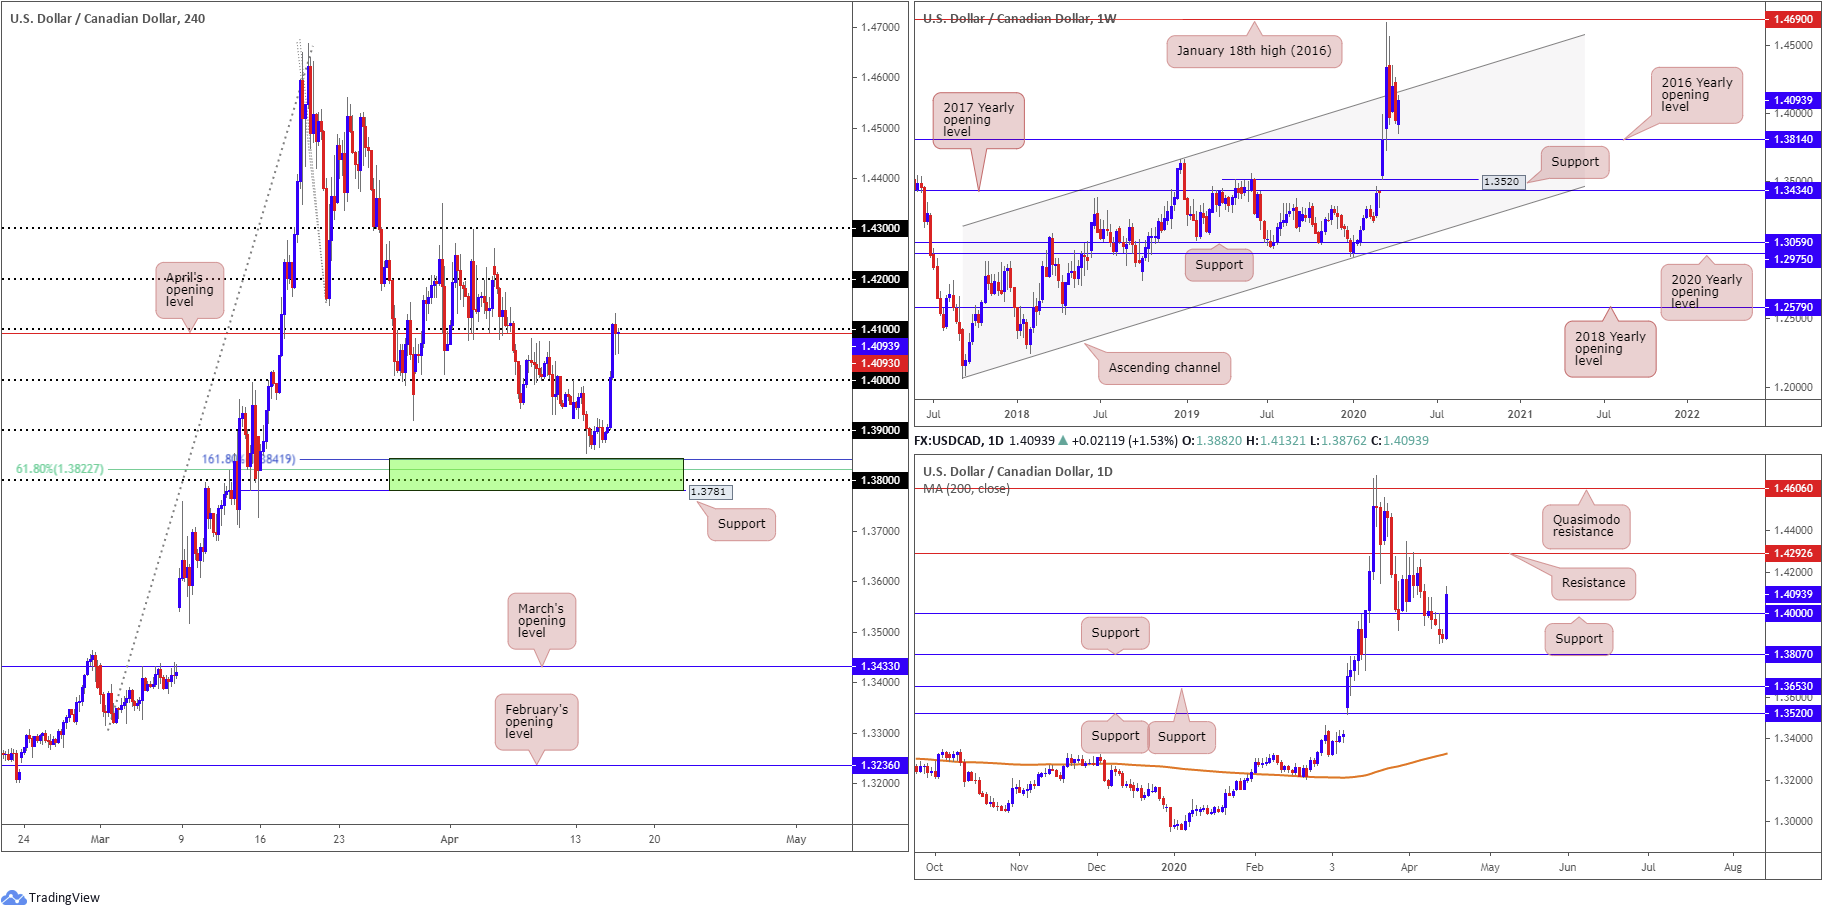
USD/CAD bulls entered a robust offensive phase Wednesday, adding more than 200 points, or 1.40%.
The pair eclipsed a number of key technical resistances on the H4 timeframe, including the key figure 1.40. Waning WTI prices and a healthy USD bid supported the recent advance, landing the H4 candles around 1.41 alongside April’s opening level at 1.4093.
The Bank of Canada (BoC) maintained its target for the overnight rate at ¼ percent, which the Bank considers its effective lower bound. The Bank Rate is correspondingly ½ percent and the deposit rate is ¼ percent. The Bank also announced new measures to provide additional support to Canada’s financial system. The necessary efforts to contain the COVID-19 pandemic have caused a sudden and deep contraction in economic activity and employment worldwide[1].
Technically on the higher timeframes, we have daily price navigating levels above support at 1.4000, with resistance positioned at 1.4292 as the next upside target on this scale. From the weekly timeframe, last week’s session ended in the form of a weekly bearish engulfing candle. Despite an earnest attempt to lower levels this week, price has so far failed to reach the 2016 yearly opening level at 1.3814, poised to approach channel resistance, extended from the high 1.3661.
Areas of consideration:
Until reconnecting with weekly channel resistance, buyers may have the upper hand. Daily price also exhibits scope to track down resistance at 1.4292 and H4 sellers have shown little from 1.41. In fact, a number of buy stops were likely triggered by yesterday’s move to highs at 1.4132.
As a result, we could be heading higher today, shifting focus to possible breakout buying opportunities above 1.41 to 1.42.
Dow Jones Industrial Average:
Major US equity benchmarks crossed into negative territory Wednesday as investors digested disappointing corporate earnings reports and dismal economic data resulting from the COVID-19 pandemic. The Dow Jones Industrial Average erased 445.41 points, or 1.86%; the S&P 500 also lost 62.70 points, or 2.20%, and the tech-heavy Nasdaq 100 concluded lower by 100.20 points, or 1.15%.
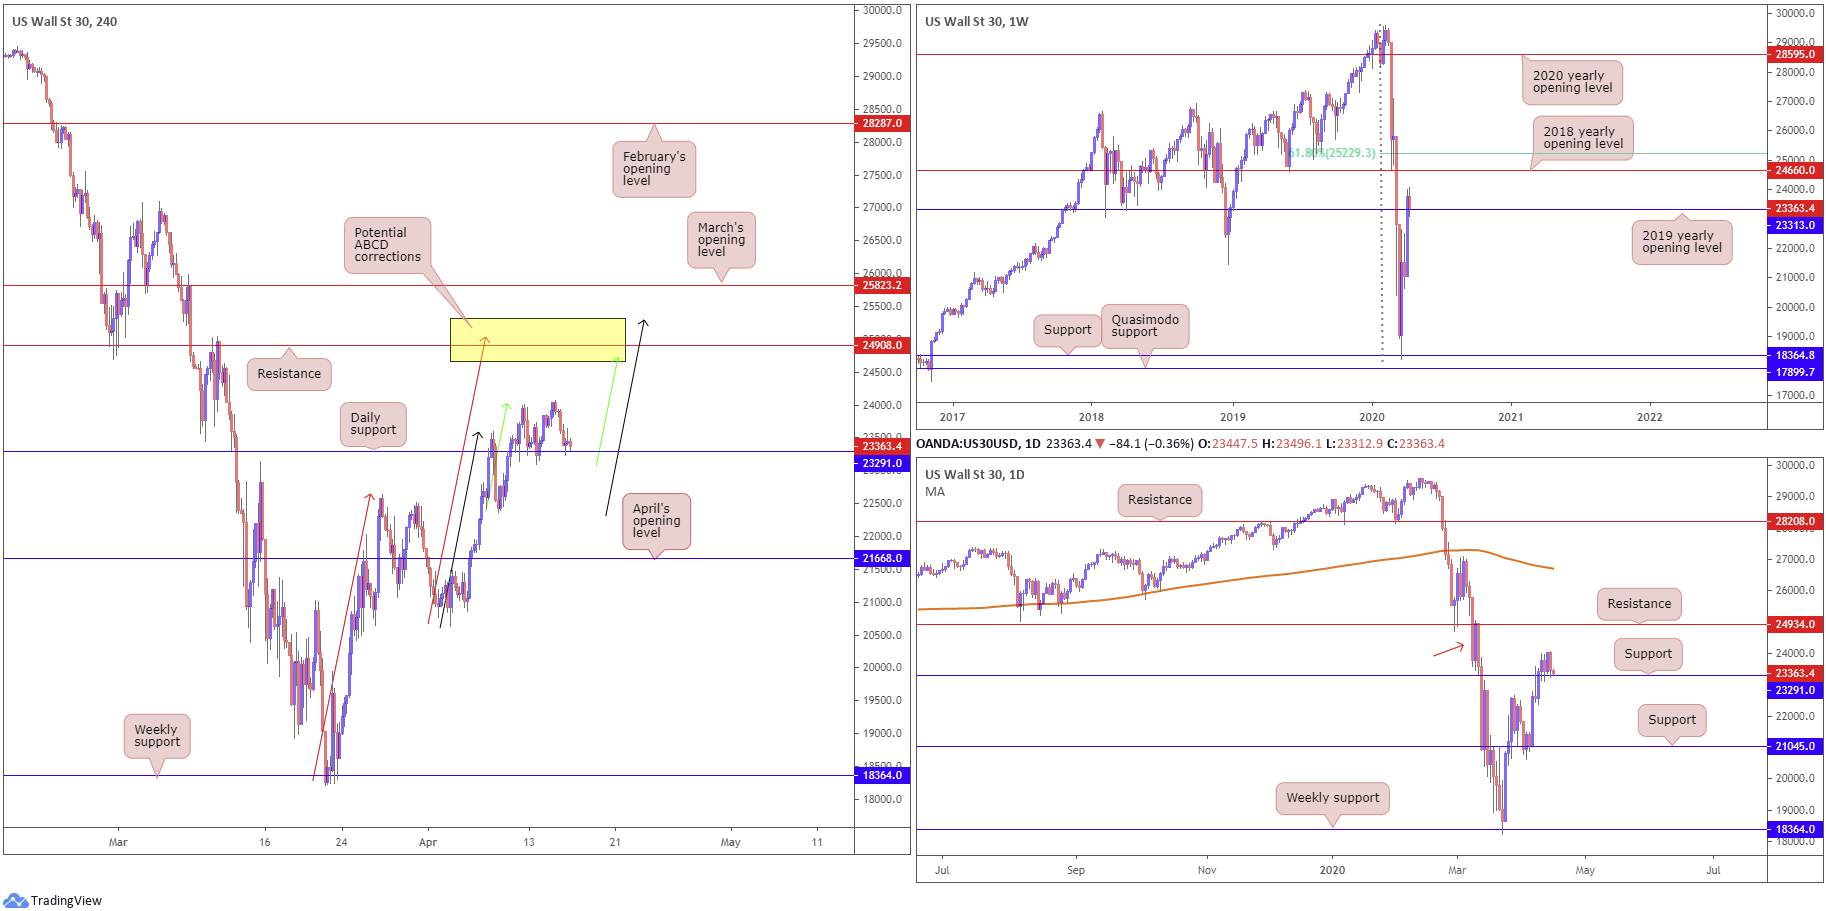
Technically speaking, from the weekly timeframe we are seeing price retest the 2019 yearly opening level at 23313. Successfully holding off this base could spark another wave of buying towards the 2018 yearly opening level at 24660.
A closer reading on the daily timeframe has price retesting 23291 as support. This potentially sets the stage for further upside to 24934, though buyers must contend with possible supply around 25000/23776, denoted by a red arrow.
On the H4 timeframe, in spite of yesterday’s decline, price appears free to approach resistance coming in at 24908. Surrounding this area, we also have three potential ABCD completions at 25028 (red arrows), 25317 (black arrows) and 24759 (green arrows). Note the yellow area at 25317/24660 not only includes the said ABCD patterns, the base also houses daily resistance at 24934 and weekly resistance in the form of the 2018 yearly opening level at 24660.
Areas of consideration:
In view of the technical picture presented here, daily support at 23291 and the 2019 yearly opening level on the weekly timeframe at 23313 denote a potential buy zone today.
Given the number of technical levels converging within 25317/24660, this will likely garner interest. Not only is the area an ideal take-profit zone for longs off daily support at 23291, the zone also offers a base for potential bearish scenarios.
XAU/USD (GOLD):
Dollar upside weighed on the yellow metal Wednesday, though reviving safe-haven demand, amid a sell-off in global equities, appears to have provided some support.
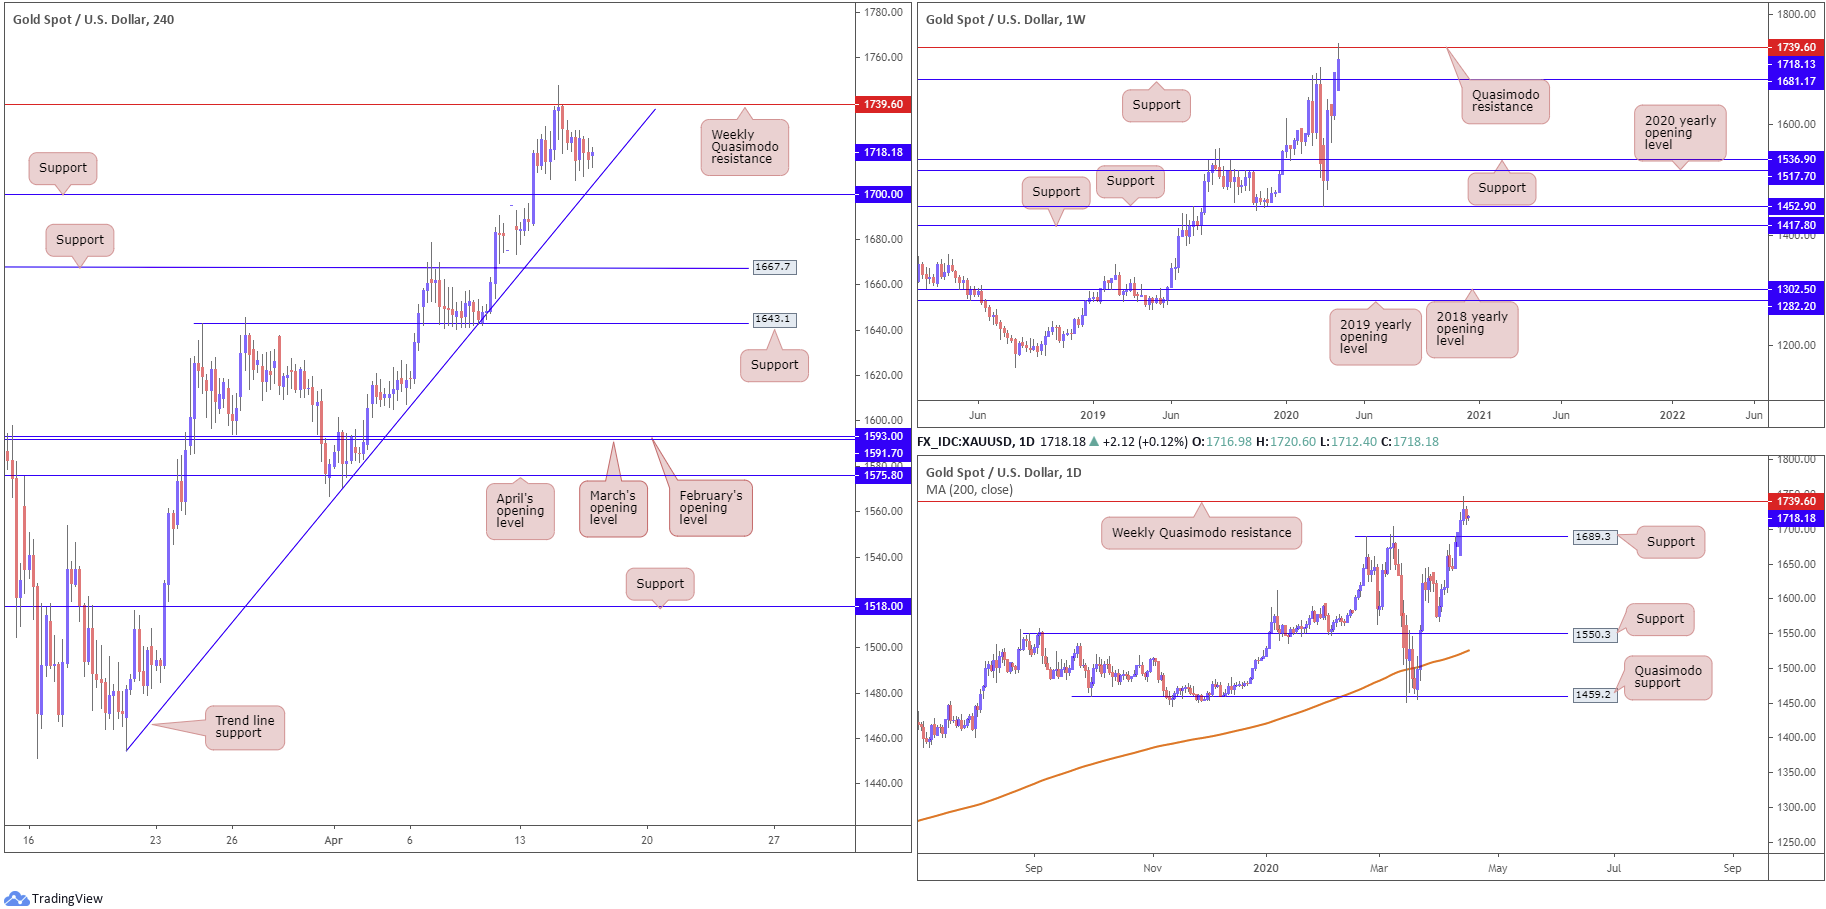
Upside attempts on the weekly timeframe are limited for now by a Quasimodo resistance at 1739.6, extended from late 2012. This follows a recent move through weekly resistance at 1681.1 (now a serving support).
The reaction from weekly Quasimodo resistance mentioned above at 1739.6, according to the technical landscape on the daily timeframe, could extend losses to support coming in at 1689.3, a prior Quasimodo resistance level
A closer examination of movement on the H4 timeframe has price hovering/consolidating nearby a trend line support, taken from the low 1454.9, with a break underlining neighbouring support at 1700.0. Activity beyond the noted levels could see bullion knocking on the door of 1667.7 and 1643.1, both viable support levels.
Areas of consideration:
Having noted a weekly Quasimodo resistance recently entering the fold at 1739.6, H4 buyers off the trend line support and 1700.0 region are likely to face opposition. This is also supported by the fact daily price lacks support until reaching 1689.3.
This may lead to a sell signal forming sub 1700.0, though do remain cognisant daily support enters the fold at 1689.3, leaving little room for manoeuvre.
As of current price, neither direction appears attractive.
The accuracy, completeness and timeliness of the information contained on this site cannot be guaranteed. IC Markets does not warranty, guarantee or make any representations, or assume any liability regarding financial results based on the use of the information in the site.
News, views, opinions, recommendations and other information obtained from sources outside of www.icmarkets.com.au, used in this site are believed to be reliable, but we cannot guarantee their accuracy or completeness. All such information is subject to change at any time without notice. IC Markets assumes no responsibility for the content of any linked site.
The fact that such links may exist does not indicate approval or endorsement of any material contained on any linked site. IC Markets is not liable for any harm caused by the transmission, through accessing the services or information on this site, of a computer virus, or other computer code or programming device that might be used to access, delete, damage, disable, disrupt or otherwise impede in any manner, the operation of the site or of any user’s software, hardware, data or property.
[1] https://www.bankofcanada.ca/2020/04/fad-press-release-2020-04-15/


