
Key risk events today:
Australia Jobs Figures; Philly Fed Manufacturing Index; US weekly Unemployment Claims.
(Previous analysis as well as outside sources – italics).
EUR/USD:
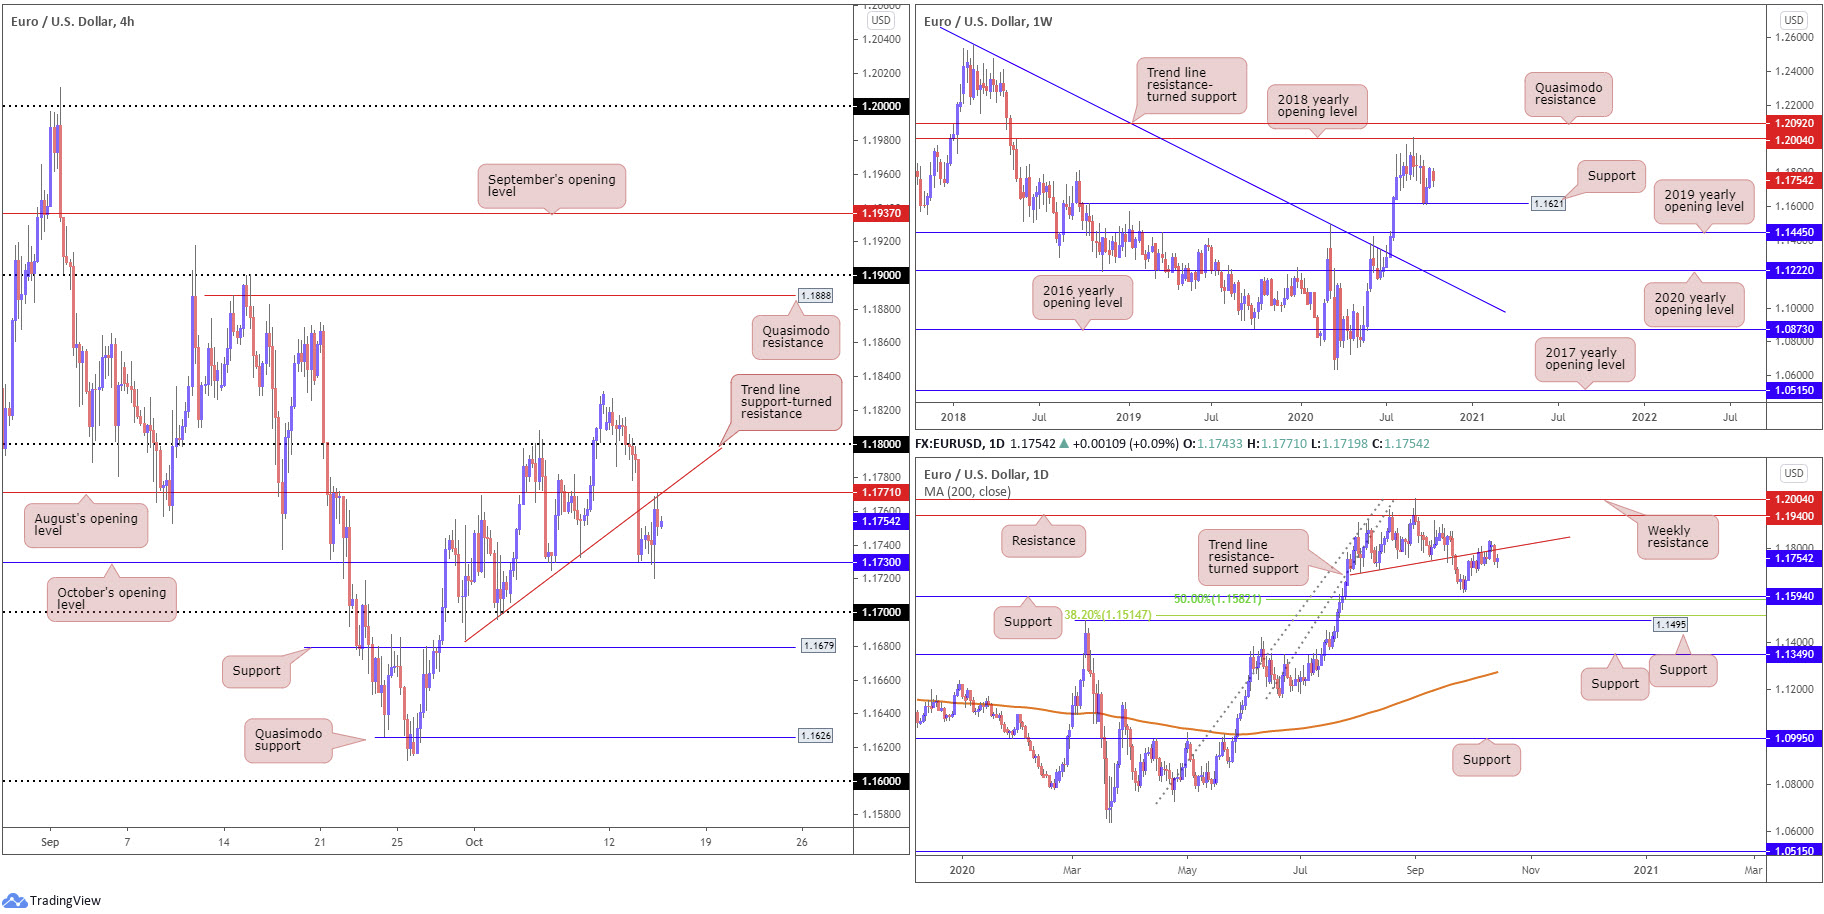
Europe’s single currency modestly rebounded from one-week lows against a broadly softer greenback on Wednesday. Technically, the H4 candles recoiled from October’s opening value at 1.1730 with enough force to shake hands with August’s opening value at 1.1771 (and converging trend line support-turned resistance, taken from the low 1.1684). Outside of the two aforementioned levels, traders will acknowledge the 1.17 and 1.18 levels, with the former closely linked to support plotted at 1.1679.
Higher up on the curve, daily price has buyers and sellers wrestling for position around a trend line support-turned resistance, etched from the low 1.1695. Moves to the downside shines the headlights on support at 1.1594 (and a 50.0% retracement ratio at 1.1582), whereas resistance at 1.1940 could make an appearance should buying emerge.
The view from the weekly timeframe, however, shows longer-term flow hovers north of minor support from 1.1621, set above the 2019 yearly opening value at 1.1445. Despite the lack of commitment from buyers right now, the 2018 yearly opening value at 1.2004 represents valid resistance.
Areas of consideration:
For those who read Wednesday’s technical briefing you may recall the following (italics):
Any upside attempts north of October’s opening value at 1.1730 today are likely to be capped by the H4 trend line support-turned resistance/August’s opening value at 1.1771. The aforementioned zones, therefore, are potentially of interest to sellers.
Intraday bearish breakout strategies may also form in the event of a H4 close printing beneath 1.1730, targeting 1.17 as an initial point.
As evident from the H4 chart, a reaction from the 1.1771 zone has been seen. Should the bearish response lure additional selling, engulfing 1.1730 could be on the horizon.
GBP/USD:
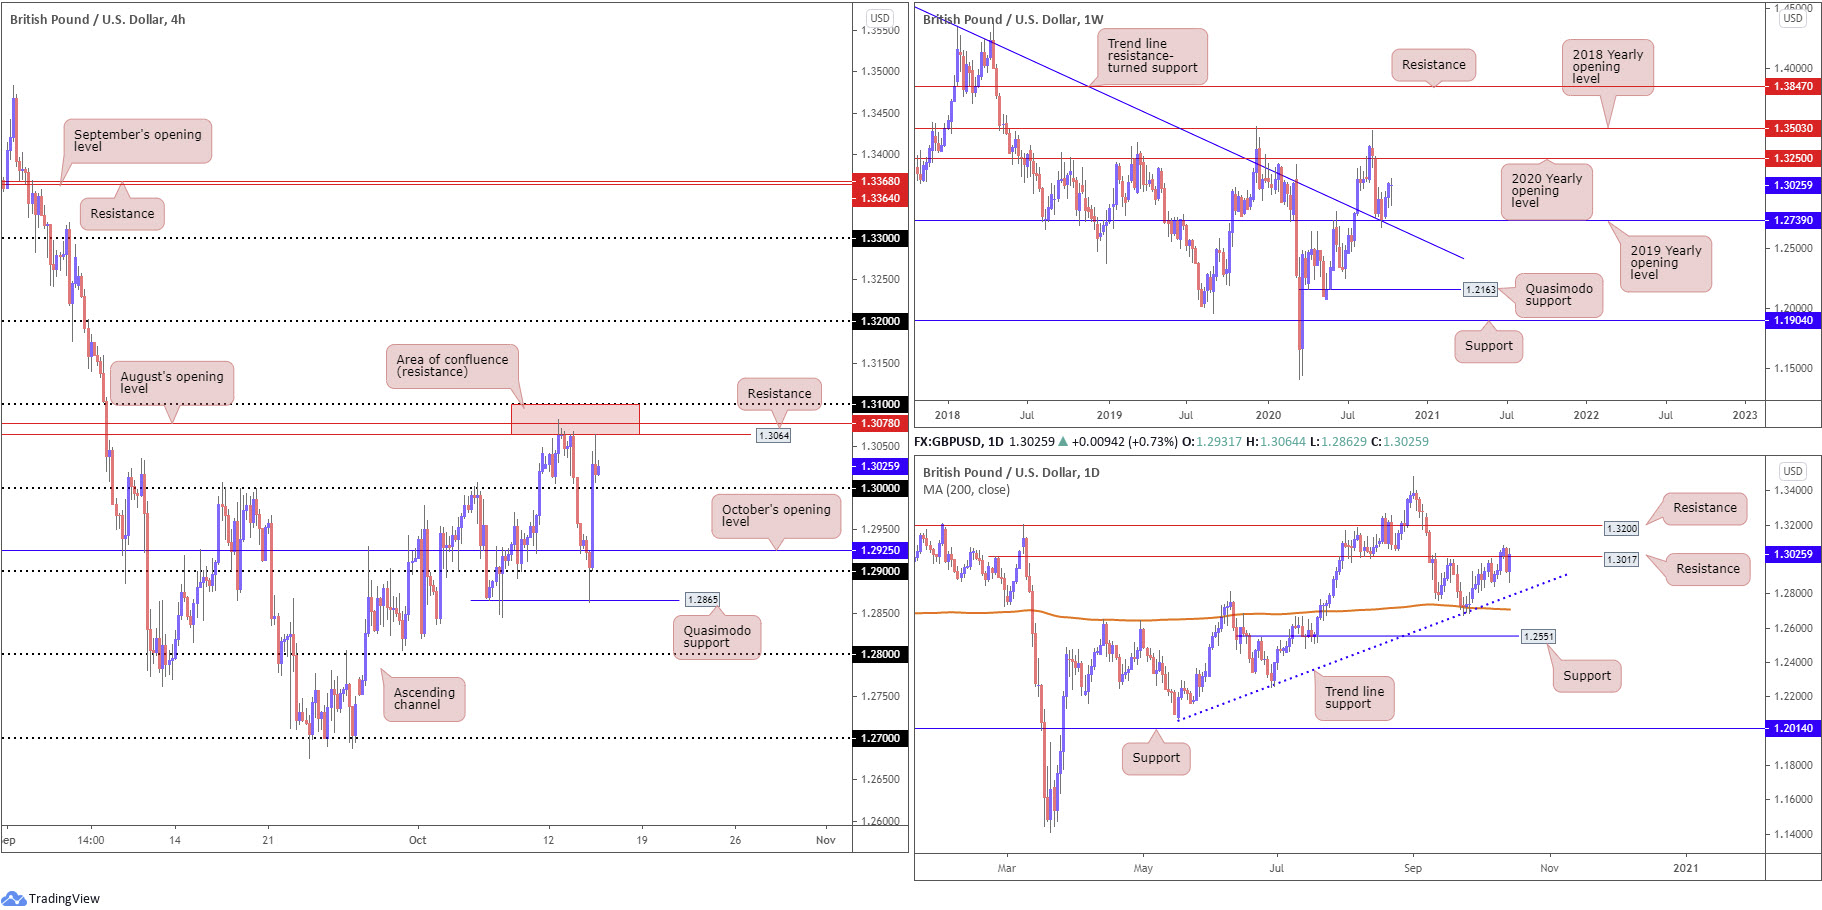
Following a whipsaw through 1.29 (and October’s opening value at 1.2925) on the H4 timeframe that tested Quasimodo support at 1.2865, GBP/USD bulls went on the offensive Wednesday and powered through 1.30 to retest the 1.31/1.3064 resistance zone (red), composed of the 1.31 handle, resistance from 1.3064 and August’s opening value at 1.3078. Beyond this area, bullish players may attempt to approach 1.32.
Meanwhile, on the weekly timeframe, price still reveals room to march higher. Last week observed GBP/USD extend recent recovery gains from support at 1.2739 (a 2019 yearly opening value). Technicians will acknowledge 1.2739 blends with trend line resistance-turned support, extended from the high 1.5930. In terms of resistance, price has room to advance as far north as the 2020 yearly opening value at 1.3250.
From the daily timeframe, however, we are, of course, back at resistance from 1.3017, while a breach could activate additional bullish themes towards resistance at 1.3200.
Areas of consideration:
With the weekly timeframe uncovering space to advance towards 1.3250, 1.30 support on the H4 timeframe could serve as support today and see price take on 1.31/1.3064. From this perspective, bullish scenarios may also be found upon breaking north of 1.31, targeting the 1.32 handle.
AUD/USD:
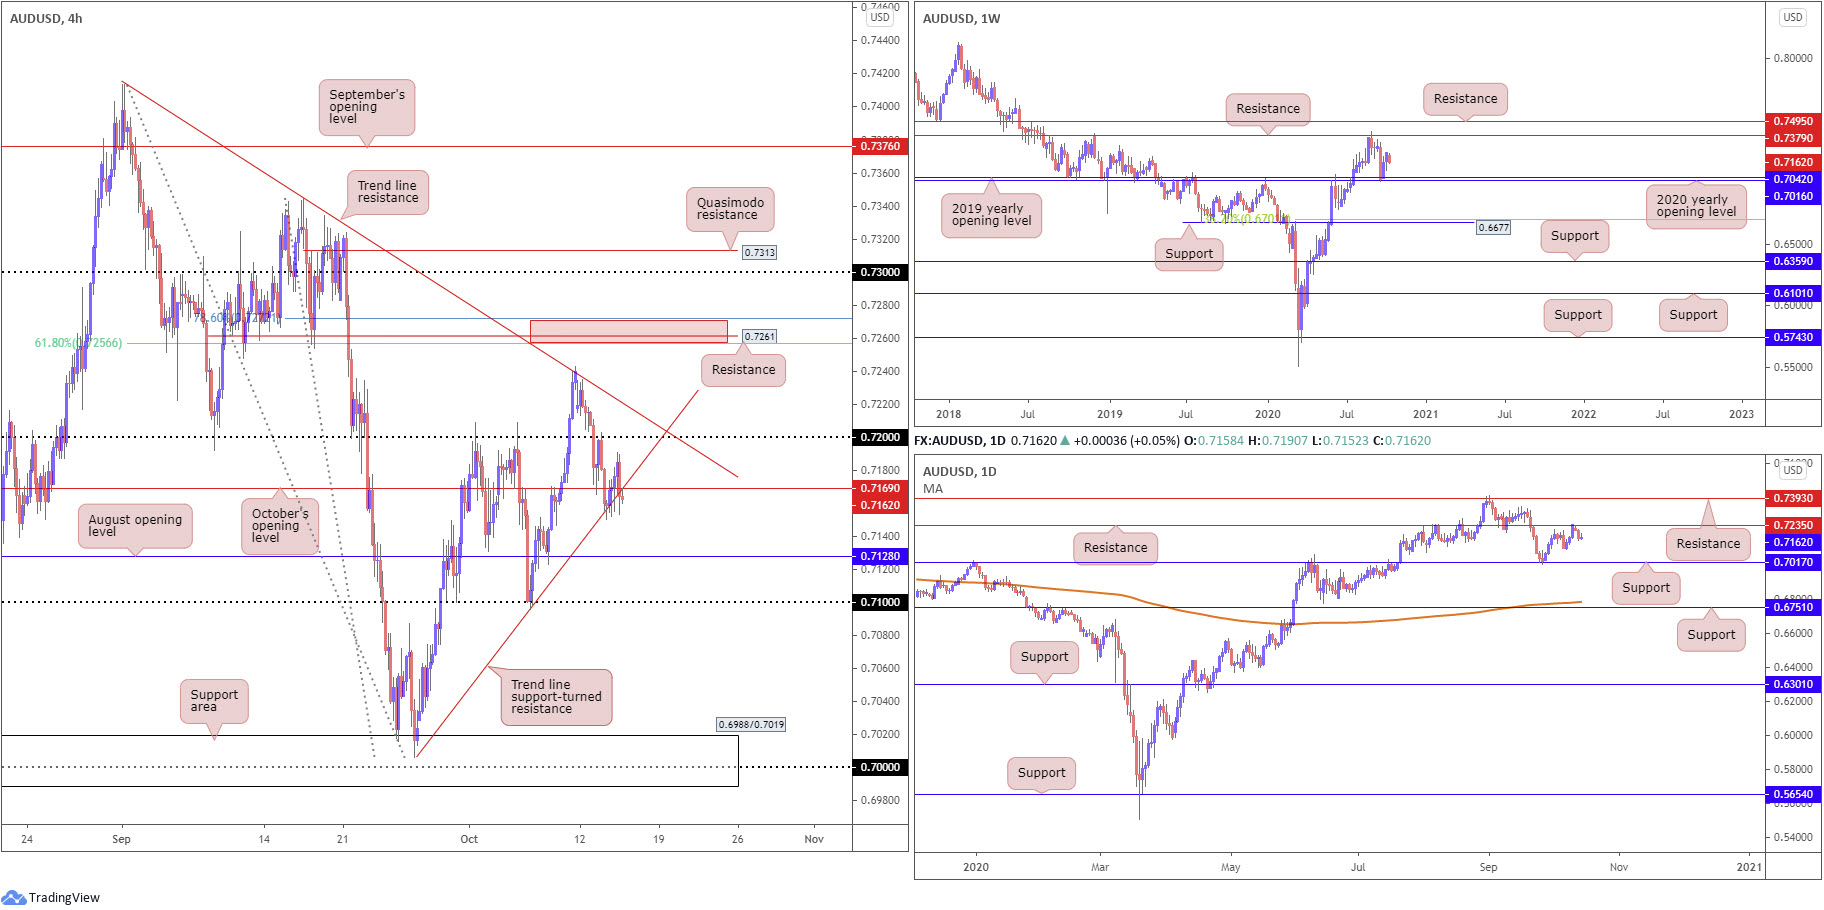
Over the past 24 hours, AUD/USD movement echoed a somewhat subdued tone, finishing Wednesday off session peaks at 0.7190.
H4 crawled back under October’s opening value at 0.7169 (and nearby trend line support, taken from the low 0.7005), threatening further underperformance towards August’s opening value at 0.7128, closely followed by the 0.71 handle.
The bearish tone remains in play below resistance at 0.7235 on the daily timeframe, despite weekly price pointing to the possibility of room to march towards resistance at 0.7379. As a result of recent selling, the 2020 (0.7016) and 2019 (0.7042) yearly opening values, applied to the weekly timeframe, are logged as the next potential higher timeframe support targets.
Areas of consideration:
Outlook mostly unchanged due to Wednesday’s lacklustre response.
A H4 retest at the underside of October’s opening value at 0.7169 (and converging trend line resistance) is a possible scenario today, targeting August’s opening value at 0.7128, as well as the 0.71 handle. Follow-through selling beyond these two levels is also possible until we reach 0.7042 (on the higher timeframes), sited just ahead of a H4 support area at 0.6988/0.7019.
USD/JPY:
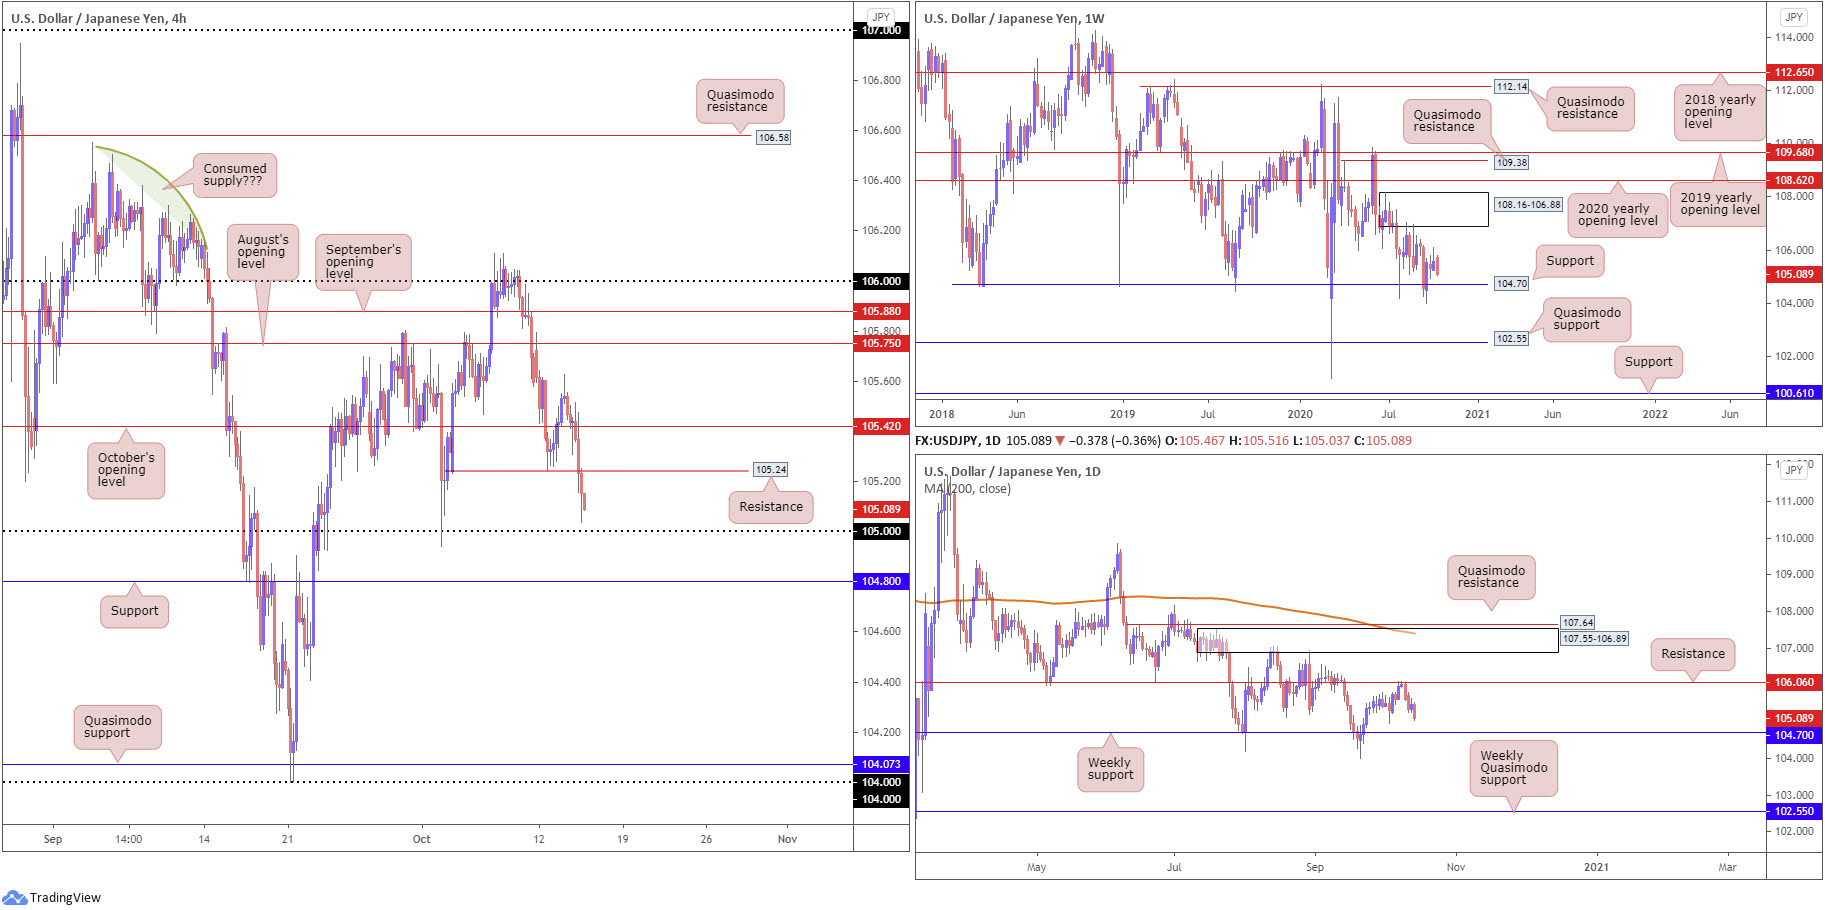
Downbeat risk sentiment persisted Wednesday, reinforcing demand for the safe-haven Japanese yen. This pressured USD/JPY through October’s opening value at 105.42 and H4 support coming in at 105.24 (now a potential resistance) to shine the spotlight on 105. Traders are likely to note that a break south of the round number lands candle action within striking distance of support priced in at 104.80.
Support at 104.70 remains a watched level on the weekly timeframe, particularly after recently welcoming a 1% rebound. Supply at 108.16-106.88 also remains prominent from the weekly chart, capping upside since early August. Quasimodo support at 102.55 offers a feasible target beyond current support in the event we turn south, while removing supply draws the 2020 yearly opening value at 108.62 into the fight.
Daily bears continue to extend south of resistance at 106.06 (a level mostly ignored since serving as support during May and June), positioning the weekly support level mentioned above at 104.70 in the light.
Areas of consideration:
Although H4 buyers may attempt to secure long positions off 105, upside attempts are likely to be dwarfed by higher timeframe pressure seeking weekly support at 104.70.
Consequently, intraday traders are likely to pursue bearish signals until grasping 104.70/80, at which point strong buying may perhaps develop, given weekly support.
USD/CAD:
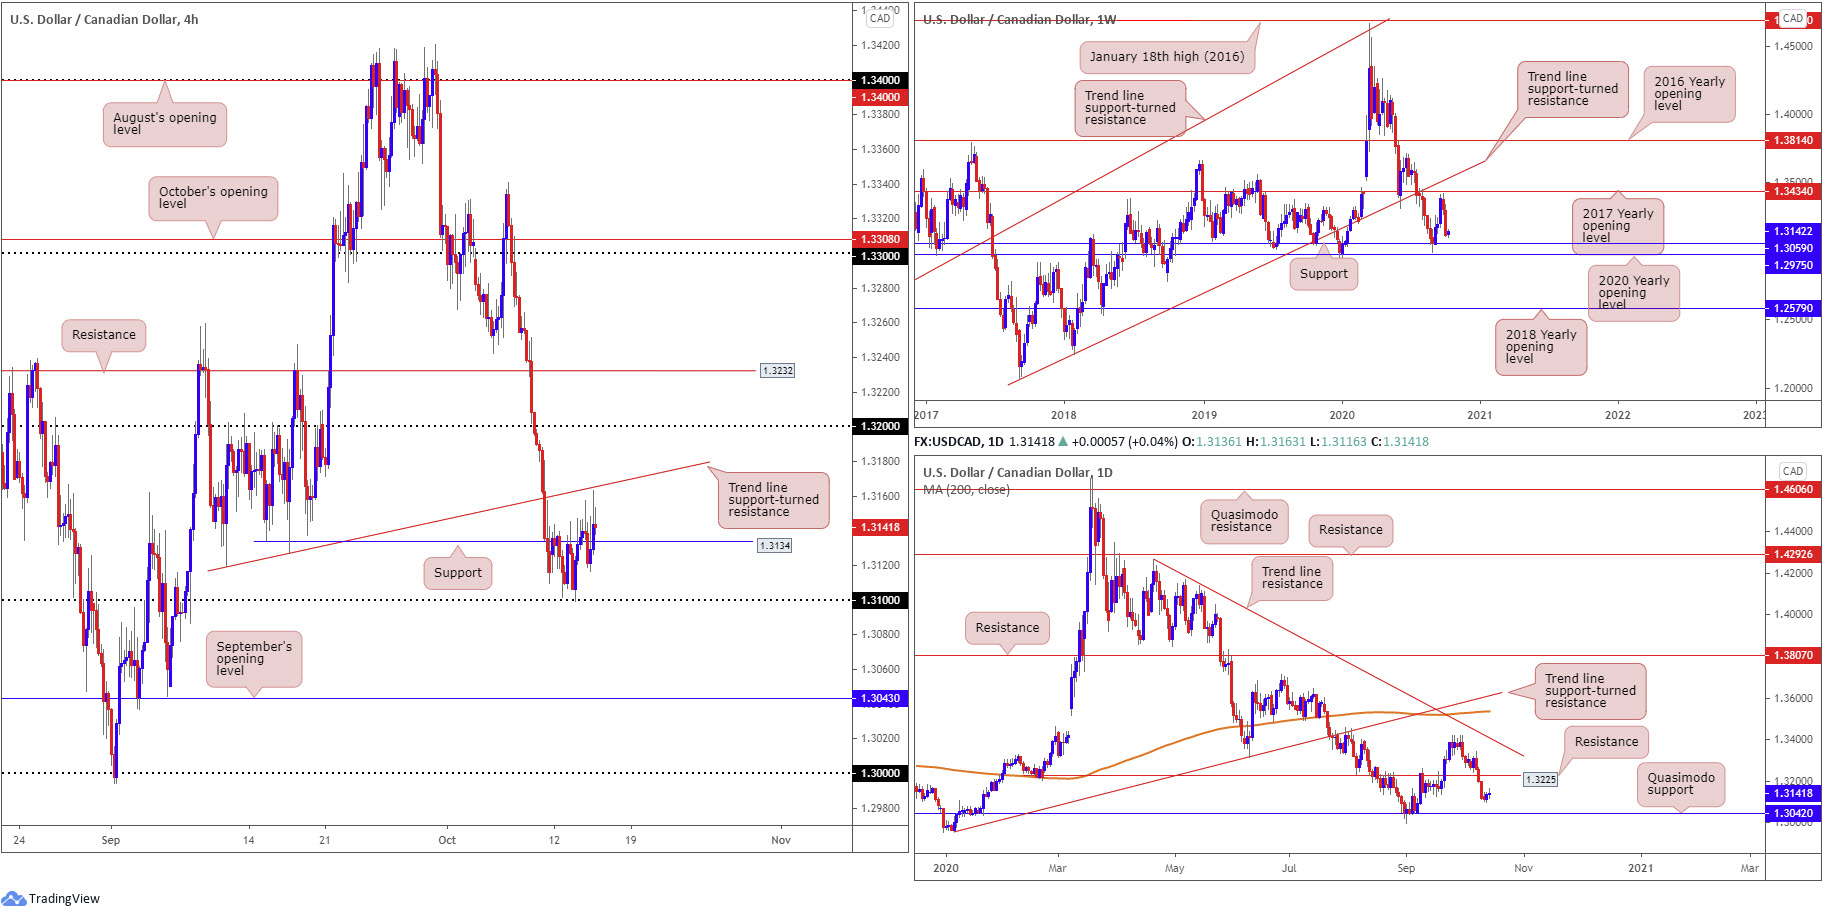
Although scoring fresh weekly pinnacles at 1.3163, USD/CAD prices ended Wednesday’s segment mostly unmoved.
As aired in Wednesday’s technical briefing:
1.31 has proved effective support as buyers made their way above H4 resistance at 1.3134 (now potential support). Continued outperformance suggests we‘re likely to cross swords with trend line support-turned resistance, taken from the low 1.3119.
Technically, though, H4 buyers appear to be treading fragile ground. We can see both the weekly and daily timeframes are absent of support until 1.3059 on the weekly timeframe, closely followed by daily Quasimodo support coming in at 1.3042.
Areas of consideration:
Outlook unchanged.
On account of the bigger picture favouring sellers, H4 buyers may lose interest should we connect with H4 trend line support-turned resistance, taken from the low 1.3119.
Ultimately, 1.3043 (September’s opening value), in addition to weekly support priced in at 1.3059 and the daily Quasimodo support at 1.3042, serves as a robust downside target for short positions. Equally, the area may also appeal to buyers.
USD/CHF:
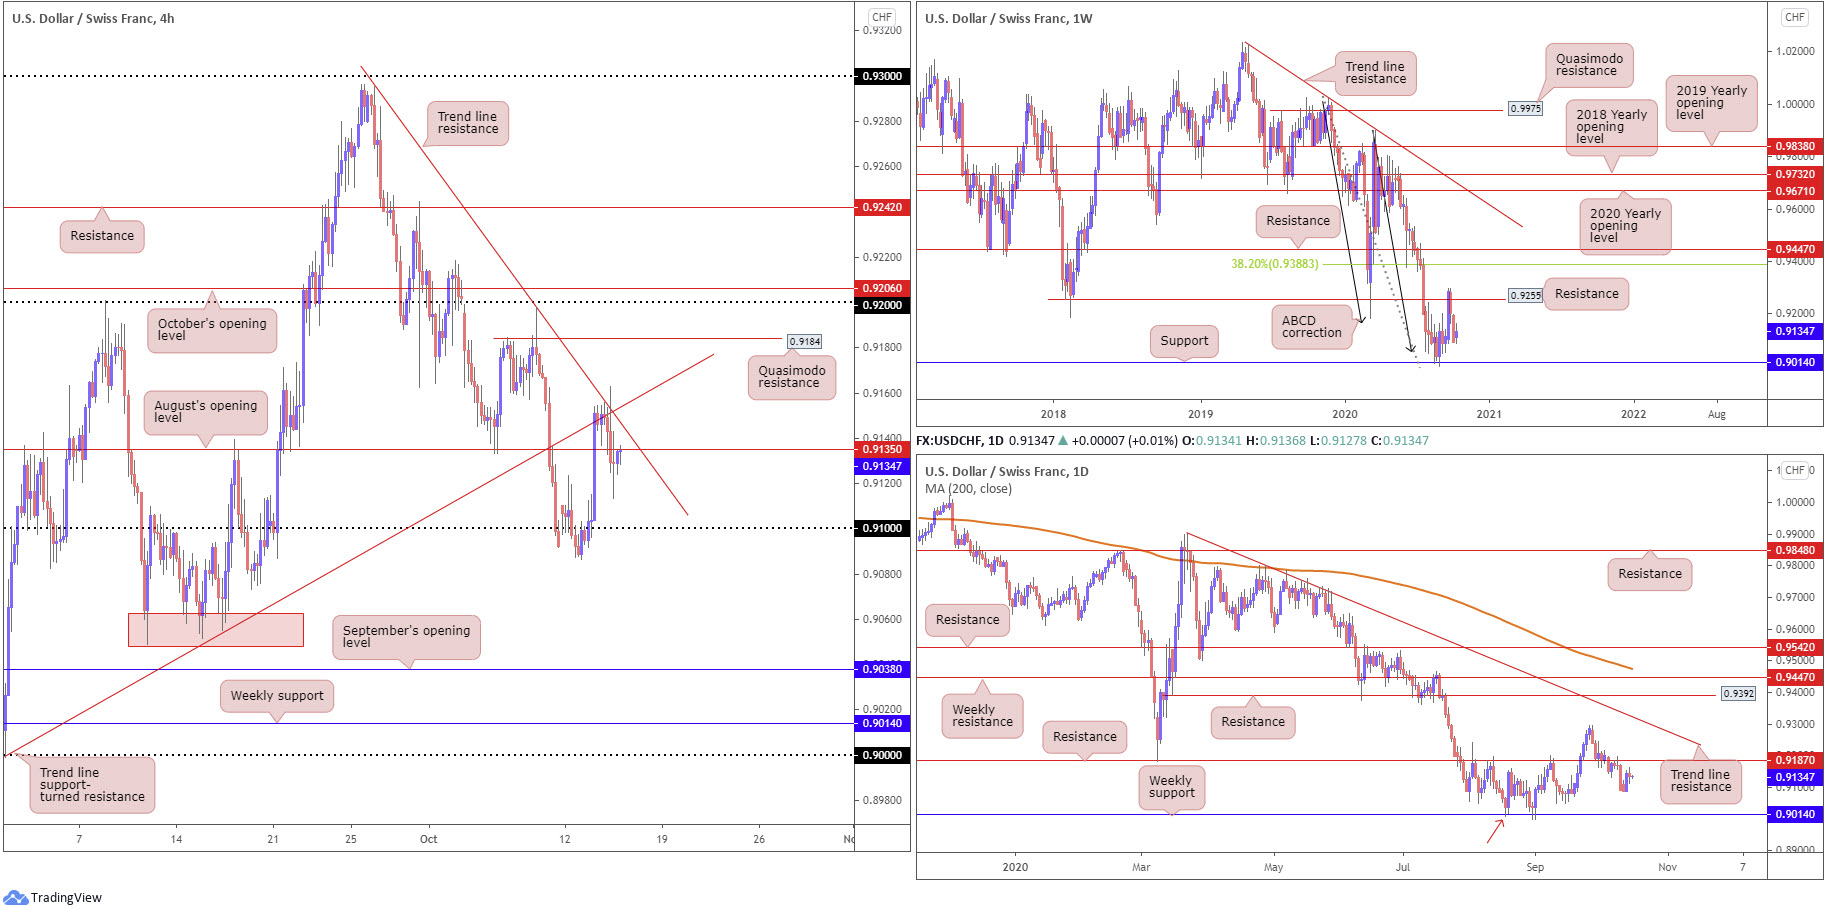
Trend line support-turned resistance, based on the H4 timeframe from the low 0.8998, along with another trend line resistance, extended from the high 0.9295, capped gains in recent movement, manoeuvring the pair back beneath August’s opening value at 0.9135.
Further out on the weekly timeframe we can see heading into the closing stages of September price retested resistance at 0.9255 (a previous Quasimodo support level) and recently saw price establish two back-to-back near-full-bodied bearish candles. As a result, support at 0.9014, as well as ABCD support at 0.9051 (black arrows), is turf that may be retested. It is also worth noting USD/CHF has traded lower since topping in April 2019.
A closer reading of price action on the daily timeframe reveals the unit is stationed within striking distance of resistance from 0.9187. What’s also interesting is weekly support at 0.9014 on the daily chart represents a Quasimodo support (red arrow).
Areas of consideration:
H4 holding a 0.9135 retest today (August’s opening value) advertises a possible retreat to the 0.91 handle. Sub 0.91, traders’ crosshairs are likely fixed on the H4 support area (red) around 0.9060 and September’s opening value at 0.9038. Downside movement below 0.91 is also in line with both weekly and daily charts showing room to discover deeper terrain.
Dow Jones Industrial Average:
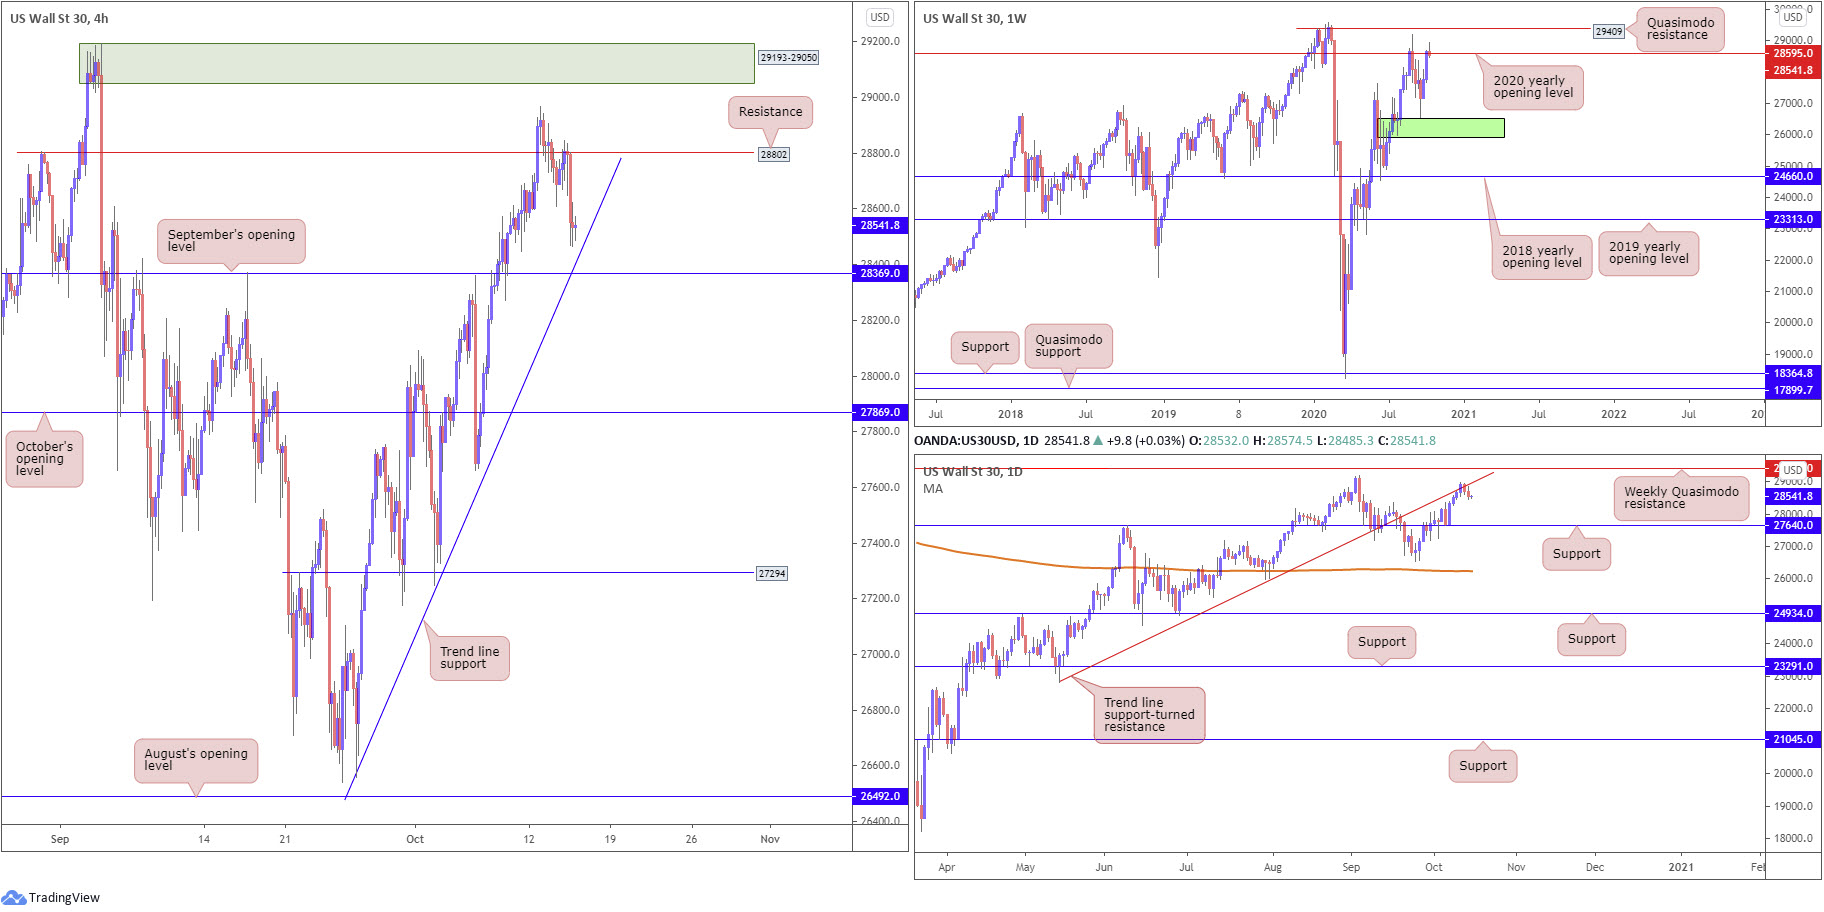
Major US equity benchmarks finished lower for a second straight day on Wednesday amid concerns surrounding a fiscal stimulus deal. The Dow Jones Industrial Average dropped 165.81 points, or 0.58%; the S&P 500 dipped 23.26 points, or 0.66% and the Nasdaq traded lower by 95.17 points, or 0.80%.
- The recent two-day slide side-lines hopes of reaching weekly Quasimodo resistance at 29409, and has positioned the current weekly candle back under the 2020 yearly opening value at 28595.
- The daily trend line support-turned resistance, extended from the low 22803, has so far done a good job of containing upside. Follow-through selling has support at 27640 to target.
- Wednesday witnessed the H4 candles retest the under base of resistance at 28802 and close within touching distance of a steep trend line support, extended from the low 26638, which happens to merge closely with September’s opening value at 28369.
Areas of consideration:
A reaction from September’s opening value at 28369 could emerge, having noted H4 trend line confluence. However, a break to lower levels is not out of the question, particularly as we’re coming from a daily trend line resistance and recently elbowed back under weekly resistance. Assuming sellers take on 28369, October’s opening value at 27869 offers a possible target.
XAU/USD (GOLD):
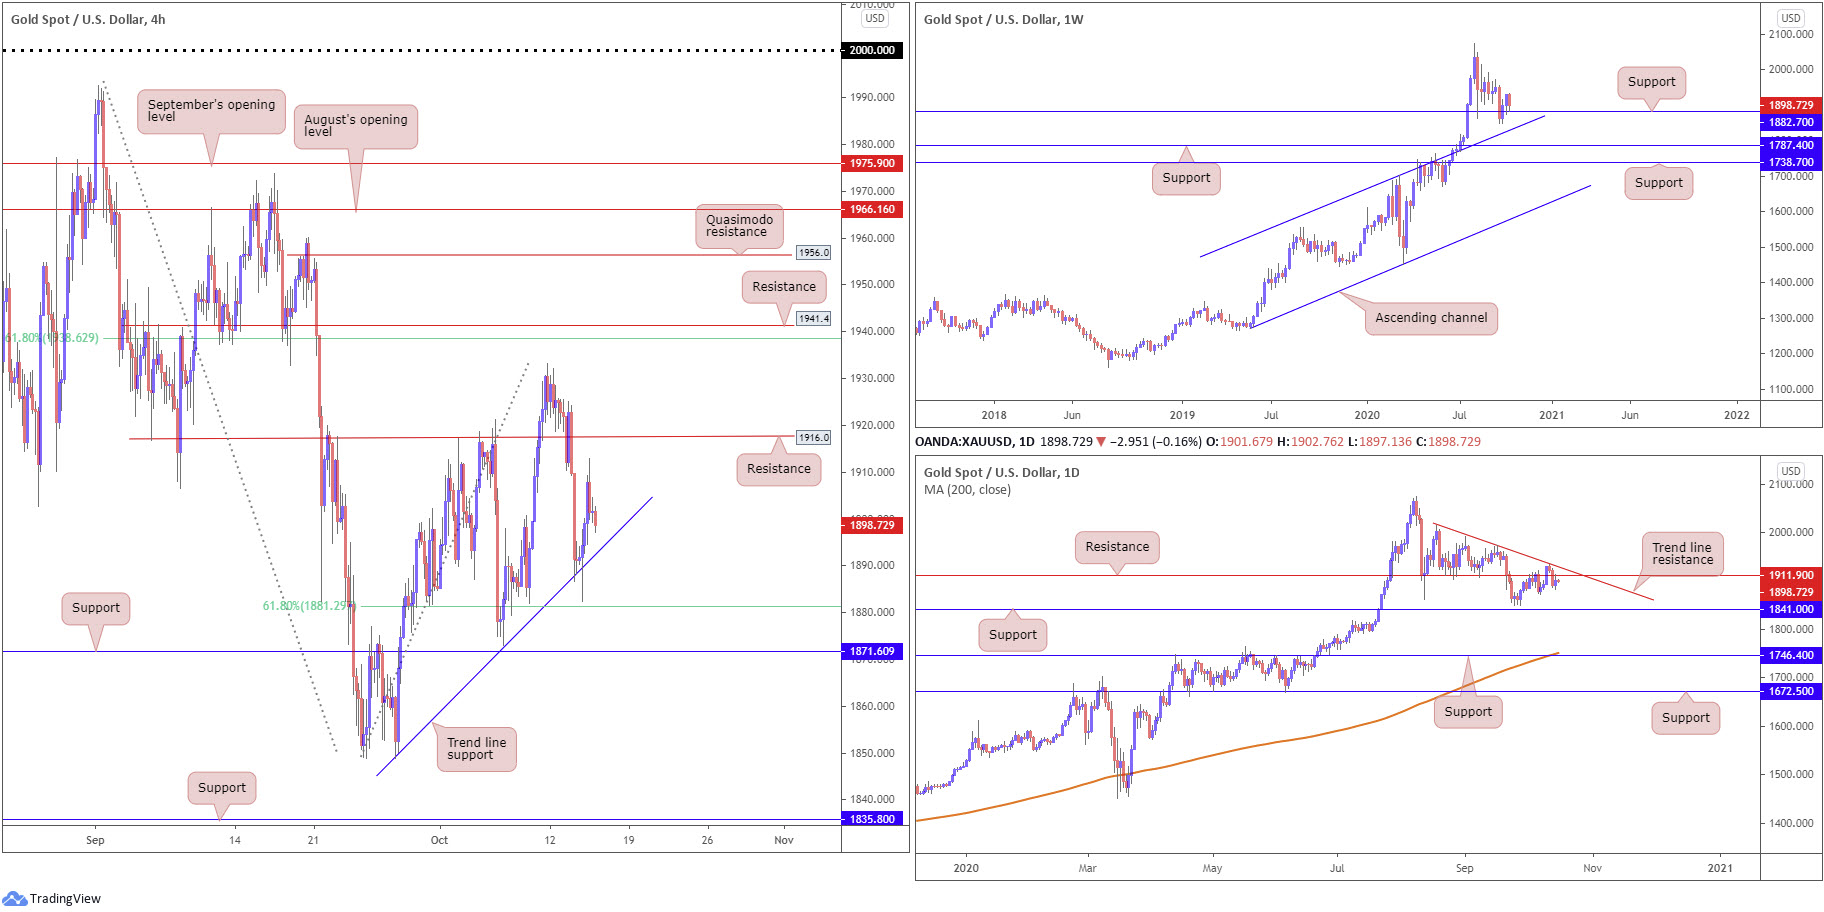
Spot gold pencilled in a mild comeback against a softer US dollar Wednesday, responding from weekly support priced in at $1,882 (positioned above channel resistance-turned support, taken from the high $1,703). Additional support was found by way of a H4 trend line formation, extended from the low $1,848, and a nearby 61.8% Fibonacci retracement ratio at $1,881.
On the other side of the field, however, we can still see daily price fading resistance at $1,911, a level fusing closely with a trend line resistance, taken from the high $2,015. Further selling from this region could take the precious metal as far south as support at $1,841.
Areas of consideration:
With the trend on gold higher since 2016, and the weekly (as well as H4) timeframe showing active support at $1,882, traders likely believe that buyers have a strong hand in this fight.
With the above taken into account, in the event we retest the current H4 trend line support, bullish scenarios could develop. A H4 close back above H4 resistance at $1,916 could also be in the offing, targeting H4 resistance at $1,941 (merges nearby a 61.8% Fibonacci retracement ratio at 1,938), though this would involve overthrowing daily resistances.
The accuracy, completeness and timeliness of the information contained on this site cannot be guaranteed. IC Markets does not warranty, guarantee or make any representations, or assume any liability regarding financial results based on the use of the information in the site.
News, views, opinions, recommendations and other information obtained from sources outside of www.icmarkets.com.au, used in this site are believed to be reliable, but we cannot guarantee their accuracy or completeness. All such information is subject to change at any time without notice. IC Markets assumes no responsibility for the content of any linked site.
The fact that such links may exist does not indicate approval or endorsement of any material contained on any linked site. IC Markets is not liable for any harm caused by the transmission, through accessing the services or information on this site, of a computer virus, or other computer code or programming device that might be used to access, delete, damage, disable, disrupt or otherwise impede in any manner, the operation of the site or of any user’s software, hardware, data or property.


