
DXY:
The DXY (US Dollar Index) chart currently shows a bearish momentum, indicating a downward trend in price.
Several factors contribute to this momentum. Firstly, the price is below a major descending trend line, suggesting that bearish momentum is likely to continue. Additionally, the price is below the bearish Ichimoku cloud, further reinforcing the bearish sentiment.
There is a potential for a bearish reaction off the first resistance level at 103.32, which is an area of overlap resistance. This level may act as a point of resistance where sellers could potentially enter the market.
On the downside, the first support level at 103.02 can be considered as a level of support. It is a pullback support level, indicating a potential area where buyers could step in.
The second support level at 102.71 is an additional area of support, representing an overlap support level.

EUR/USD:
The EUR/USD chart currently shows a bullish momentum, indicating an upward trend in price.
Several factors contribute to this momentum. Firstly, the price is above a major ascending trend line, suggesting the potential for further bullish momentum. Additionally, the price is above the bullish Ichimoku cloud, further reinforcing the bullish sentiment.
In the short term, there is a possibility for the price to drop further towards the first support level at 1.0783 before potentially bouncing back and rising towards the first resistance at 1.0829.
The first support level at 1.0783 is significant as it represents an area of overlap support. It is a level where buyers may step in to support the price.
The second support level at 1.0734 is another area of support, representing an overlap support level.
On the upside, the first resistance level at 1.0829 acts as a pullback resistance, potentially causing the price to face selling pressure.
Similarly, the second resistance level at 1.0861 is a swing high resistance, which further reinforces the potential for price reversal or a stall in upward movement.
GBP/USD:
The GBP/USD chart currently exhibits a bullish momentum, indicating an upward trend in price.
One of the contributing factors to this momentum is that the price is above the bullish Ichimoku cloud. This suggests a positive sentiment and potential for further upward movement.
In the short term, there is a possibility for the price to drop further towards the first support level at 1.2588 before potentially bouncing back and rising towards the first resistance at 1.2676.
The first support level at 1.2588 is significant as it represents an area of overlap support and coincides with the 50% Fibonacci retracement level. Traders may consider this level as a potential area of support where buyers may step in.
The second support level at 1.2543 is a pullback support level, providing additional support to the price.
On the upside, the first resistance level at 1.2676 acts as a pullback resistance, potentially causing the price to face selling pressure.
The second resistance level at 1.2738 represents the 100% Fibonacci projection, further reinforcing its significance as a potential level where the price might encounter resistance.

USD/CHF:
The USD/CHF chart currently shows a bullish momentum, indicating an upward bias in price movement.
There is a potential for a bullish continuation towards the first resistance level at 0.9117. This resistance level is significant as it represents an area of overlap resistance where the price has previously encountered selling pressure.
The second resistance level at 0.9150 is a swing high resistance, further reinforcing its significance as a potential barrier to upward movement.
On the downside, the first support level at 0.8966 acts as a swing low support. Traders may consider this level as a potential area of support where buyers may enter the market.
Additionally, there is an intermediate resistance level at 0.9028, which represents a Fibonacci confluence of the 50% Fibonacci retracement and the 61.80% Fibonacci projection. This level may act as a temporary barrier to further upward movement.

USD/JPY:
The USD/JPY chart currently shows a bullish momentum, indicating an upward bias in price movement.
There is a potential for a bullish break through the first resistance level at 140.23. This resistance level is significant as it represents a multi-swing high resistance, suggesting that a break above this level could lead to further upward movement.
The second resistance level at 142.11 is a swing high resistance, further reinforcing its significance as a potential barrier to upward movement.
On the downside, the first support level at 140.23 acts as a pullback support. Traders may consider this level as a potential area of support where buyers may enter the market.
Additionally, there is a second support level at 138.79, which represents an overlap support level. This level may provide additional support if the price experiences a retracement.

USD/CAD:
The USD/CAD chart currently exhibits a bullish momentum, indicating an upward trend in price movement.
There is a potential for a bullish continuation towards the first resistance level at 1.3411. This resistance level is significant as it coincides with an overlap resistance and the 38.20% Fibonacci retracement, suggesting that it could act as a barrier to further upward movement.
The second resistance level at 1.3448 represents the 50% Fibonacci retracement. This level may also provide resistance to the bullish momentum.
On the downside, the first support level at 1.3323 acts as a pullback support, indicating a potential area where buyers may step in to support the price.
Additionally, there is a second support level at 1.3275, which represents an overlap support level. This level may provide additional support if the price experiences a retracement.

AUD/USD:
The AUD/USD chart currently shows a bearish momentum, indicating a downward trend in price movement.
There is a potential for a bearish continuation towards the first support level at 0.6721. This support level is significant as it acts as a pullback support, suggesting that buyers may step in to provide some temporary support to the price.
The second support level at 0.6692 represents an overlap support level. It adds further significance to the potential support zone and may attract buying interest.
On the upside, the first resistance level at 0.6811 is an overlap resistance level. It may act as a barrier to any upward movement and provide selling pressure.
Additionally, the second resistance level at 0.6873 represents a pullback resistance and coincides with the 38.20% Fibonacci retracement. This level may reinforce the bearish momentum and could attract sellers into the market.

NZD/USD
The NZD/USD chart currently shows a bearish momentum, indicating a downward trend in price movement.
There is a potential for a bearish continuation towards the first support level at 0.6108. This support level is significant as it represents a pullback support and coincides with the 61.80% Fibonacci retracement level. It suggests that buyers may step in and provide temporary support at this level.
The second support level at 0.6307 represents a swing low support, further reinforcing its importance as a potential level for price to find support.
On the upside, the first resistance level at 0.6232 is an overlap resistance level. It may act as a barrier to any upward movement and provide selling pressure.
Additionally, the second resistance level at 0.6266 represents a pullback resistance. It suggests that sellers may become more active at this level, potentially limiting the bullish momentum.

DJ30:
The DJ30 (Dow Jones Industrial Average) chart currently exhibits a bearish momentum, indicating a downward trend in price movement.
There is a potential for a bearish continuation towards the first support level at 33880.40. This support level is significant as it represents an overlap support and coincides with the 50% Fibonacci retracement level. It suggests that buyers may step in and provide temporary support at this level.
The second support level at 33733.84 is also an overlap support and represents a confluence of the 61.80% and 38.20% Fibonacci retracement levels. This further reinforces its importance as a potential level for price to find support.
On the upside, the first resistance level at 34166.57 is a pullback resistance. It may act as a barrier to any upward movement and provide selling pressure.
Additionally, the second resistance level at 34352.44 represents a swing high resistance. It suggests that sellers may become more active at this level, potentially limiting the bullish momentum.

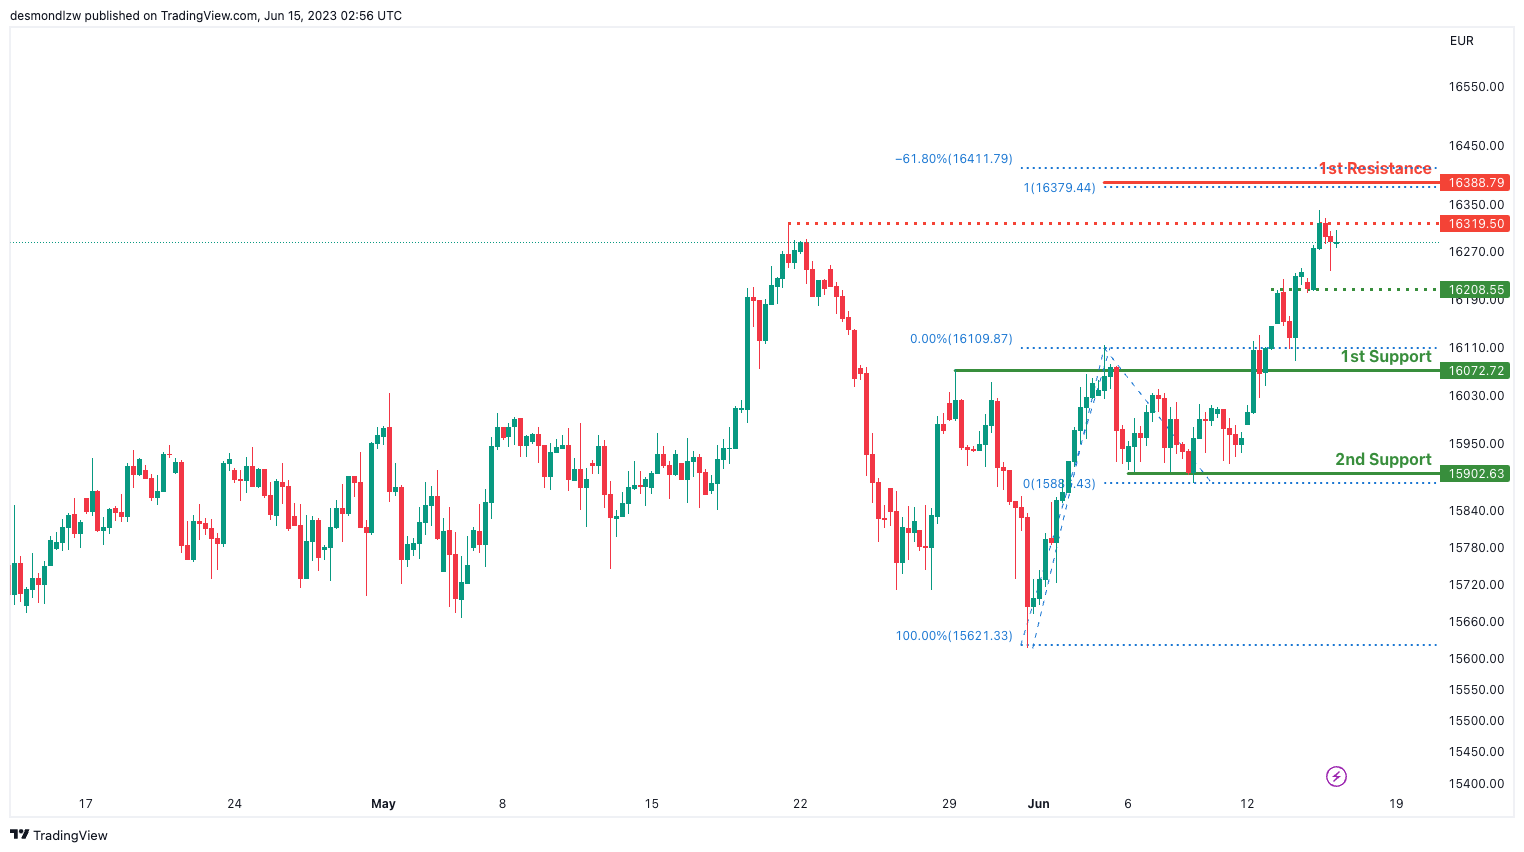
GER30:
The GER30 chart currently exhibits a bullish momentum, indicating an upward trend in price movement.
There is a potential for a bullish continuation towards the first resistance level at 16388.79. This resistance level is significant as it represents a swing high and is further reinforced by the presence of Fibonacci expansions at -61.8% and 100%.
In case of a pullback, the first support level at 16072.72 can provide an area of support. This support level is considered an overlap support, adding to its significance.
Additionally, there is an intermediate resistance level at 34352.44, which acts as a swing high resistance.
Similarly, an intermediate support level at 16208.55 is identified as an overlap support, potentially providing temporary support during minor price retracements.
US500
The US500 (S&P 500) chart currently exhibits a bullish momentum, indicating an overall positive bias in price movement. This is supported by the fact that the price is above a major ascending trend line, suggesting the potential for further bullish momentum.
In the short term, there is a possibility of a further drop towards the first support level at 4326.9. This support level is significant as it coincides with a 23.60% Fibonacci retracement, making it a strong area of support to watch. From there, a potential bounce may occur, leading to a rise towards the first resistance level at 4386.6. This resistance level is an overlap resistance, indicating a potential area where selling pressure could be encountered.
If the bullish momentum continues, the price may encounter the second support level at 4298.6, which aligns with a 38.20% Fibonacci retracement. Conversely, if bearish pressure intensifies, the price may struggle to break above the first resistance level and experience a deeper pullback.

BTC/USD:
The BTC/USD chart currently exhibits a bearish momentum, as the price is below a major descending trend line, suggesting a potential continuation of the bearish trend.
There is a possibility for the price to make a bearish break off the first support level at 25,252 and drop towards the second support level at 24,451.
The first support level at 25,252 is considered a pullback support, indicating a potential area where buyers might step in. If the price breaks below this level, it could indicate further downward movement towards the second support level at 24,451.
On the upside, the first resistance level at 25,607 acts as a pullback resistance, potentially causing selling pressure and hindering upward movement. The second resistance level at 26,105 is an overlap resistance, adding to its significance as a potential barrier for price advancement.

ETH/USD:
The ETH/USD chart currently shows a bearish momentum, with the price below a major descending trend line, indicating a potential continuation of the bearish trend.
There is a possibility for the price to make a bearish break off the first support level at 1,683.88 and drop towards the second support level at 1,605.41.
The first support level at 1,683.88 is considered a pullback support, suggesting a potential area where buyers might enter the market. However, if the price breaks below this level, it could indicate further downward movement towards the second support level at 1,605.41.
On the upside, the first resistance level at 1,722.00 acts as a pullback resistance, potentially causing selling pressure and impeding upward movement. The second resistance level at 1,760.95 is an overlap resistance, adding to its significance as a potential barrier for price advancement.

WTI/USD:
The WTI (West Texas Intermediate) chart currently exhibits a bearish momentum, indicating a downward trend in price.
There is a potential for a bearish continuation towards the first support level at 67.51, which is a multi-swing low support level. This level has previously acted as a support level where price found temporary stability. In case of a further decline, the second support level at 64.78, also a multi-swing low support, may come into play.
On the upside, the first resistance level at 70.66 acts as an overlap resistance, potentially causing selling pressure and hindering upward movement. Additionally, the second resistance level at 74.24 is also an overlap resistance level, reinforcing its significance as a potential barrier for price advancement.

XAU/USD (GOLD):
The XAU/USD (Gold/USD) chart currently shows a bearish momentum, indicating a downward trend in price. This is supported by the fact that the price is below a major descending trend line, suggesting the presence of bearish momentum.
There is a potential for a short-term rise towards the first resistance level at 1966.26. This resistance level is significant as it has previously acted as a swing high resistance, where price faced selling pressure.
If the bullish momentum persists, the second resistance level at 1980.08, an overlap resistance, may come into play. This level could potentially provide a stronger barrier for further upward movement.
On the downside, the first support level at 1933.95 is an overlap support, indicating a potential area where buyers could provide support and prevent further decline. If the bearish momentum continues, the second support level at 1914.16, also an overlap support, may be tested.

The accuracy, completeness and timeliness of the information contained on this site cannot be guaranteed. IC Markets does not warranty, guarantee or make any representations, or assume any liability regarding financial results based on the use of the information in the site.
News, views, opinions, recommendations and other information obtained from sources outside of www.icmarkets.com, used in this site are believed to be reliable, but we cannot guarantee their accuracy or completeness. All such information is subject to change at any time without notice. IC Markets assumes no responsibility for the content of any linked site.
The fact that such links may exist does not indicate approval or endorsement of any material contained on any linked site. IC Markets is not liable for any harm caused by the transmission, through accessing the services or information on this site, of a computer virus, or other computer code or programming device that might be used to access, delete, damage, disable, disrupt or otherwise impede in any manner, the operation of the site or of any user’s software, hardware, data or property.


