
EUR/USD:
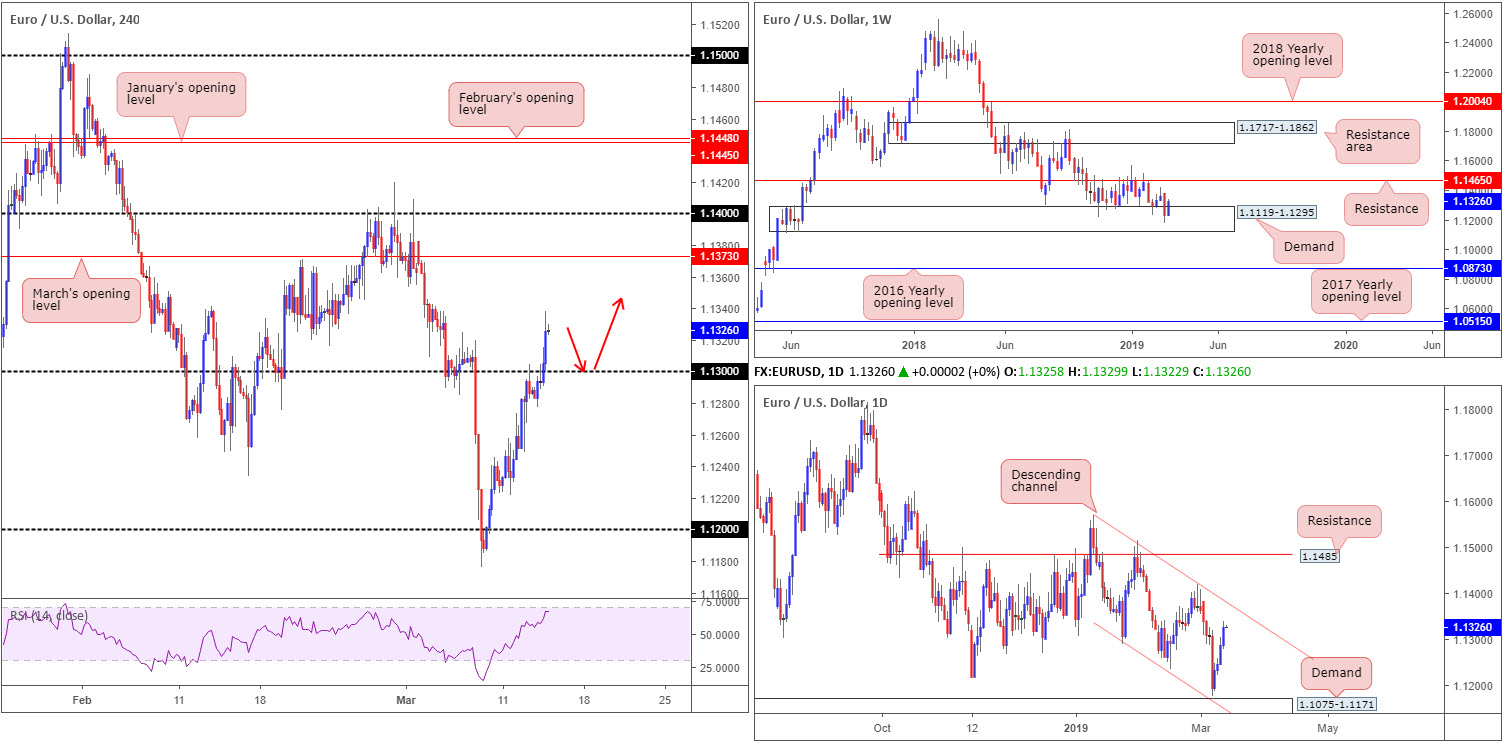
Benefiting from a waning US dollar and an advancing pound, the EUR/USD chalked up its fourth consecutive gain Wednesday. Overthrowing the 1.13 handle in strong fashion on the H4 timeframe, the research team sees little in the way of resistance until reaching March’s opening level at 1.1373 as we head into Thursday’s session. Before this occurs, though, traders may want to pencil in a possible retest of 1.13 as support. It might also be worth noting the RSI indicator is seen nearing its overbought value.
On a wider perspective, weekly price is seen staging a modest recovery out of demand coming in at 1.1119-1.1295, eclipsing a large portion of the prior week’s losses. Further buying from this point has resistance at 1.1465 to target. A closer reading on the daily timeframe shows the unit closing in on channel resistance (etched from the high 1.1569). This channel has been in motion since the beginning of this year.
Areas of consideration:
Having seen weekly buyers make a stand within the walls of demand and daily price display room to press as far north as its channel resistance, March’s opening level on the H4 timeframe at 1.1373 is in view.
On account of the above reading, traders are urged to keep eyeballs on 1.13 today for a possible retest play (red arrows). Aside from a supporting higher-timeframe picture, though, limited confluence is visible on the H4 timeframe. Therefore, it might be best to wait and see how H4 action behaves before pulling the trigger for a long. A bullish candlestick signal, for example, not only identifies buyer intent, it also provides traders entry and risk levels to work with.
Today’s data points: Limited.
GBP/USD:
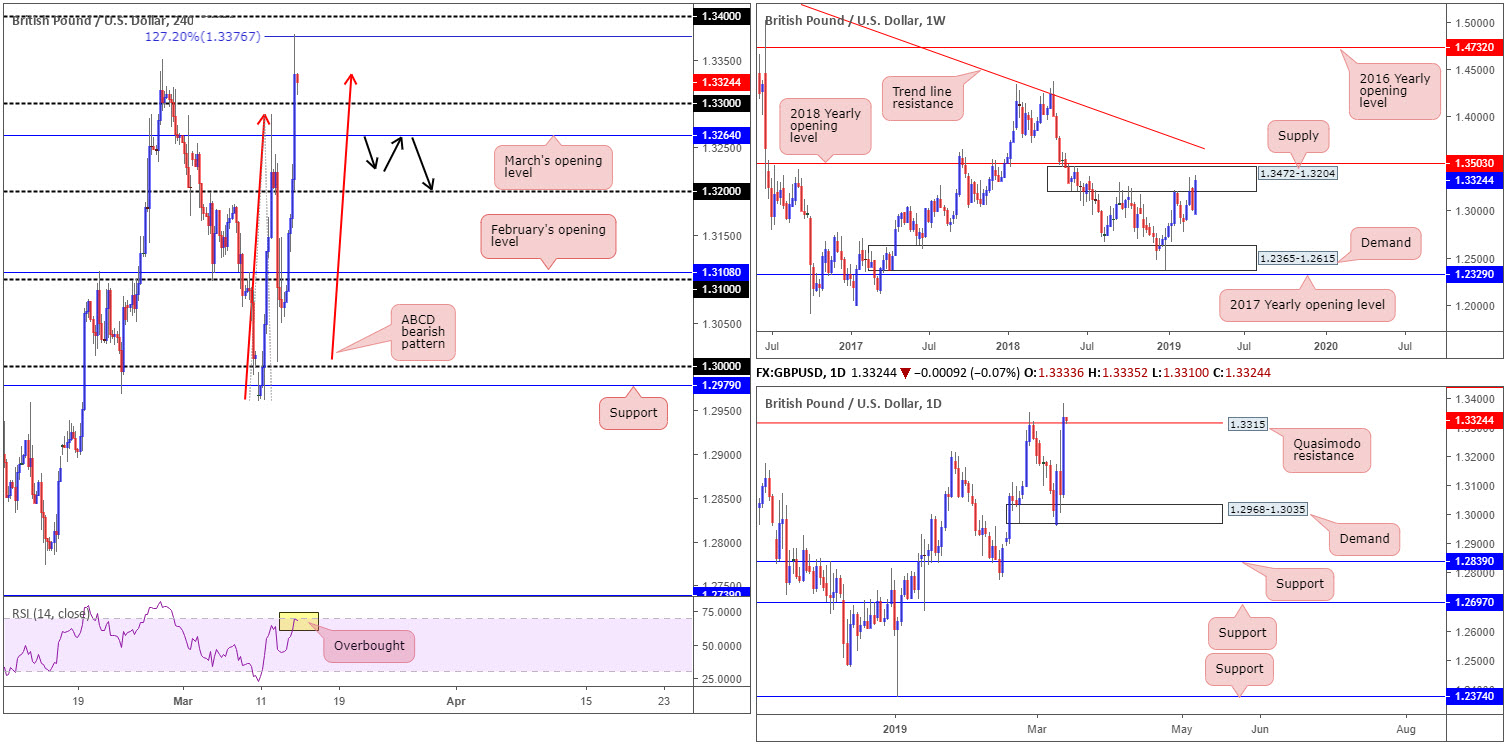
MPs rejected the United Kingdom leaving the European Union without a Brexit deal in any circumstances Wednesday as Parliament took control of Britain’s divorce from the bloc. This sent the British pound higher against its US counterpart, clearing the 1.33 handle on the H4 timeframe and testing highs of 1.3379. Note recent movement finalised the D-leg of an ABCD 127.2% bearish pattern at 1.3376. So far the completion of this pattern has held back GBP bulls and a retest of 1.33 is likely on the cards early Asia. Another point worth noting on the H4 timeframe is the RSI indicator seen testing its overbought value.
Daily movement is seen testing the waters above a Quasimodo resistance level at 1.3315. This, although not visible on the screen, exposes possible resistance around the 1.3465ish neighbourhood. Traders may also want to acknowledge both daily levels are fixed within weekly supply coming in at 1.3472-1.3204. Note beyond this weekly zone we have the 2018 yearly opening level lurking nearby at 1.3503.
Areas of consideration:
We have possible selling entering the fold off the recently formed H4 ABCD pattern at 1.3376 (confirmed with RSI testing its overbought value), and we also have potential selling from weekly supply at 1.3472-1.3204 to contend with. This, despite recent buying, makes the GBP/USD market a challenging long.
In regards to selling, below March’s opening level on the H4 timeframe at 1.3264 is an option, targeting the 1.32 handle. Beyond 1.32, a reasonably clear run to 1.31 is visible. For traders wanting a little more confirmation, waiting for a retest to form following the break of 1.3264 is certainly something to consider (black arrows).
Today’s data points: Votes on an extension to the Brexit timeframe.
AUD/USD:
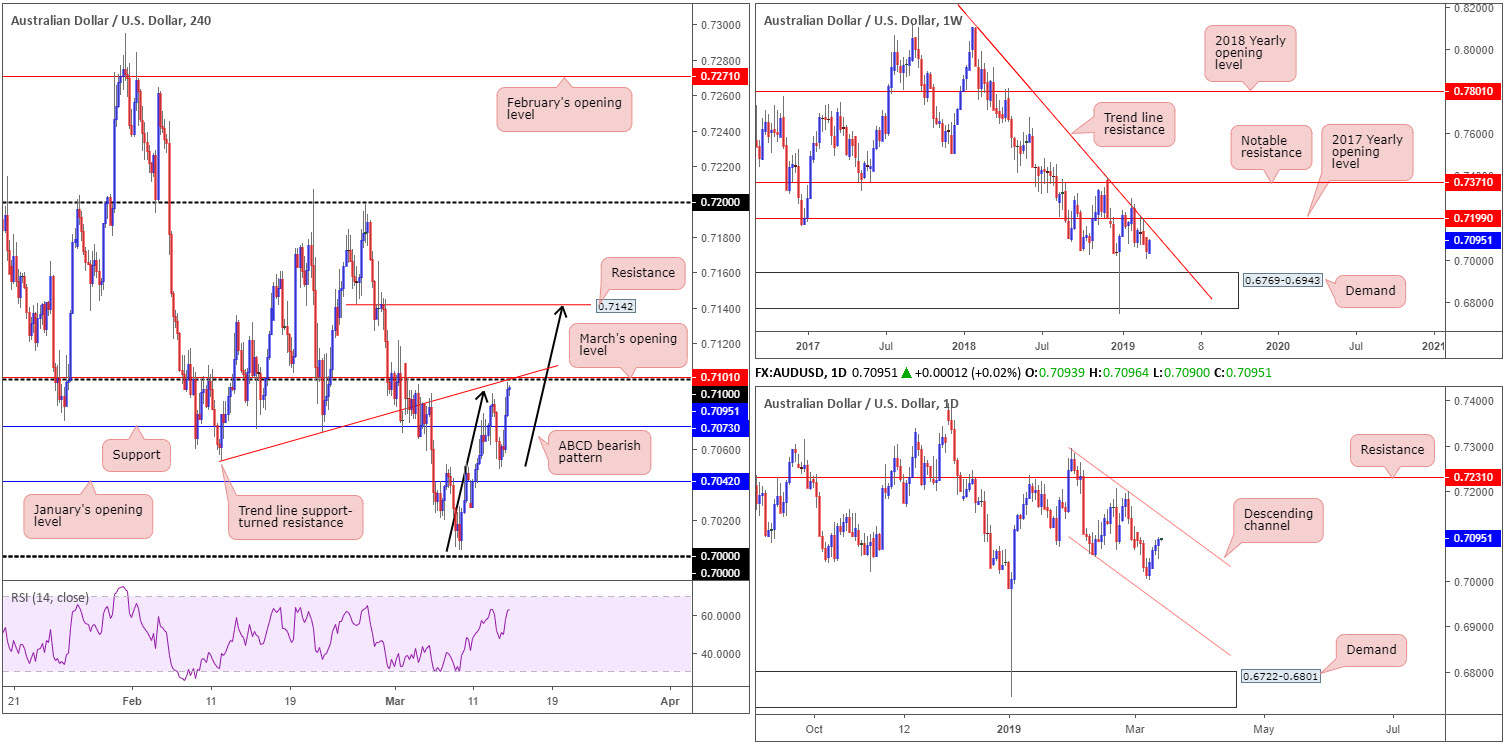
Bolstered by a declining US dollar, the commodity currency rallied for a fourth consecutive session Wednesday. This, as is evident on the H4 timeframe, positioned the candles within striking distance of the 0.71 handle, followed closely by March’s opening level at 0.7101 (merges with a trend line support-turned resistance [extended from the low 0.7054]). A rejection from 0.71 today will likely find it difficult breaking H4 support at 0.7073. A break of 0.71 to the upside, nonetheless, has resistance at 0.7142 in sight. In addition to this, it might also be worth considering the possibility of an ABCD bearish pattern (black arrows) that completes around H4 resistance mentioned above at 0.7142.
Daily action remains compressing within a descending channel (0.7295/0.7060), while weekly flow is still visibly seen reflecting a bearish stance underneath its 2017 yearly opening level at 0.7199 and merging trend line resistance (extended from the high 0.8135).
Areas of consideration:
H4 action is likely to see some form of rejection take shape beneath 0.71 today, given its surrounding confluence. Expect price action to show signs of halting around H4 support at 0.7073. A breach of this level has January’s opening level to target at 0.7042.
Today’s data points: Limited.
USD/JPY:
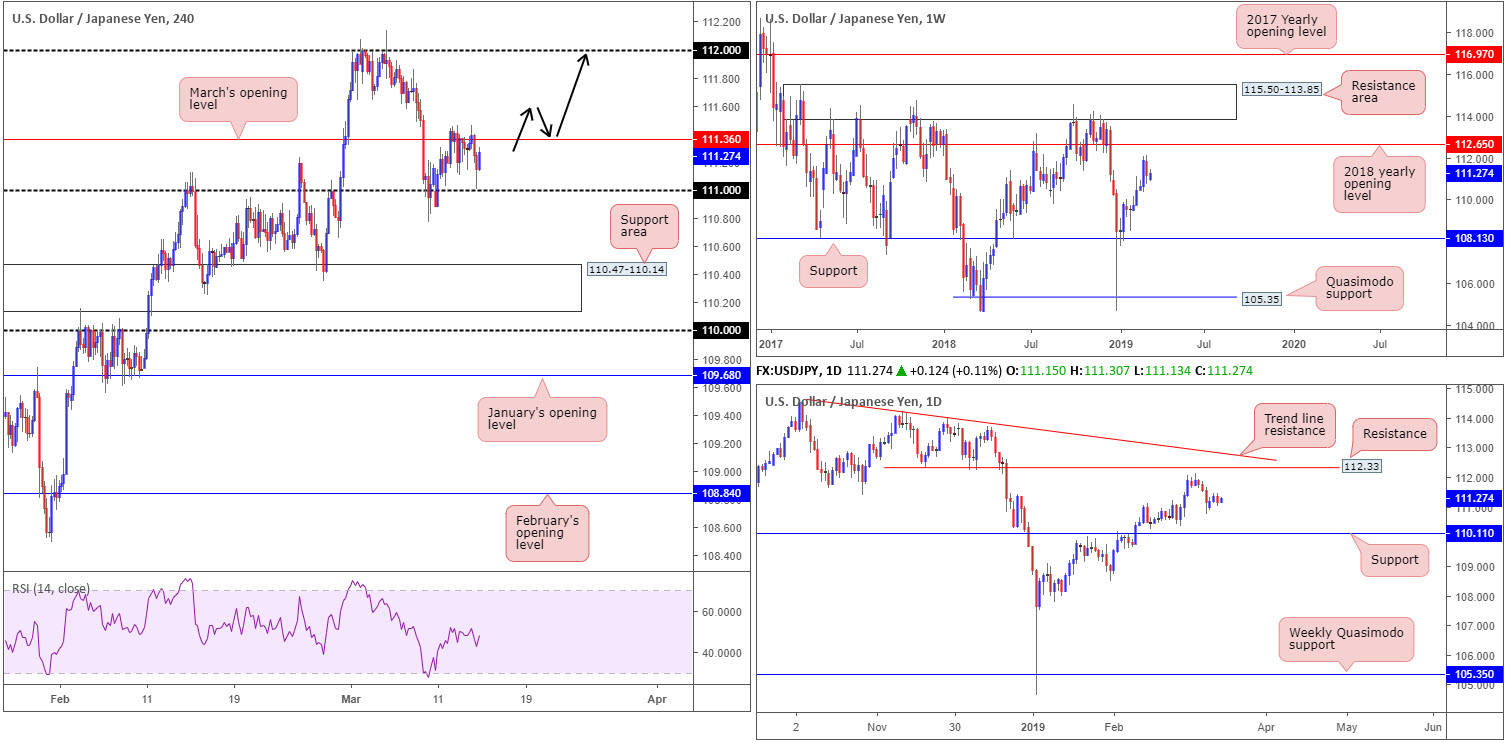
Despite USD/JPY bulls losing interest last week, fading fresh 2019 highs of 112.13, price action remains supported on the weekly timeframe for now. In terms of structure, pivotal resistance at 112.65 (the 2018 yearly opening level) is seen, demonstrating this market still has room to advance.
Since bottoming at 104.65 at the beginning of the year, the daily candles have printed a series of higher highs and higher lows. Recent selling is, therefore, likely to find support and eventually continue higher, drawing in resistance plotted at 112.33, followed by trend line resistance extended from the high 114.23.
A closer reading on the H4 timeframe places the candles between March’s opening level at 111.36 and the round number 111. Should the market observe a close above 111.36, further buying is likely towards the 112 handle. A break of 111, on the other hand, has a rather large support area at 110.47-110.14 in view.
Areas of consideration:
According to the higher timeframes, the pendulum appears to be swinging towards more of an advance, with daily resistance at 112.33 in place as the first upside objective.
Unfortunately, a long on the H4 is difficult given March’s opening level at 111.36. The alternative, as highlighted above, is to wait and see if the H4 candles have enough clout to conquer 111.36. In the event a H4 close above this level is seen, longs, either on the breakout candle or on a retest (preferably in the shape of a H4 bullish candle as this provides traders clear entry and risk levels to work with), are an option, targeting 112 as the initial take-profit zone.
Today’s data points: Limited.
USD/CAD:
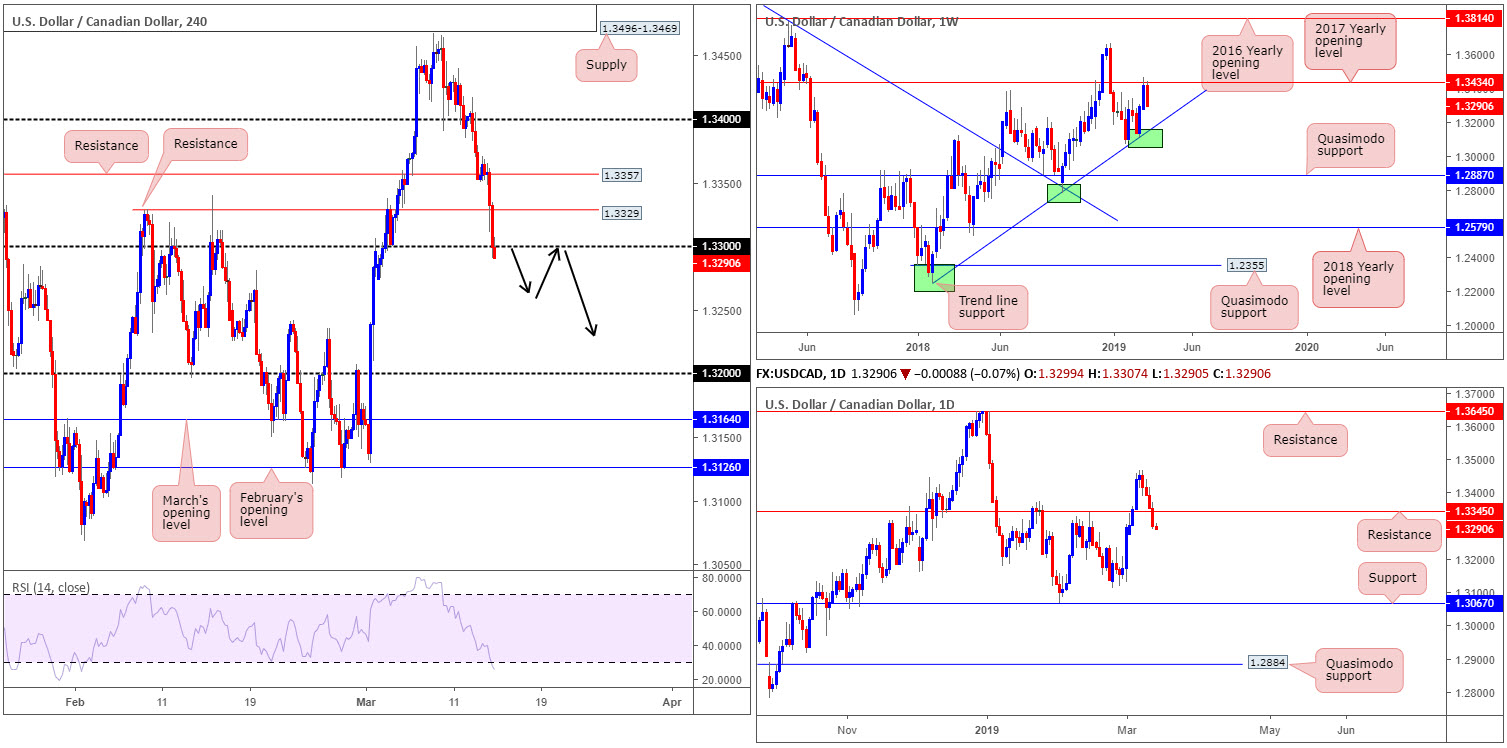
The combination of broad-based selling pressure surrounding the US dollar and a stronger Canadian dollar on the back of rising crude oil prices was the primary catalyst behind the pair’s slide Wednesday.
Bolstered by weekly price fading the 2017 yearly opening level at 1.3434, the USD/CAD registered its fourth consecutive loss yesterday. The H4 candles concluded the session marginally sub 1.33, and so far in Asia, lows of 1.3292 have been achieved. This – coupled with daily flow recently overpowering support at 1.3345 (now acting resistance), along with weekly flow showing room to potentially retest trend line support (etched from the low 1.2247) – could possibly see a run take shape towards 1.32 today/tomorrow.
Areas of consideration:
Keeping things super simple today – easy when all three timeframes trade in harmony – shorts below 1.33 are an option, ultimately targeting 1.32 as the initial port of call. Ideally, a decisive bearish close below 1.33, followed up with a retest as resistance in the shape of a H4 bearish candlestick signal (entry/risk levels can be defined according to this structure) would be a favourable setting.
Today’s data points: Limited.
USD/CHF:
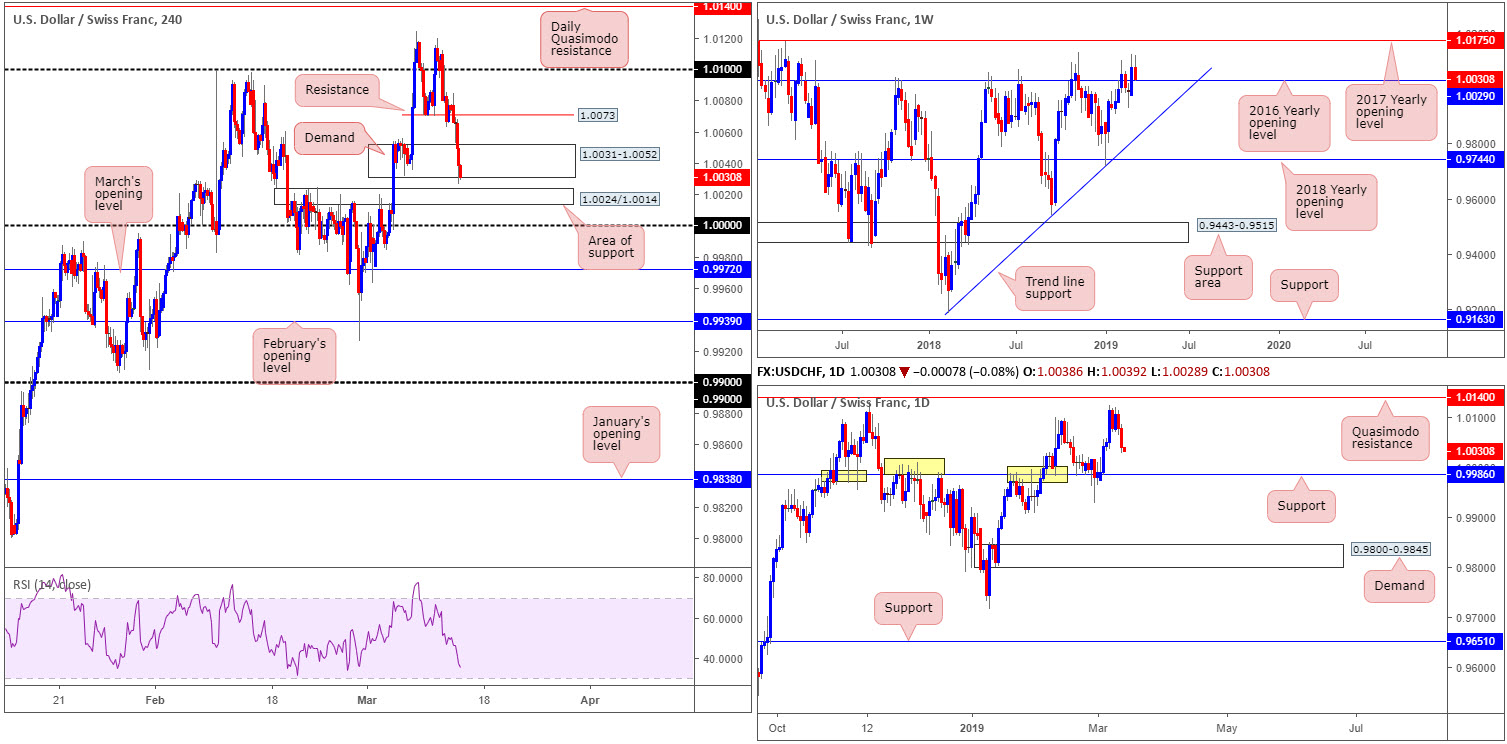
Kicking things off from the weekly timeframe this morning, we can see the unit retesting the top edge of its 2016 yearly opening level at 1.0029. In the event this barrier holds ground, the next area of interest falls in around the 2017 yearly opening level at 1.0175.
The daily timeframe, on the other hand, demonstrates scope to explore ground beyond the current weekly level towards support coming in at 0.9986. Boasting strong historical significance, this barrier is certainly worth a place on the watch list.
Broad-based USD selling, along with the EUR/USD punching higher, weighed on the USD/CHF Wednesday. H4 demand at 1.0031-1.0052 put up little fight and eventually witnessed a marginal breach going into the close. Stop-loss orders taken from beneath here, along with a nearby area of support seen at 1.0024/1.0014 and weekly price testing its 2016 yearly opening level at 1.0029, could see a recovery take form today.
Areas of consideration:
A H4 bullish candlestick pattern printed from current price is, according to where we’re trading from on the weekly timeframe at the moment, a high-probability buy signal (entry/risk levels can be drawn from this structure). In terms of upside targets, the first port of call can be seen around H4 resistance etched from 1.0073.
Today’s data points: Limited.
Dow Jones Industrial Average:
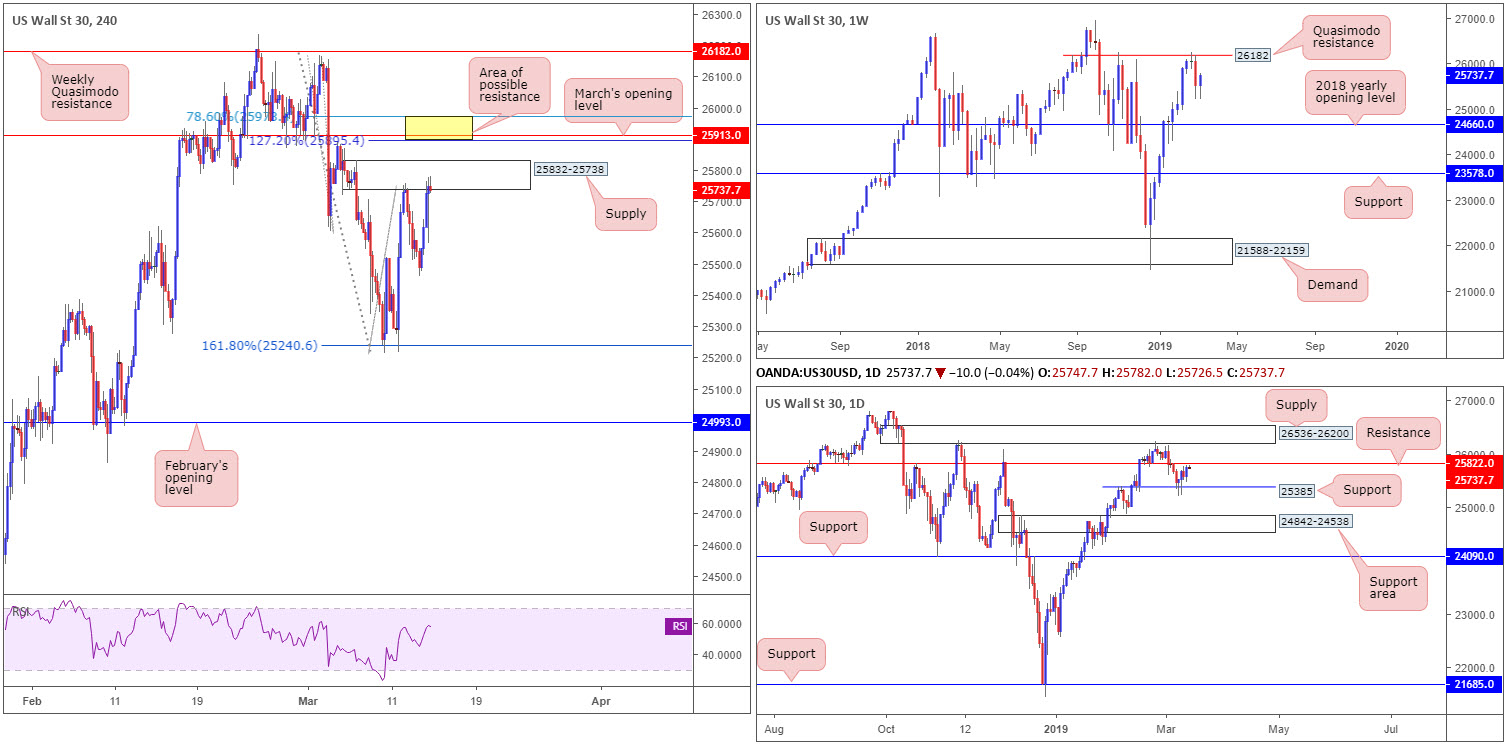
US equities ended Wednesday’s segment on strong footing, up 0.67%. Despite this, the H4 candles display signs of weakness around the lower edge of supply coming in at 25832-25738. In the event this area fails to hold, however, the next area of interest falls in around 25978/25895 (yellow – comprised of a 127.2% H4 Fibonacci ext. point at 25895, a 78.6% Fibonacci resistance value at 25978 and March’s opening level at 25913).
While weekly price shows room to potentially press as far north as Quasimodo resistance at 26182, lurking around the top limit of the current H4 supply is a daily resistance level drawn from 25822 (boasts reasonably attractive history).
Areas of consideration:
The current H4 supply zone at 25832-25738 is worthy of interest, though only once daily sellers are brought into the mix from resistance at 25822. A strong H4 bearish rotation candle printed from here indicates seller intent and could be worth shorting with an initial target objective set around 25460: yesterday’s low.
Should we push for higher ground, though, keep eyes on the yellow H4 zone mentioned above at 25978/25895 for possible shorting opportunities.
Today’s data points: Limited.
XAU/USD (GOLD):
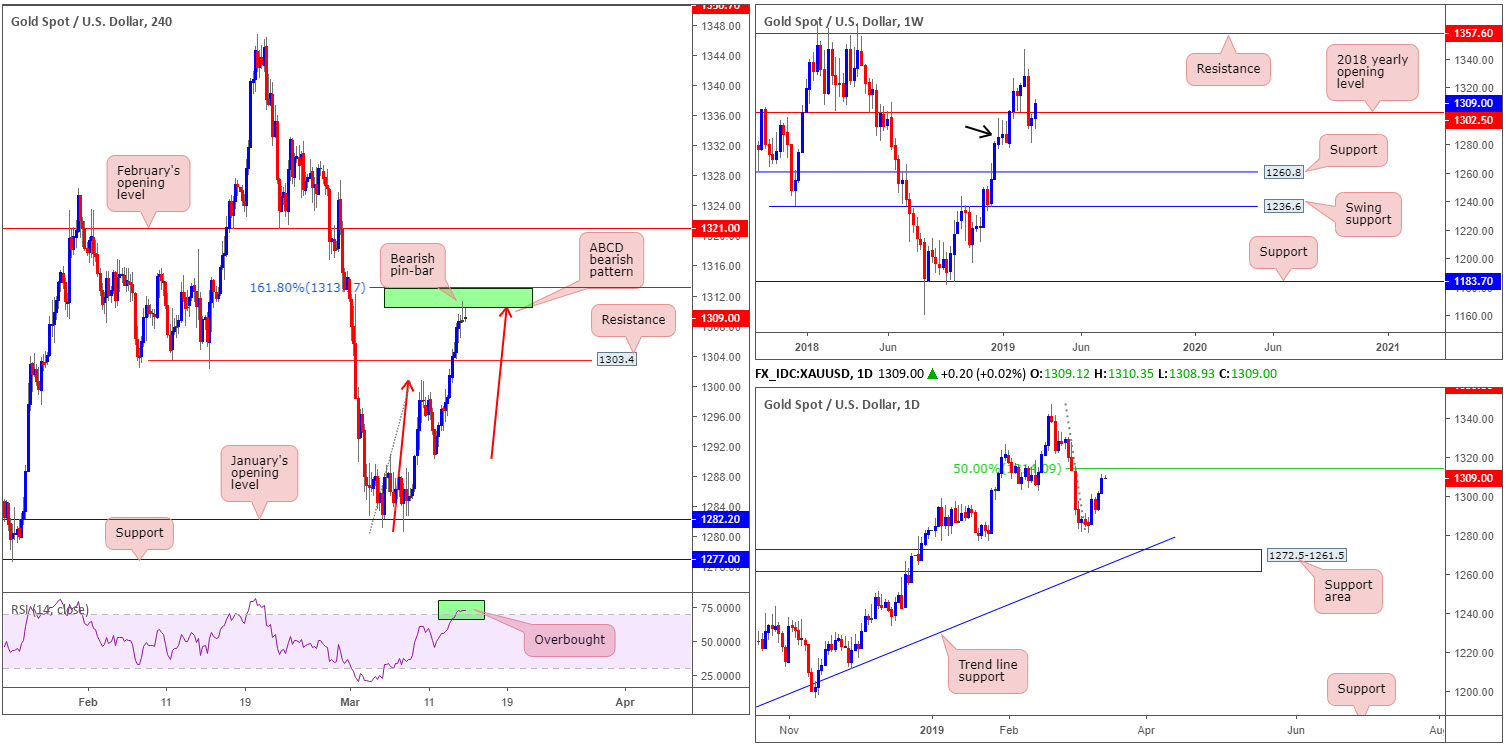
Using a top-down approach this morning, the research team notes weekly activity snapped back above its 2018 yearly opening level at 1302.5. This is largely due to reasonably heavy USD selling and weekly demand in motion around 1276.5-1298.5 (black arrow).
Closer examination on the daily timeframe shows the unit gearing up for a test of its 50.0% resistance value at 1314.1. A rejection from here could see weekly players potentially try and nudge back beneath 1302.5.
Just south of the daily 50.0% resistance, traders may want to note a recently completed H4 ABCD bearish pattern (green) between 1313.1/1310.3. On top of this, we also see a H4 bearish pin-bar confirming candle as well as the RSI indicator testing overbought territory. Should the area fail to hold, aside from the 50.0% base on the daily timeframe, February’s opening level at 1321.0 is next in the firing range.
Areas of consideration:
Although weekly price recently crossed above 1302.5, and daily action has eyes on a level around 1314ish, a selloff from current price on the H4 timeframe towards support at 1303.4 is a possibility. The combination of a H4 confirming candle out of a H4 ABCD bearish structure is enough evidence to entice sellers into the market, even if only for a bounce. A sell at current price leaves traders with the option of either placing stop-loss orders above the current pin-bar candlestick wick (1309.4) or above the 161.8% Fibonacci ext. at 1313.1. Irrespective of where the stop is placed, reasonably satisfactory risk/reward is available to 1303.4.
The accuracy, completeness and timeliness of the information contained on this site cannot be guaranteed. IC Markets does not warranty, guarantee or make any representations, or assume any liability with regard to financial results based on the use of the information in the site.
News, views, opinions, recommendations and other information obtained from sources outside of www.icmarkets.com.au, used in this site are believed to be reliable, but we cannot guarantee their accuracy or completeness. All such information is subject to change at any time without notice. IC Markets assumes no responsibility for the content of any linked site. The fact that such links may exist does not indicate approval or endorsement of any material contained on any linked site.
IC Markets is not liable for any harm caused by the transmission, through accessing the services or information on this site, of a computer virus, or other computer code or programming device that might be used to access, delete, damage, disable, disrupt or otherwise impede in any manner, the operation of the site or of any user’s software, hardware, data or property


