
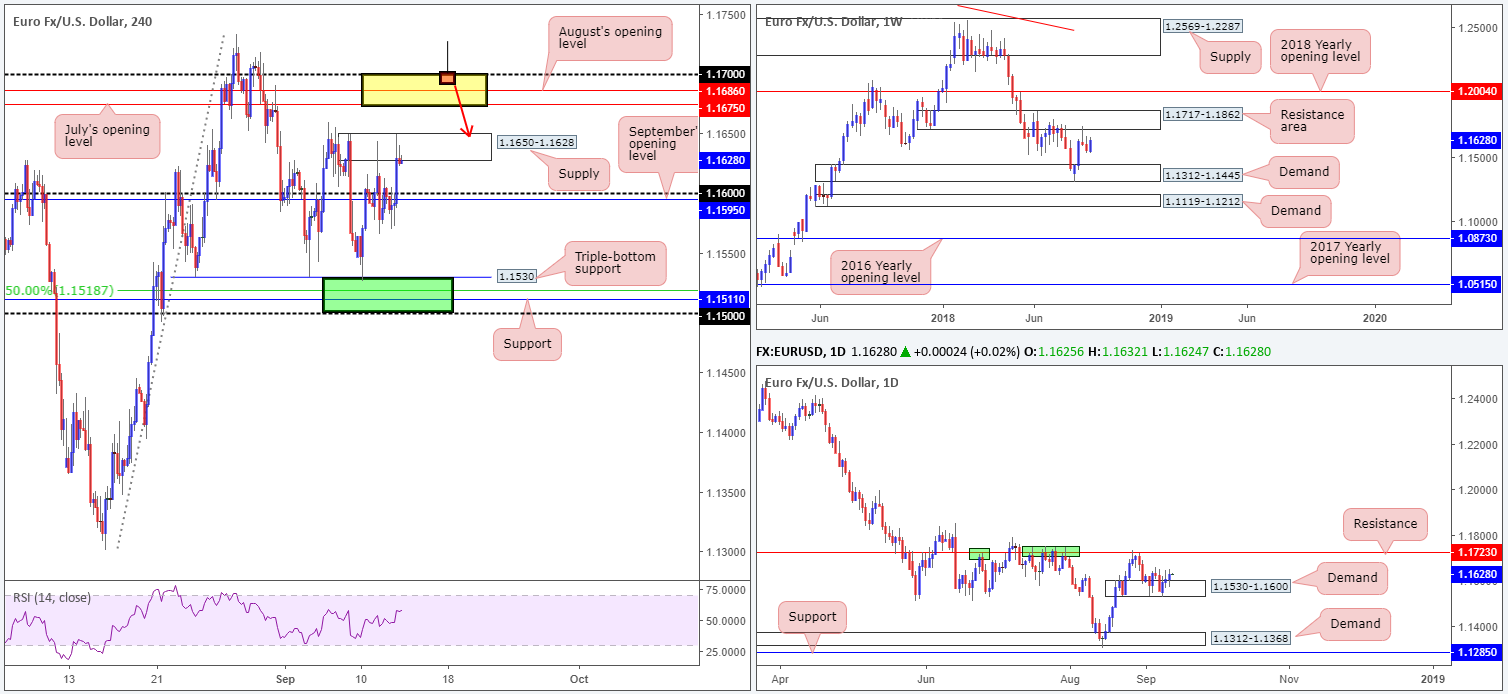
EUR/USD:
A miss on Wednesday’s US PPI numbers, coupled with a weakening greenback and the Wall Street Journal reporting the US is said to be initiating a new round of trade talks with China, kept the single currency on the winning side of the table on Wednesday. Printing its third consecutive daily gain, the H4 candles reclaimed the 1.16 barrier and drove deep into supply territory drawn from 1.1650-1.1628. Should the market observe a break of this supply area today, July’s opening level at 1.1675, August’s opening level at 1.1686 and the 1.17 handle will likely re-enter the fight.
Supported by a daily demand penciled in at 1.1530-1.1600, the EUR/USD could, according to the daily scale, drive as far north as a daily resistance coming in at 1.1723. For those who follow the weekly timeframe, technicals show a resistance area at 1.1717-1.1862 (the current daily resistance is seen within the lower limits of this base) on the horizon, which, as you can see, held price lower in the months of May, June and July of this year.
Areas of consideration:
With respect to weekly and daily movement, both timeframes show room to stretch as far north as the 1.17s at the moment.
Intraday action, the H4 timeframe, as far as we can see, is pointing to a possible break of its supply zone mentioned above at 1.1650-1.1628. The yellow zone marked above it denotes the aforementioned monthly opening levels and round number highlighted between 1.17/1.1675. Given this area is positioned a few pips beneath the underside of the weekly resistance area at 1.1717 and daily resistance at 1.1723, a H4 bearish pin-bar formation that pierces through 1.17 and taps these two higher-timeframe barriers (see the H4 chart for a visual) would likely be enough to consider shorting opportunities (stop-loss orders can be positioned beyond the pin-bar’s wick), targeting the top edge of the current H4 supply as the first port of call (which will be a support area at that point).
Also worth keeping in mind is the ECB’s Monetary Policy Decision due later on today, followed by a Press Conference. Unanimous expectations look for the ECB to leave its three key rates unchanged.
Today’s data points: ECB monetary policy decision/press conference; US inflation numbers; FOMC members Quarles and Bostic also take to the stage.
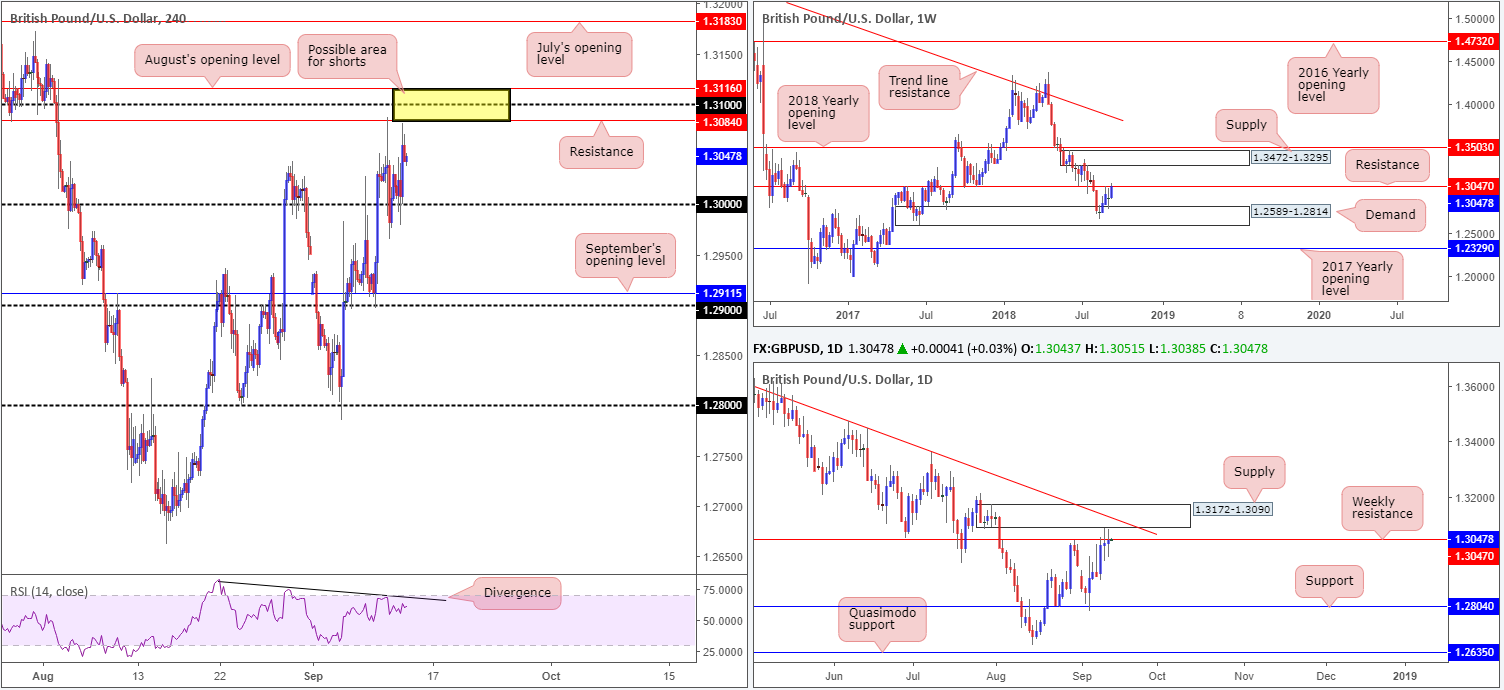
GBP/USD:
Wednesday’s movement witnessed cable reclaim the 1.30 handle despite losing it during London trade. US hours saw the unit advance into this move, bolstered by a waning buck, weak US PPI figures and optimistic Brexit news flow. The H4 candles pressed to highs of 1.3080, seen a couple of pips south of resistance plotted at 1.3084. Also worthy of note on the H4 scale is the nearby 1.31 handle and August’s opening level at 1.3116, as well as the RSI indicator displaying divergence as the value approaches overbought territory.
In conjunction with the current H4 resistances, both the weekly and daily timeframes exhibit strong resistance. Weekly flow continues to toy with the underside of a resistance level priced in at 1.3047, whereas daily flow is seen testing the underside of a supply area at 1.3172-1.3090 that converges with a nearby trend line resistance (taken from the high 1.3472).
Areas of consideration:
With such huge resistances in play right now we feel the GBP may struggle to climb much higher this week. Technically speaking, it’d likely raise a few eyebrows should the pair close above August’s opening level mentioned at 1.3116. Therefore, the yellow zone marked on the H4 timeframe between 1.3116/1.3084 is a potential sell zone today. Note the area holds the underside of daily supply within its lower boundaries.
Traders are also reminded we have the BoE’s Monetary Policy Decision due later on today. The central bank is widely expected to keep the Bank Rate unchanged at 0.75%, with all 71 analysts surveyed by Reuters forecasting the central bank will remain on hold. In light of this event, traders are urged to wait for a H4 bearish candlestick formation to take shape before pulling the trigger within 1.3116/1.3084.
Today’s data points: BoE Monetary Policy Decision; US inflation numbers; FOMC members Quarles and Bostic also take to the stage.
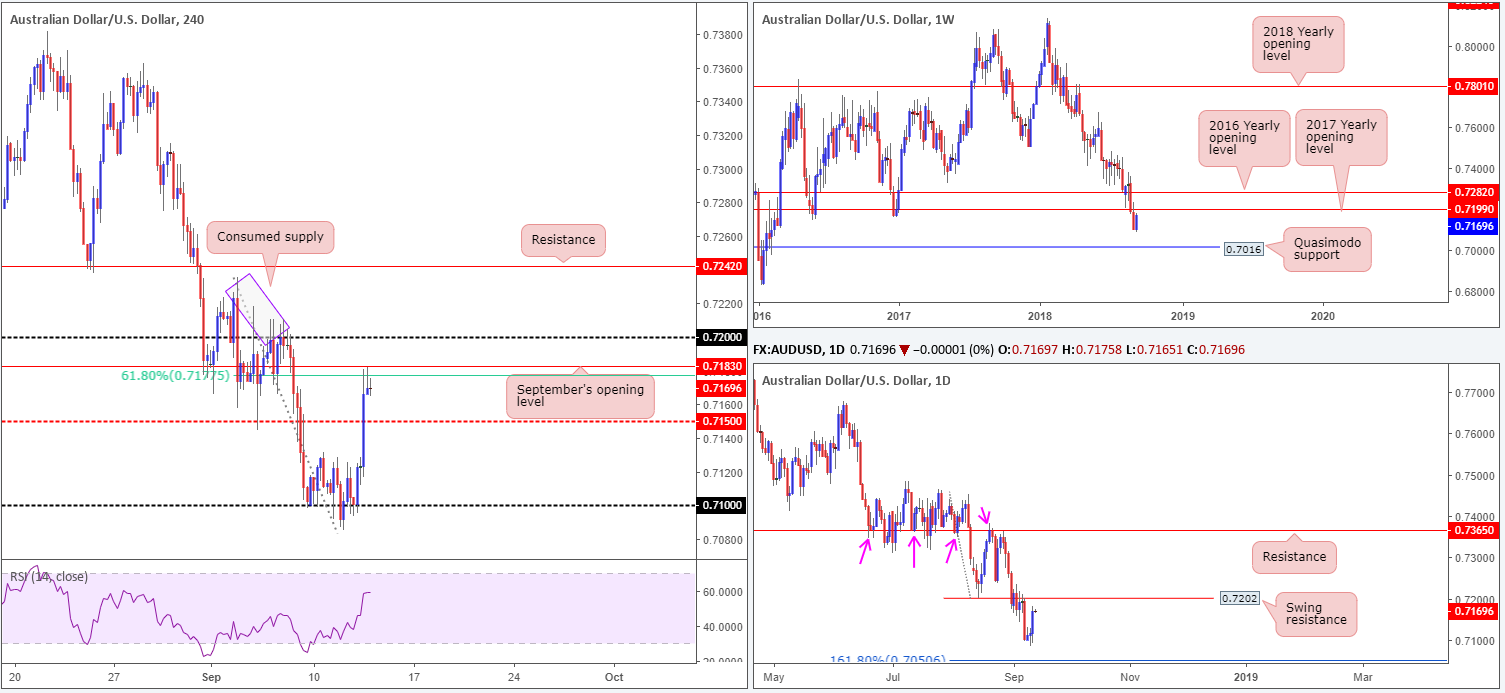
AUD/USD:
Bolstered on reports the US is said to be initiating a new round of trade talks with China, the Australian dollar chalked up a firm bullish candle on Wednesday. Unable to break the 0.71 handle on the H4 timeframe, the H4 candles lifted beyond mid-level resistance at 0.7150 to challenge September’s opening level at 0.7183 and nearby 61.8% Fib resistance at 0.7177.
Although 0.7183 is holding price lower at the moment, focus is drawn to the 0.72 handle in view of what it fuses with on the bigger picture. Weekly price is seen nearing the underside of the 2017 yearly opening level at 0.7199, while daily flow targets the underside of a swing resistance penciled in at 0.7202. In the event the H4 sticks push above 0.72, however, active supply is limited (see purple box) until reaching H4 resistance fixed at 0.7242.
Areas of consideration:
With the unit approaching strong resistance on the higher timeframes, initiating a long position in this market would be considered a chancy move.
Selling from 0.72 on a H4 bearish candlestick formation, on the other hand, could be something to think about today. Traders will want to see price swiftly take out September’s opening level at 0.7183 from here as this barrier could hinder downside. Once this base is out of the picture, traders are free to reduce risk to breakeven, with the expectation of the unit reaching at least 0.7150 for partial profit taking.
Today’s data points: Australian employment figures; US inflation numbers; FOMC members Quarles and Bostic also take to the stage.
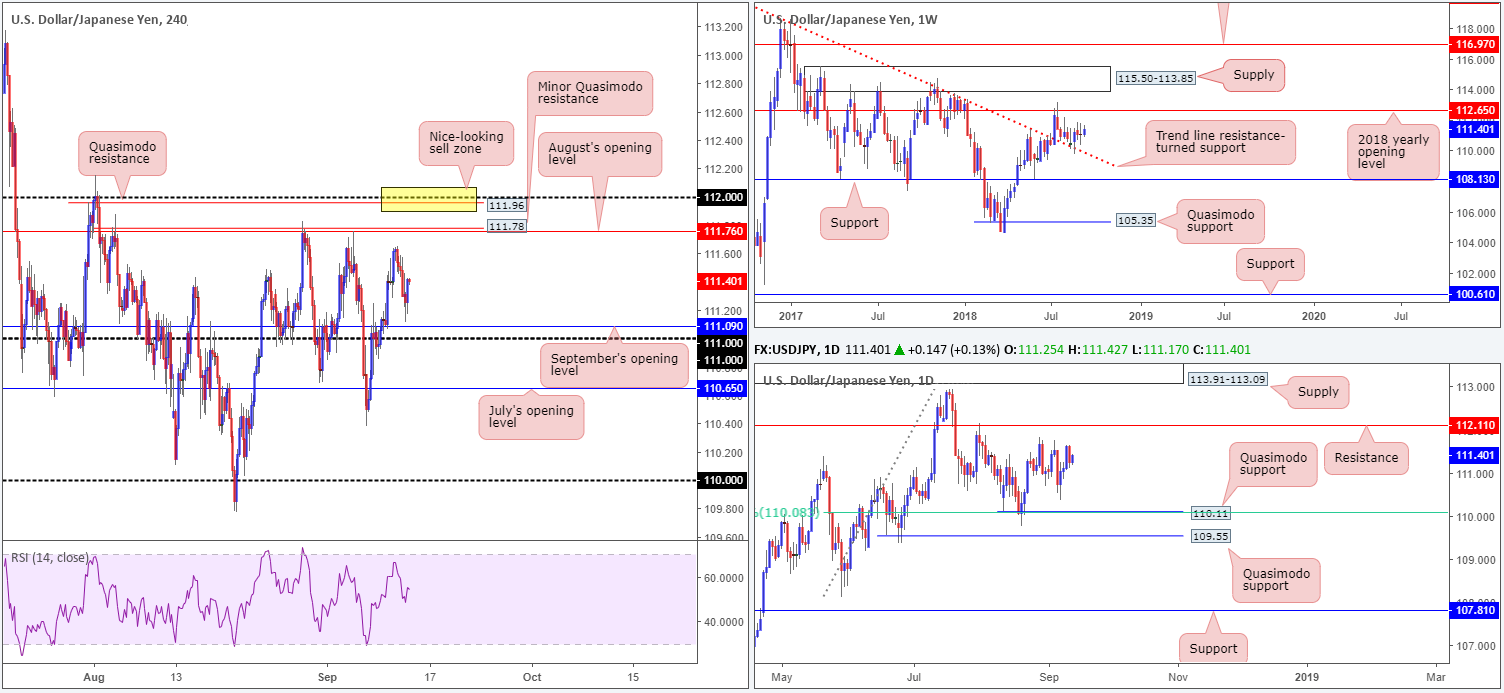
USD/JPY:
After topping at highs of 111.64, the USD/JPY penciled in a modest move to the downside on Wednesday. Weighed on by soft US PPI data along with a mild selloff in US equities (despite the US said to be initiating a new round of trade talks with China), H4 price bottomed just north of September’s opening level at 111.09.
In terms of upside targets on the H4 scale, traders’ crosshairs likely remain fixed on August’s opening level at 111.76 as it fuses with a minor Quasimodo resistance at 111.78. What’s also attractive is the Quasimodo resistance seen at 111.96. Aside from this level merging closely with the 112 handle, the apex (112.15) of the Quasimodo formation is strengthened by a daily resistance level seen at 112.11.
As for the weekly timeframe, the pair shows the unit strongly retested a trend line resistance-turned support (taken from the high 123.57) a few weeks back, though has so far failed to generate much upside presence. Having seen this line hold firm as resistance on a number of occasions in the past, however, it’s likely to remain a defensive barrier going forward. Further buying from current price has the 2018 yearly opening level at 112.65 to target.
Areas of consideration:
Intraday support rests around the 111 handle on the H4 timeframe this morning, which, as you can see, is bolstered by September’s opening level mentioned above at 111.09. Keep eyes on this area today. A H4 bullish candlestick formation out of this zone suggests we’re heading towards August’s opening level at 111.76, followed closely by the 112 handle.
The H4 Quasimodo resistance level mentioned above at 111.96 also remains a worthy contender for possible shorts going forward (yellow zone). Having seen daily resistance at 112.11 reinforcing the top edge of this Quasimodo formation, placing stop-loss orders above the Quasimodo apex at around 112.17ish is an option.
Today’s data points: US inflation numbers; FOMC members Quarles and Bostic also take to the stage.
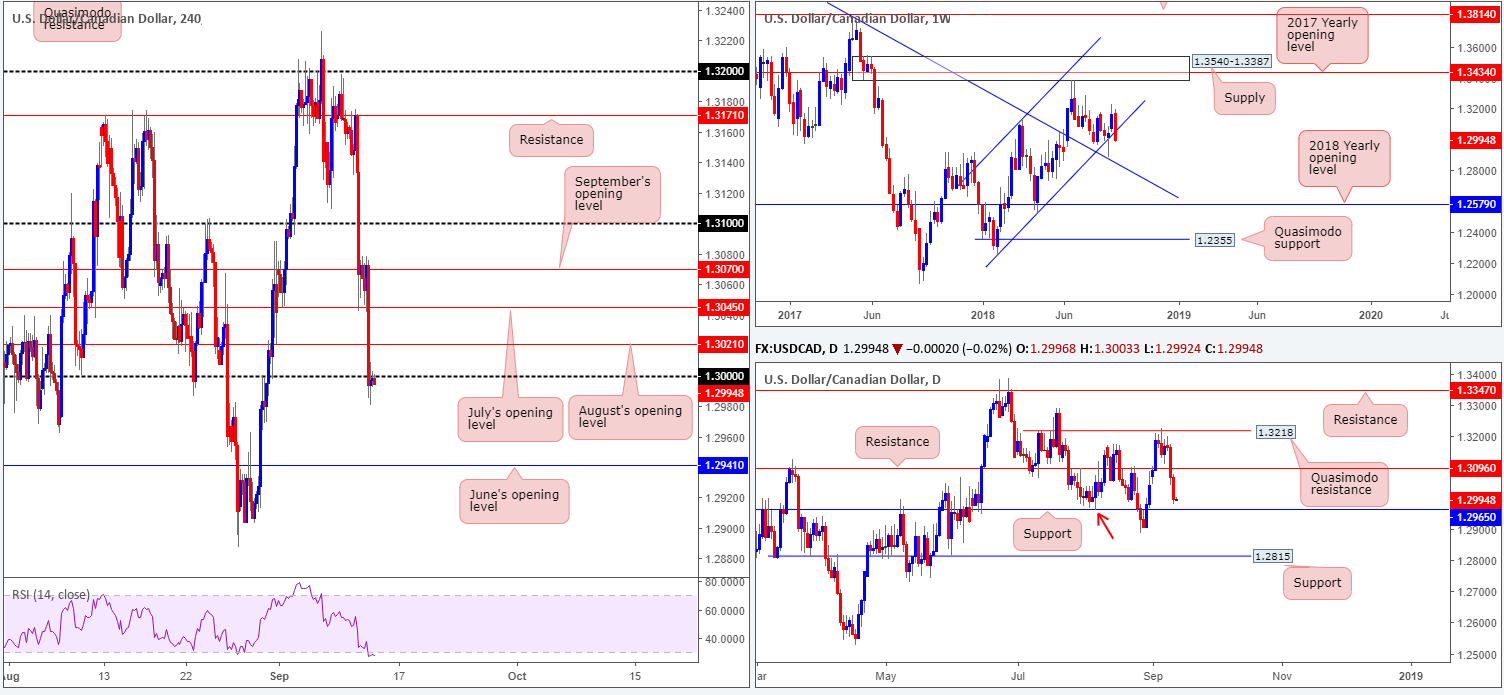
USD/CAD:
USD/CAD movement plummeted lower on Wednesday to sub-1.30 amid positive NAFTA commentary (optimistic comments from Mexico’s Economy Minister Ildefonso Guajardo, saying there’s a high chance of a possible US-Canada trade deal), as well as a tail wind from oil prices. With 1.30 currently serving as resistance, June’s opening level seen on the H4 timeframe at 1.2941 is likely on the watchlists for many traders this morning.
On a wider perspective, however, weekly price has engulfed its long-term channel support (etched from the low 1.2247), placing the spotlight on the trend line resistance-turned support (extended from the high 1.4689). Contrary to weekly price, daily movement engulfed a notable support at 1.3096 (now acting resistance) on Tuesday and closed just north of support coming in at 1.2965 on Wednesday (happens to also represent a Quasimodo left shoulder support – red arrow).
Areas of consideration:
According to the higher-timeframe picture, shorts off the underside of 1.30 are good at least until we reach daily support at 1.2965. This level is shadowed closely by June’s opening level mentioned above on the H4 scale at 1.2941. Should traders observe a H4 bearish candlestick formation print around 1.30 today that closes in reasonably strong fashion, a sell on the back of this could be an idea. To be on the safe side, though, reducing risk to breakeven once/if price challenges the current daily support is recommended. Ultimately, though, you’d want to see June’s opening level brought into the fray before covering some of the position.
Today’s data points: US inflation numbers; FOMC members Quarles and Bostic take to the stage; CAD NHPI m/m.
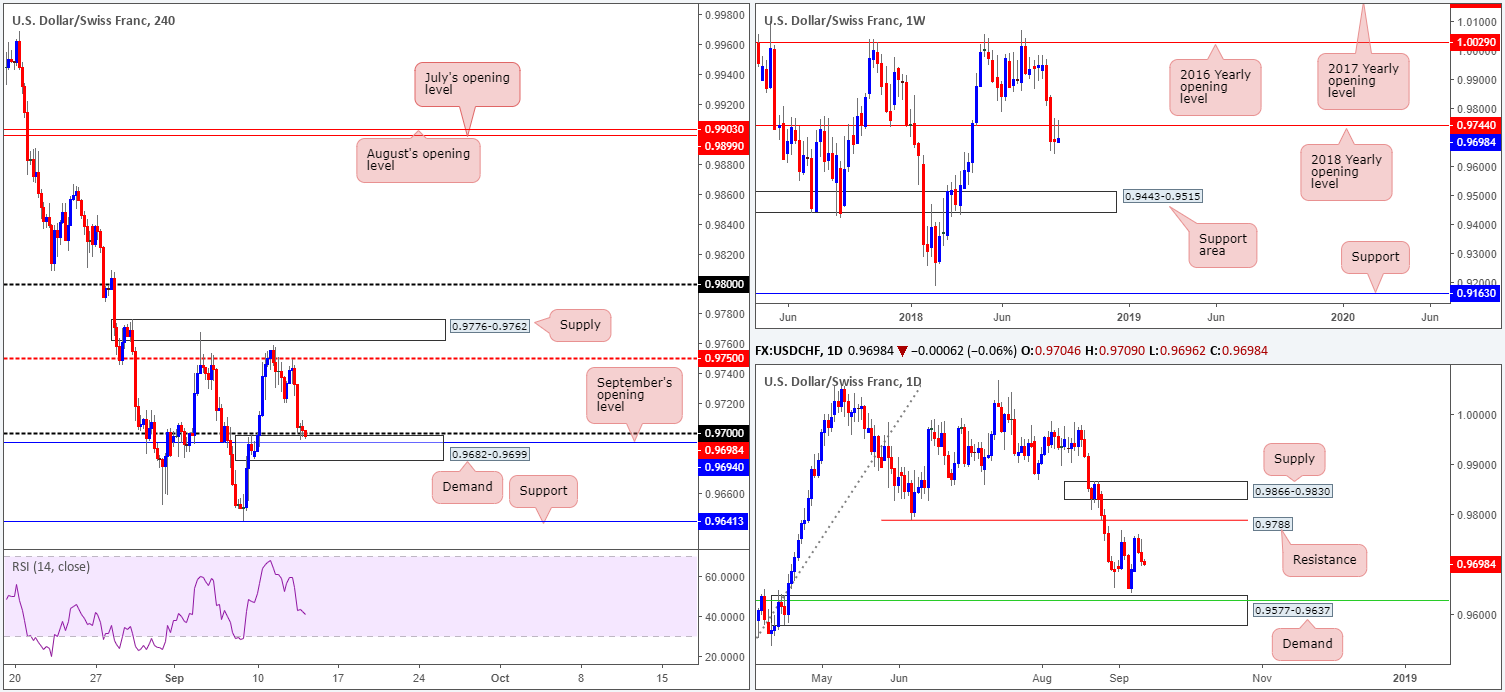
USD/CHF:
As is evident from the weekly timeframe this morning, the USD/CHF is seen establishing solid ground off the underside of the 2018 yearly opening level at 0.9744. Continued downside from this point has the support area at 0.9443-0.9515 to target. In line with the weekly picture, daily activity shows room to press as far south as 0.9577-0.9637: a demand area that converges with a 50.0% support value at 0.9627 (green line).
Wednesday’s movement on the H4 scale, nevertheless, brought price towards the 0.97 handle. Although the unit is currently seen trading a few pips beneath this level, selling this break is chancy given we have demand positioned at 0.9682-0.9699, along with September’s opening level at 0.9694. A break beyond these barriers likely frees the path south to test support at 0.9641 – positioned just north of daily demand mentioned above at 0.9577-0.9637.
Areas of consideration:
To our way of seeing things, there are two options going forward:
- Enter long from the current H4 demand area based on a bullish candlestick formation, targeting 0.9750 as the initial take-profit zone. The additional candlestick confirmation is required since let’s not forget where we’re coming from on the bigger picture!
- In the event the current H4 demand is engulfed, a retest to the underside of this area as resistance offers a platform for possible shorting opportunities, targeting H4 support at 0.9641/top edge of daily demand at 0.9637.
Today’s data points: US inflation numbers; FOMC members Quarles and Bostic also take to the stage.
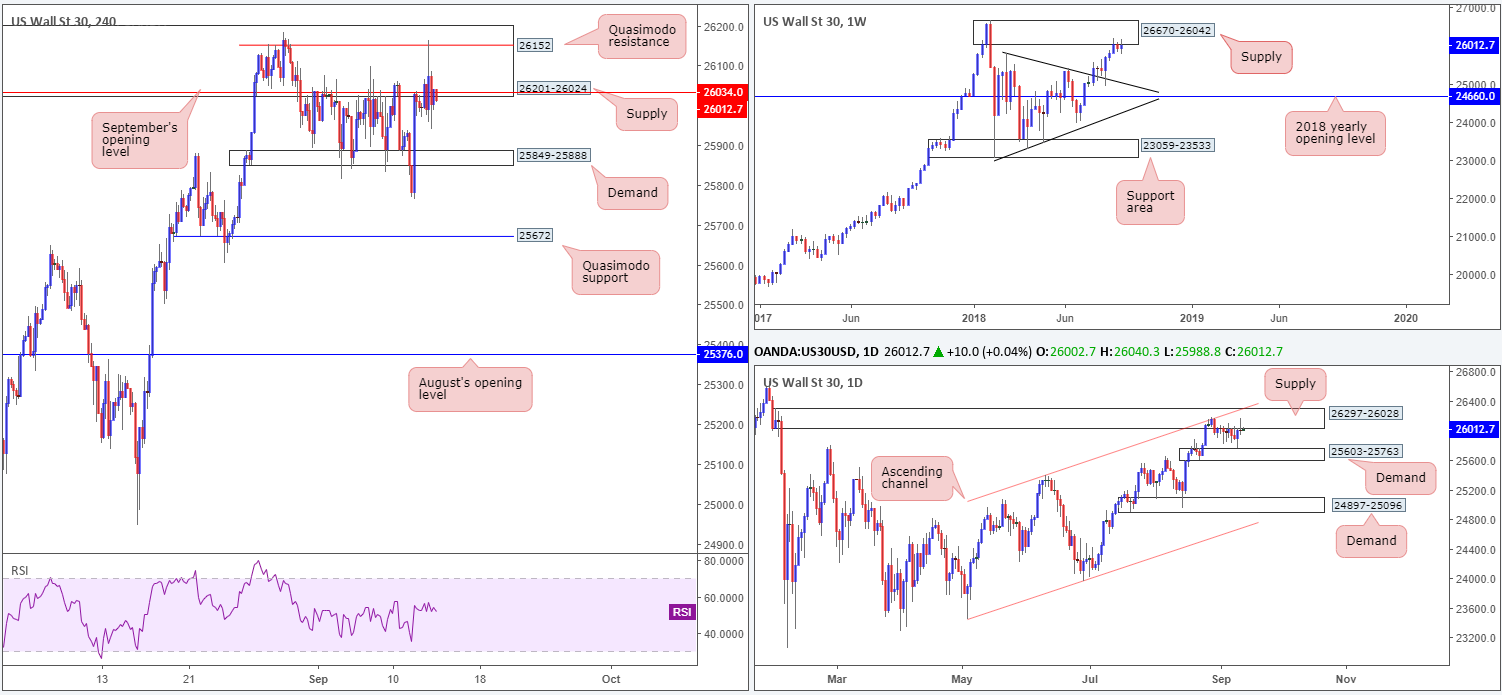
Dow Jones Industrial Average:
For those who read our previous reports you may recall the team were banging the drum about a H4 Quasimodo resistance level at 26152 as a possible sell zone, which is encased within a larger H4 supply area at 26201-26024.
As you can see, price attacked 26152 yesterday and thus far has been respected. From this point, technically speaking, further downside is likely on the cards. Nearby H4 demand at 25849-25888 is well and truly consumed owing to the number of times it has been violated, leaving the runway south likely free to test the H4 Quasimodo support at 25672. Before price hits this level, however, traders are urged to also consider the top edge of daily demand plotted at 25603-25763 as well.
The chief reason behind selecting 26152 as a sell zone, aside from offering traders the option of positioning stops above the current H4 supply, came down to the bigger picture. The index is seen testing the underside of a weekly supply zone drawn from 26670-26042, following a strong retest off a trend line resistance-turned support (etched from the high 25807) a few weeks back. On the daily timeframe, strong supply at 26297-26028 remains in the fold. What gives this area credibility comes down to the following:
- Downside momentum drawn from the base is incredibly strong.
- The zone intersects with a nearby daily channel resistance (taken from the high 25399).
- Glued to the underside of the aforesaid weekly supply area.
Areas of consideration:
For folks currently short this market, great job! Ultimately you’ll want to see H4 price remain beneath September’s opening level at 26034 to attack the noted H4 demand base. For those of you who missed this selling opportunity, you may be given a second chance. Should H4 price print a decisive close beneath September’s opening level today and retest the base as resistance in the shape of a bearish candlestick formation (be it on the H4 or lower timeframes), shorts could be an option, with an ultimate take-profit target residing around the H4 Quasimodo support mentioned above at 25672.
Today’s data points: US inflation numbers; FOMC members Quarles and Bostic also take to the stage.
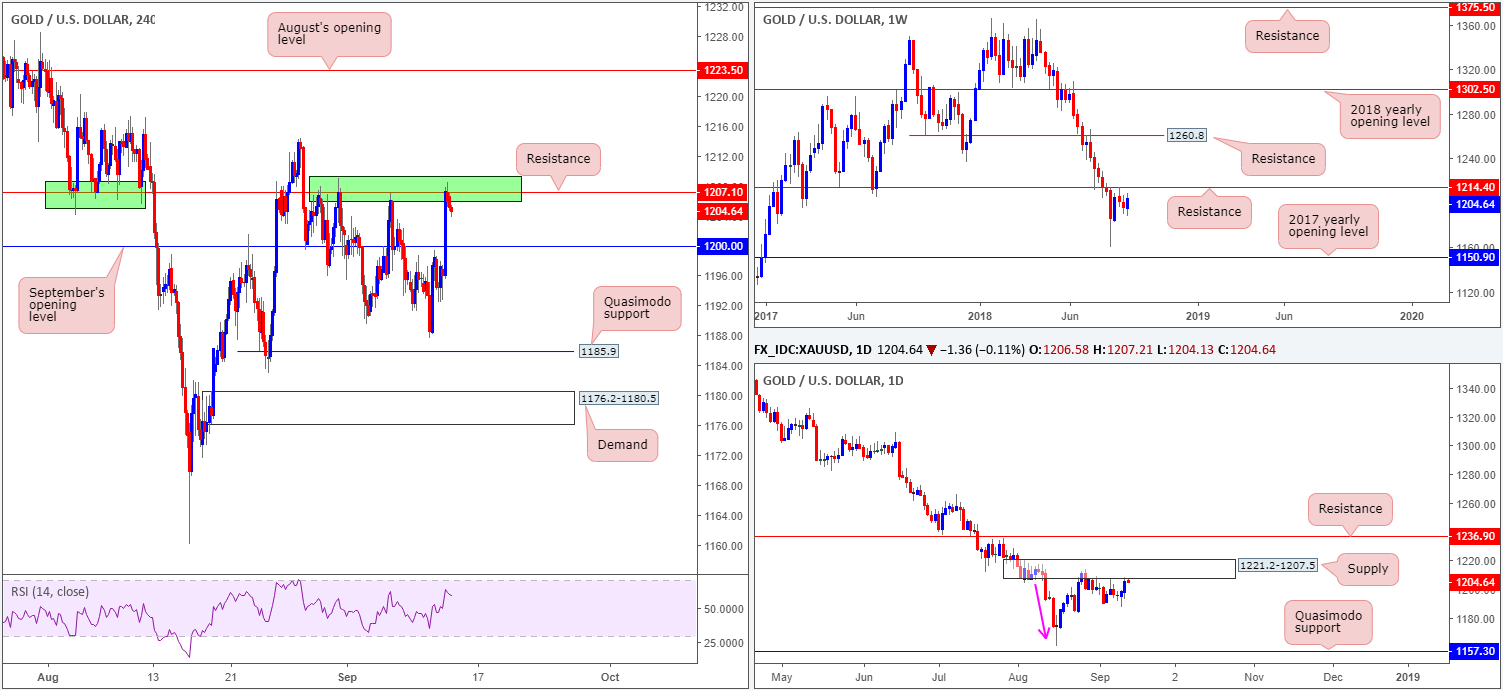
XAU/USD (Gold)
Having seen the US dollar index languishing beneath 95.00, this weakness fuelled gold buying on Wednesday. Swiftly reclaiming September’s opening level at 1200.0, H4 price retested a familiar resistance level at 1207.1. This barrier, as you can see, has proven its worth since August of this year (see the green areas). So, it should not really come as much of surprise to see the unit respecting this level at the moment.
In yesterday’s report the team highlighted 1207.1 as a zone worth watching for shorts. Why? The higher-timeframe picture! According to the weekly timeframe, this market is currently reflecting a negative bias right now, as price remains beneath resistance marked at 1214.4. Further downside from this point could eventually stretch as far south as the 2017 yearly opening level at 1150.9. In conjunction with weekly flow, daily movement is seen checking in with a nice-looking supply zone at 1221.2-1207.5. Aside from this zone displaying attractive downside momentum from its base (see pink arrow), it could also be considered the ‘decision point’ to print 2018 yearly lows of 1160.3. Couple this with the fact we are also coming off weekly resistance, we still potentially have ourselves some strong sellers in the mix.
Areas of consideration:
A H4 bearish candlestick formation printed off of the current H4 resistance 1207.1 today can be considered a high-probability shorting opportunity (stop-loss orders should be positioned in line with the candle pattern seen), considering the overall technical picture. As for intraday take-profit targets, traders are likely honing in on September’s opening line mentioned above at 1200.0, followed by the September 11 low at 1187.5 and then H4 demand placed at 1176.2-1180.5.
The use of the site is agreement that the site is for informational and educational purposes only and does not constitute advice in any form in the furtherance of any trade or trading decisions.
The accuracy, completeness and timeliness of the information contained on this site cannot be guaranteed. IC Markets does not warranty, guarantee or make any representations, or assume any liability with regard to financial results based on the use of the information in the site.
News, views, opinions, recommendations and other information obtained from sources outside of www.icmarkets.com.au, used in this site are believed to be reliable, but we cannot guarantee their accuracy or completeness. All such information is subject to change at any time without notice. IC Markets assumes no responsibility for the content of any linked site. The fact that such links may exist does not indicate approval or endorsement of any material contained on any linked site.
IC Markets is not liable for any harm caused by the transmission, through accessing the services or information on this site, of a computer virus, or other computer code or programming device that might be used to access, delete, damage, disable, disrupt or otherwise impede in any manner, the operation of the site or of any user’s software, hardware, data or property.


