
EUR/USD:
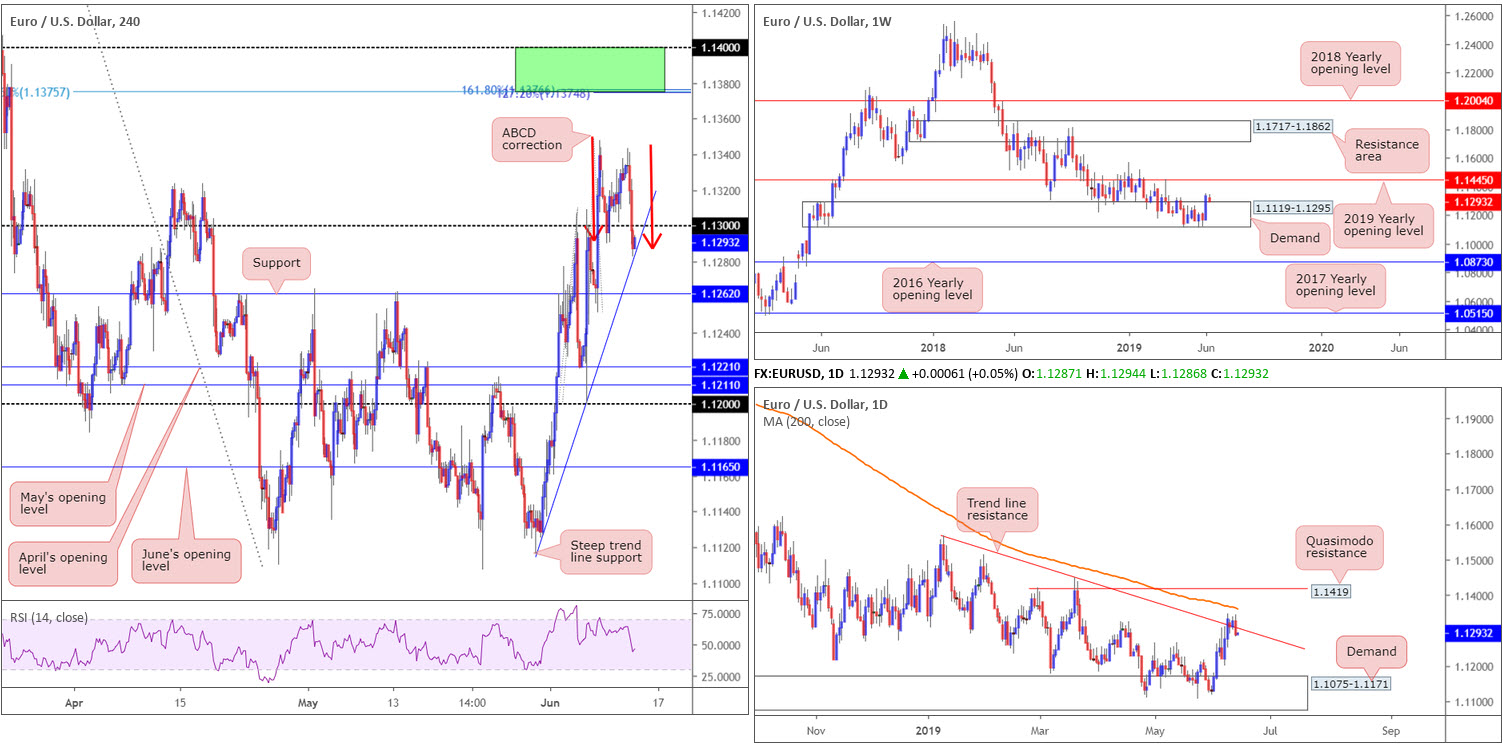
By way of a daily bearish engulfing formation, the euro declined 0.34% against the US dollar Wednesday, consequently reclaiming the 1.13 handle on the H4 timeframe. According to the newswires, the buck caught a bid following China’s Global Times editor hinting China is preparing for a prolonged trade war.
With 1.13 now likely to serve as resistance, and daily movement recently crossing back beneath trend line resistance extended from the high 1.1569, traders’ crosshairs could be fixed on H4 support at 1.1262 as the next viable ‘floor’. While this move is certainly a possibility, another alternative is a phase of buying entering the fold off a steep H4 trend line support taken from the low 1.1116, confirmed with a H4 ABCD (red arrows) correction. The latter also aligns with our weekly view taken from yesterday’s analysis:
EUR/USD bulls remain underlining an offensive state out of a long-standing weekly demand zone at 1.1119-1.1295. Despite the overall trend still facing a southerly bearing since topping in early 2018, the recently formed near-full-bodied weekly bull candle displays scope for extension to as far north as the 2019 yearly opening level at 1.1445.
Areas of consideration:
In the event the pair reclaims 1.13 to the upside on a H4 closing basis, this could serve as proof buyers are interested in taking things higher from the steep H4 trend line support mentioned above (1.1116), and thus could be a good location to consider a long. Upside H4 targets from here fall in around the tops at 1.1343 and ultimately 1.14/1.1374 (which, should we reach this high, is also a useable sell zone given its local confluence and nearby 200-day SMA).
Today’s data points: Limited.
GBP/USD:
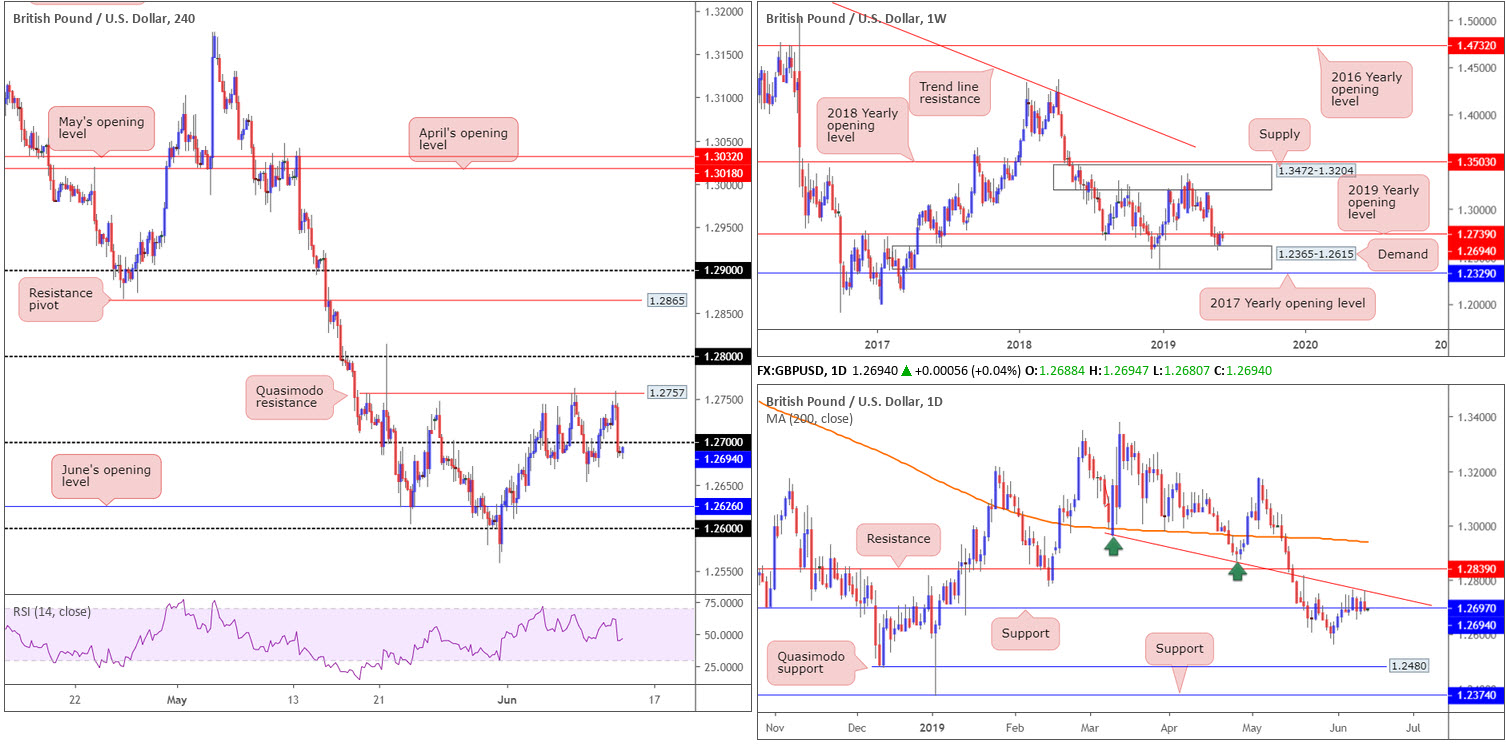
The British pound, although found a strong bid on the back of UK labour market data Tuesday, struggled to preserve an upside presence Wednesday after testing H4 Quasimodo resistance at 1.2757. Slipping beneath 1.27 in the later hours of the session, largely due to UK Parliament voting down a bill aimed at preventing the next conservative leader from pursuing a no-deal Brexit, is now poised to potentially make a run for June’s opening level at 1.2626.
Extracted from yesterday’s briefing:
Higher up on the curve, daily support remains in the fold at 1.2697, though faces resistance in the form of a trend line support-turned resistance taken from the low 1.2960.
Technically speaking, the daily candles are tightly confined between these two structures at present.
From the weekly timeframe, also mined from yesterday’s report:
The story on the weekly timeframe has the current candle shaking hands with the underside of its 2019 yearly opening level at 1.2739, following a recovery from demand at 1.2365-1.2615 last week.
Areas of consideration:
In Wednesday’s brief, the research team wrote about the following setup:
The H4 Quasimodo resistance is a somewhat appealing sell zone to have eyes on today, due to its convergence with the daily trend line support-turned resistance mentioned above, and also because weekly selling interest may develop a little lower on the curve around 1.2739.
Well done to any of our readers who managed to jump aboard the move from 1.2757.
Going forward, should the GBP/USD find resistance at the underside of 1.27 today, the next downside target on the H4 scale, as highlighted above, is June’s opening level at 1.2626, followed by the top edge of weekly demand at 1.2615 and then the round number 1.26. Therefore, if the market observes a nice-looking H4 or H1 bearish candlestick form at 1.27 today, this could be an ideal opportunity to short, basing entry and risk parameters on the selected candlestick formation.
Today’s data points: Limited.
AUD/USD:
Having seen the US dollar extend gains and approach the underside of 97.00 (US dollar index, or DXY), this movement weighed on the Australian dollar Wednesday, down nearly half a percent at the close.
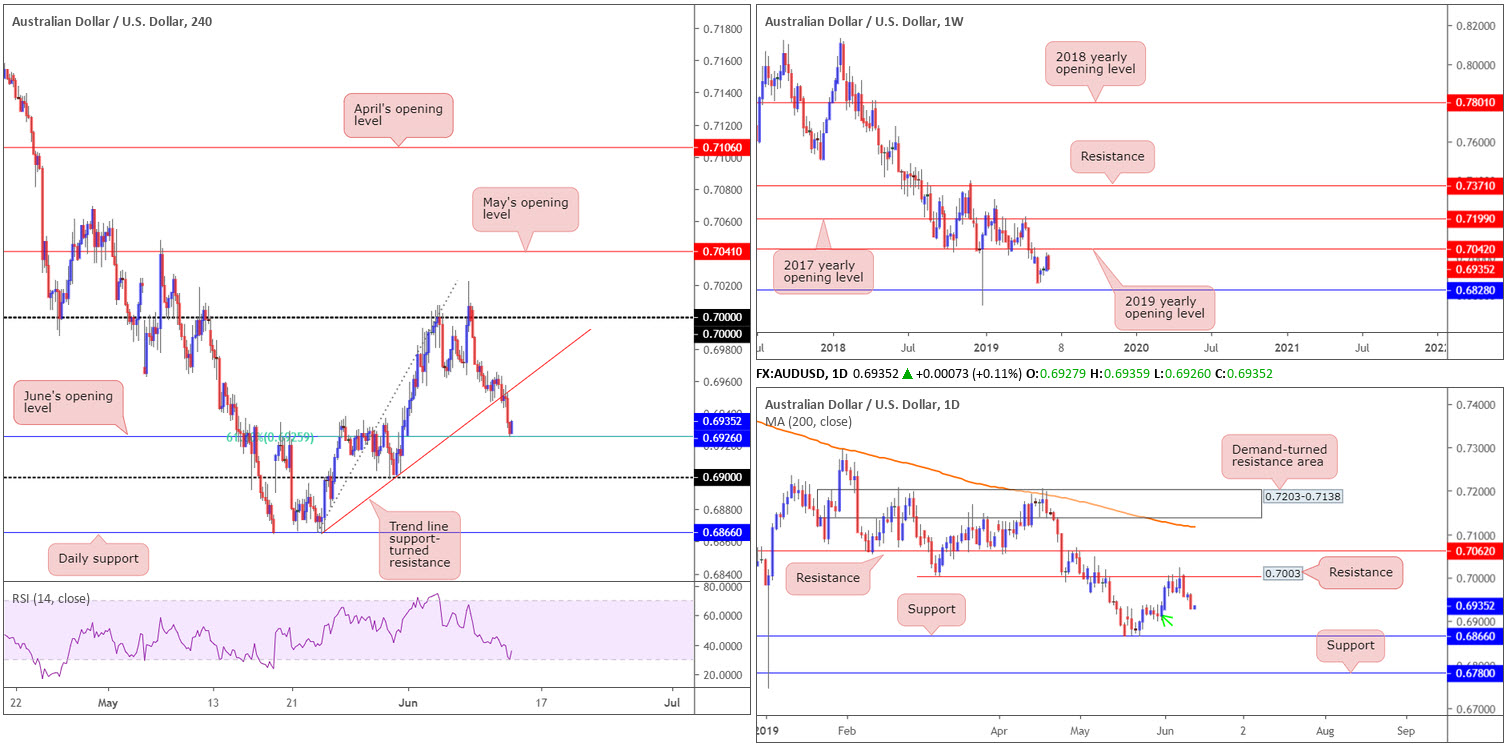
Consequent to recent selling, the H4 candles engulfed a trend line support extended from the low 0.6864 and challenged June’s opening level at 0.6926, which happens to align with a 61.8% Fibonacci support. As of writing, the said level is holding ground, ahead of key jobs data that will likely set the tone for the upcoming RBA meeting. Indicator-based traders may also wish to note the RSI struck its oversold value in recent trading.
On the weekly timeframe, we can see price action left the 2019 yearly opening level at 0.7199 unchallenged before turning lower, erasing a large portion of last week’s gains. Daily flow, on the other hand, is visibly testing demand marked with a green arrow around the 0.6935ish region. Beyond here, we also have nearby support coming in at 0.6866.
Areas of consideration:
Although the research team feels the current H4 support, June’s opening level at 0.6926, will continue to hold until connecting with H4 trend line support-turned resistance (0.6864) as it garners additional strength from the aforementioned daily demand, Aussie employment figures could alter this technical view dramatically. Therefore, it might be best to hold tight until after the event, which, at the time of writing, is an hour away.
Today’s data points: Australia Employment Change and Unemployment Rate.
USD/JPY:
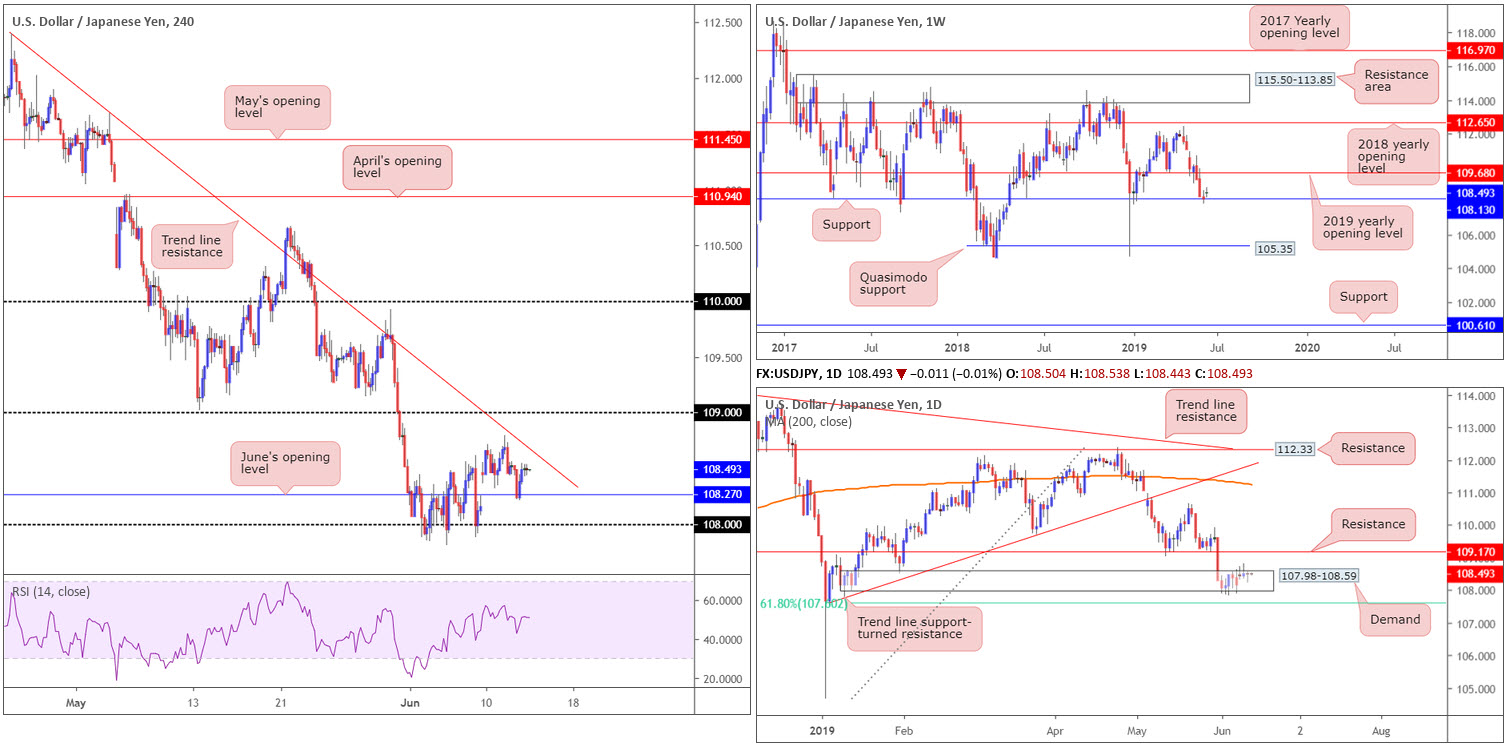
Longer-term flow on the USD/JPY appears to be holding at weekly support drawn from 108.13, though has yet to draw in much bullish enthusiasm. In the event the buyers regain consciousness, the next upside objective is the 2019 yearly opening level at 109.68.
Extracted from yesterday’s briefing in regards to the daily timeframe’s position:
Daily demand at 107.98-108.59 is struggling to maintain a presence. Despite boasting a connection to weekly support mentioned above at 108.13, the odds of daily price rushing the lower edge of the said demand is high, targeting a 61.8% Fibonacci support value at 107.60.
The research team also noted the following levels to keep eyes on for potential short-term trades on the H4 timeframe:
Shorter term, on the other hand, a long from June’s opening level on the H4 timeframe at 108.27 could be worth considering, targeting the current H4 trend line resistance (112.40). On the same note, a sell from the trend line resistance could also be a consideration.
As you can see from the H4 chart this morning, price action tested June’s opening level and held ground, now eyeing a possible test of the said H4 trend line resistance.
Areas of consideration:
Technically, a response from the aforementioned H4 trend line resistance is likely on the cards today. Not only due to its history as a declining resistance, but also because both weekly and daily support structures are emphasising a fragile state at present. Conservative traders concerned about higher-timeframe structure may opt to wait and see how H4 action behaves once connecting with the said trend line resistance before pulling the trigger. A H4 bearish candlestick configuration, for example, would likely be enough evidence to validate a short, targeting at least June’s opening level at 108.27.
Today’s data points: Limited.
USD/CAD:
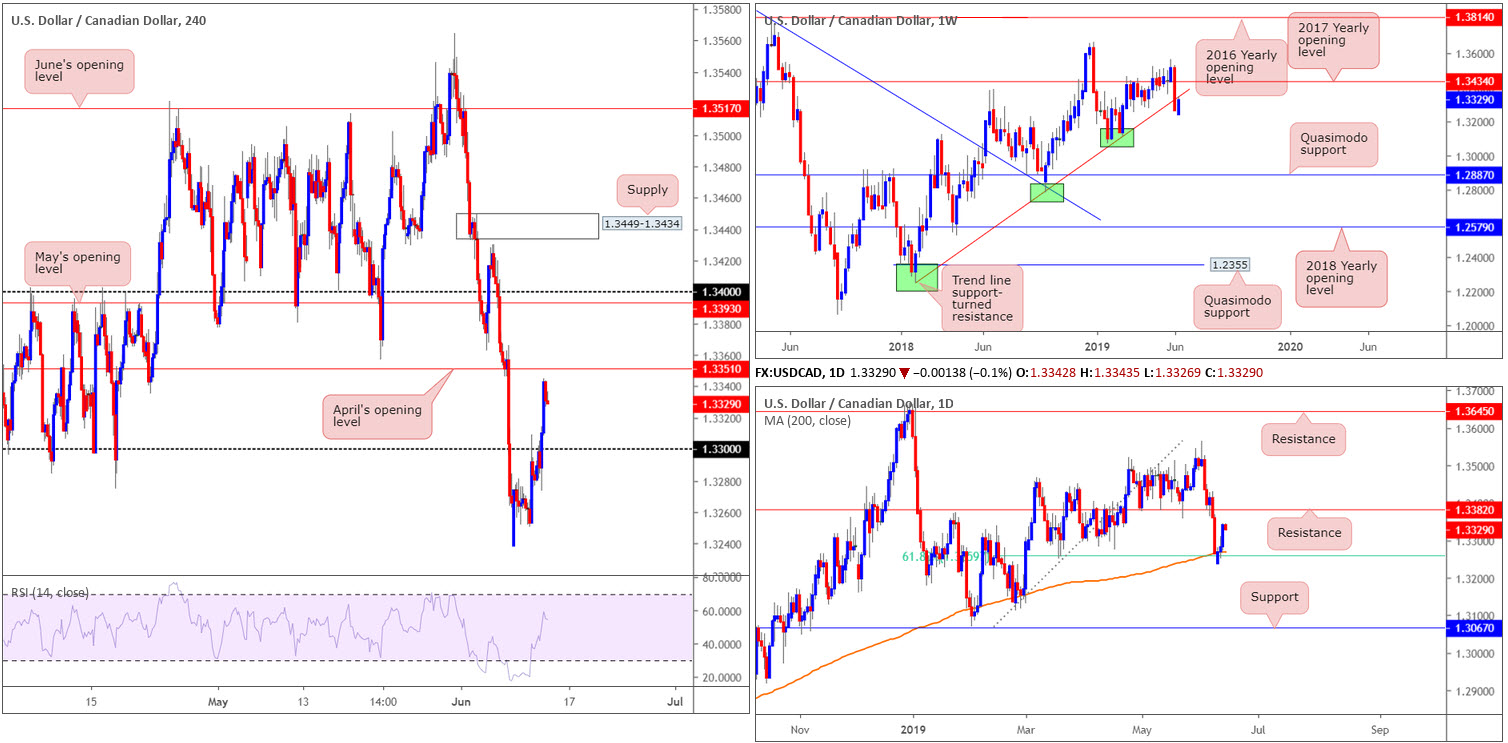
The Canadian dollar was among the worst performers Wednesday, weakened by the on-going sell-off in crude oil prices. This – coupled with the US dollar index advancing towards 97.00 – lifted the USD/CAD pair northbound in recent trading, breaking through 1.33 and closing within touching distance of April’s opening level at 1.3351 on the H4 timeframe.
Supporting the move higher yesterday, technically speaking, was the 200-day SMA and merging 61.8% Fibonacci support value at 1.3260 on the daily timeframe. While daily flow exhibits scope to press as far north as resistance at 1.3382, weekly movement recently shook hands with a trend line support-turned resistance extended from the low 1.2247.
Areas of consideration:
On account of the above, the research team favours April’s opening level at 1.3351 as a potential sell zone, as it boasts a close connection to the weekly trend line support-turned resistance. In order to avoid being taken out on a whipsaw, traders are urged to consider waiting for additional confirmation to form before committing funds to a position. This not only helps identify seller intent, it also generally provides traders entry and risk levels to work with.
Today’s data points: Limited.
USD/CHF:
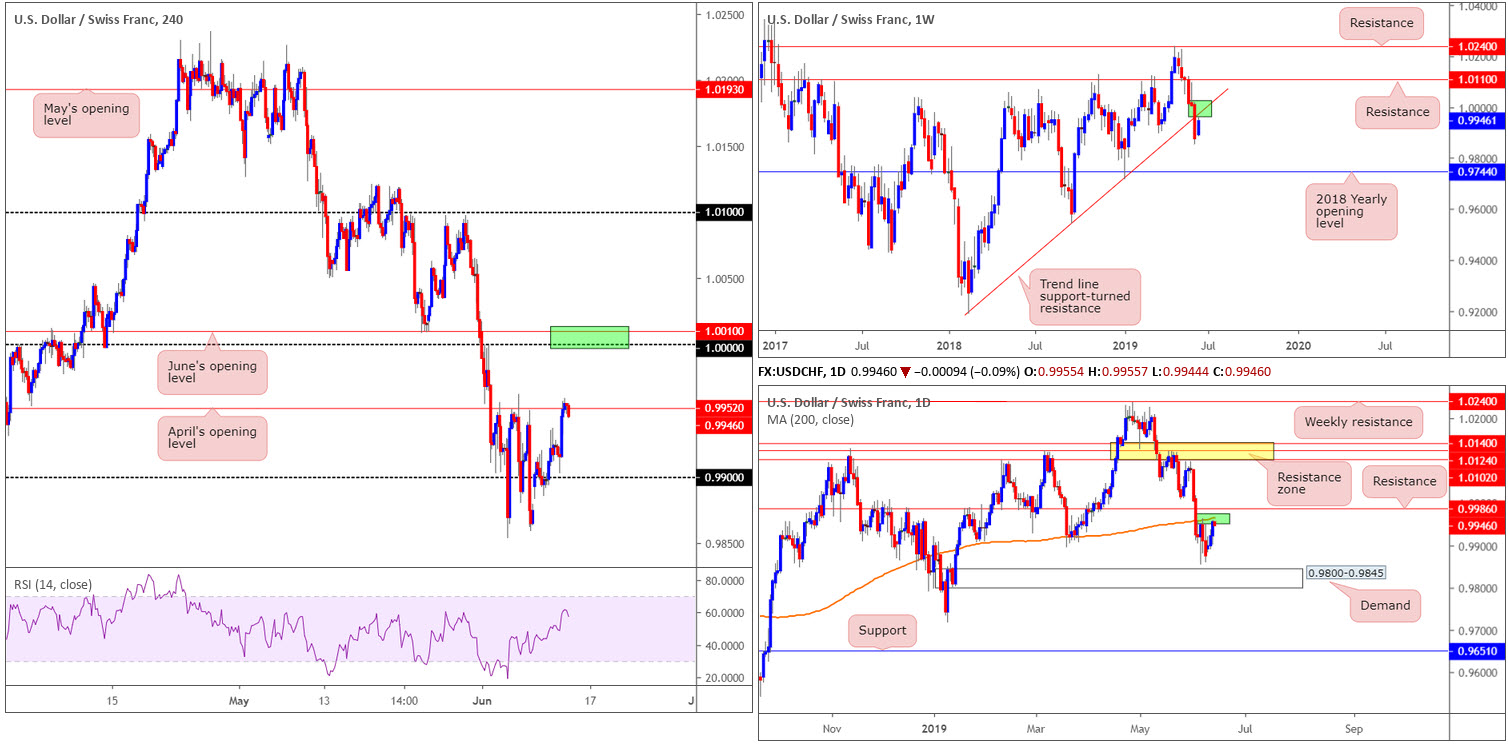
Broad-based USD bidding elevated the USD/CHF to higher ground Wednesday, consequently crossing swords with H4 resistance at 0.9952 and its aligning 38.2% Fibonacci resistance at 0.9948. In recent hours, the market is in the process of chalking up a H4 bearish candle from this region, which could lead to a move towards the 0.99 handle. However, the more appealing zone of resistance comes in by way of the 1.0000 level (parity) along with June’s opening level at 1.0010.
In terms of where the currency pair is located on the higher timeframes, daily flow is trading within close proximity to its 200-day SMA, currently trading around 0.9965. In conjunction with this movement, weekly activity is also seen within a few points of connecting with a trend line support-turned resistance etched from the low 0.9187. The combination of these two barriers is likely to add a bearish tone to this market, should we reach this high.
Areas of consideration:
Although H4 action is expressing a somewhat bearish air around resistance at 0.9952, selling this level, when higher-timeframe movement may be targeting resistances overhead, is a chancy move, according to our technical studies.
As a result of the above, the research has labelled 1.0000 as a prime location to consider shorts from today/tomorrow. As already highlighted, we have higher-timeframe confluence supporting this barrier, therefore a sizeable response is likely in store. Despite this, round numbers, particularly key levels such as 1.0000, are prone to sizeable whipsaws, or stop runs. Traders are, therefore, recommended to wait and see how H4 price responds from 1.0000 before initiating a position. This could be anything from a H4 bearish candlestick configuration, a lower-timeframe MA crossover or even drilling down to the lower timeframes and attempting to trade local (price action) structure within the zone.
Today’s data points: SNB Monetary Policy Assessment; Swiss Libor Rate; SNB Press Conference.
Dow Jones Industrial Average:
US stocks extended losses Wednesday, a day after snapping a six-day winning streak amid lingering trade tensions and questions over the direction of Federal Reserve policy. The Dow Jones Industrial Average closed 52 points lower, or 0.17%; the S&P 500 also lost 0.21% and the tech-heavy Nasdaq 100 declined 0.55%.
For those who read Wednesday’s briefing you may recall the following:
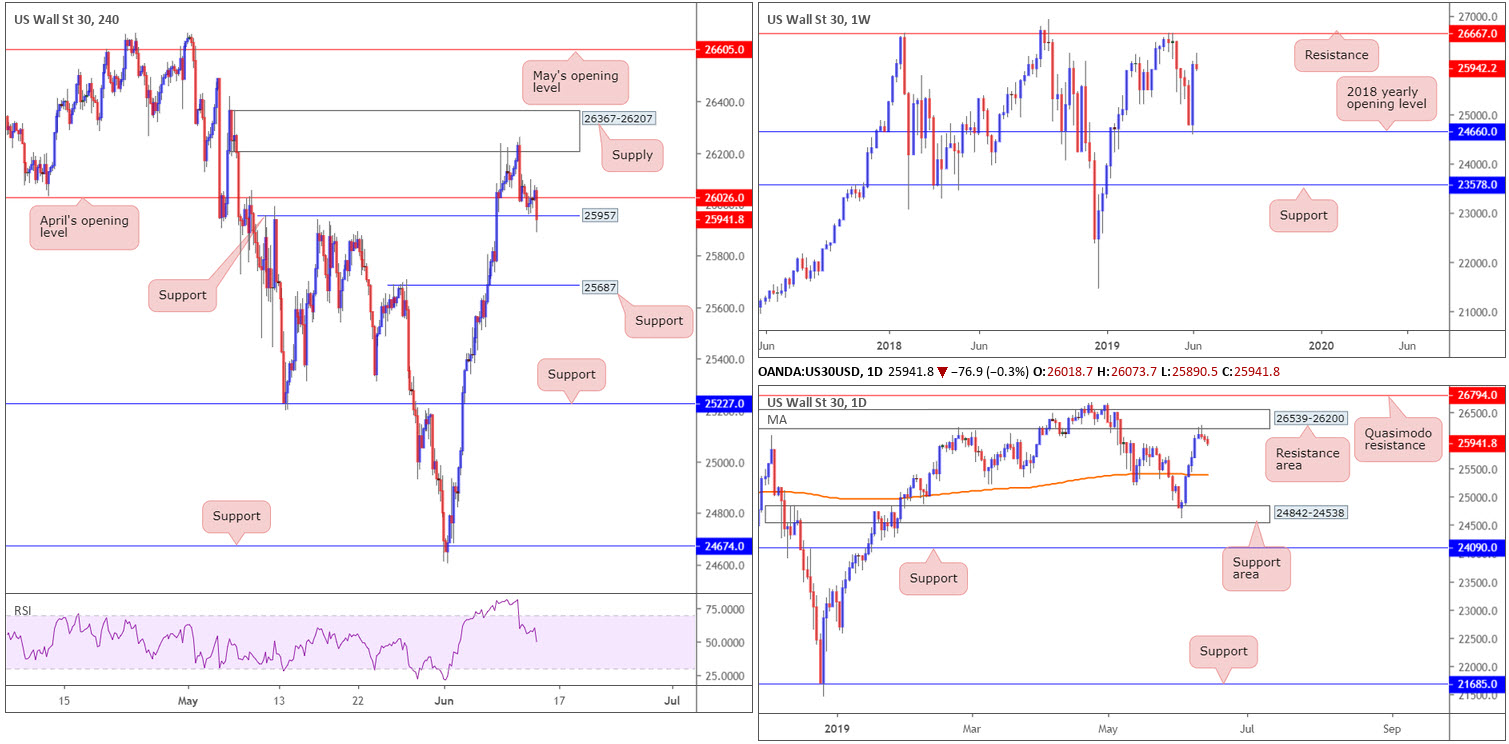
Focus remains around the daily resistance area at 26539-26200, more specifically the H4 supply zone at 26367-26207, for potential shorting opportunities. Well done to any of our readers currently short this market, as price recently engaged with its next downside target: April’s opening level at 26026. For that reason it might be an idea to consider reducing some risk and taking partial profits off the table.
Beyond 26026, traders’ crosshairs are likely fixed on H4 support at 25957, followed by H4 support at 25687, as the next support targets.
As is evident from the H4 timeframe this morning, April’s opening level was taken out and the H4 support at 25957 is under siege. Well done to any of our readers who remain short this market from the aforementioned H4 supply.
While daily flow shows room to continue pressing lower from the resistance area at 26539-26200 towards its 200-day SMA around 25394, it’s worth reminding ourselves where we stand on the weekly timeframe:
Weekly flow recently snapped back more than three weeks’ worth of losses last week off its 2018 yearly opening level at 24660, consequently producing a bullish engulfing pattern. Additional upside from this point has resistance in view at 26667 this week.
Although at this point weekly price meets the characteristics of a nice-looking shooting star formation.
Areas of consideration:
A H4 close beneath H4 support at 25957 potentially unlocks the pathway to H4 support at 58687. Not only does this add additional gains to those short from the aforementioned H4 supply zone, it also opens up the possibility of adding to the position, should the unit retest 25957 as resistance (preferably by way of a H4 or H1 bearish candlestick pattern as this helps structure entry and risk levels).
Today’s data points: Limited.
XAU/USD (GOLD):
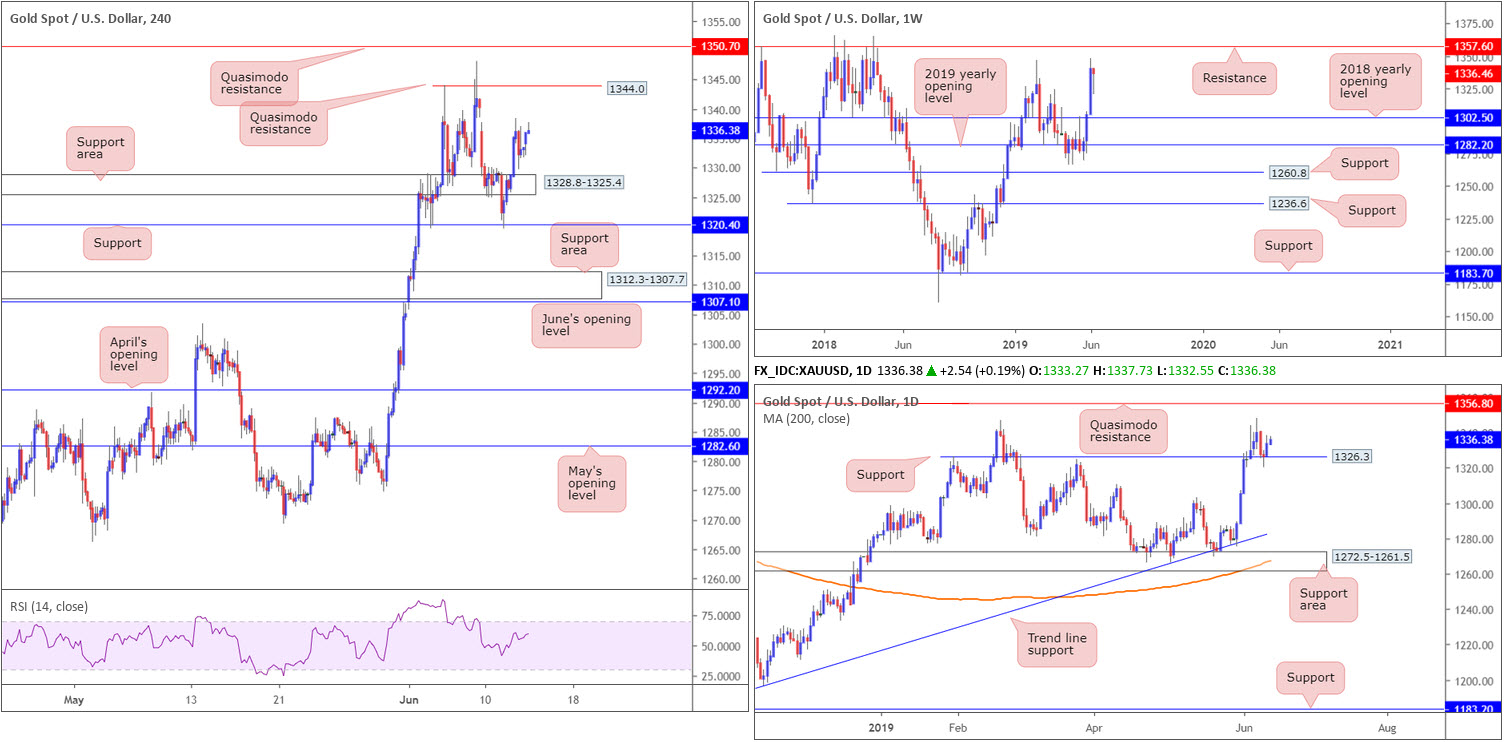
For folks who remain long from H4 support at 1320.4, great work. Reducing risk to breakeven and liquidating a portion of the position is certainly a possibility now.
Traders unsure as to why 1320.4 was a selected buy zone may want to read a piece from Tuesday’s and Wednesday’s reports:
Judging by the lack of enthusiasm out of the H4 support area at 1328.8-1325.4, a test of the H4 support level at 1320.4 could be on the cards today. This will likely trip sell stops and thus provide liquidity to traders looking to buy. To be on the safe side, the research team recommends waiting for additional confirmation to form before committing funds to a position.
Another point Tuesday’s piece made clear was daily support entered the fold around 1326.3, seen plotted within the said H4 support area. Further adding to this was the weekly timeframe fading the 1346.7 Feb 18 high, though also showing room to press beyond this point to resistance at 1357.6.
Areas of consideration:
As our analysis is playing out as expected, Wednesday’s report remains valid in terms of upside targets:
In the event we continue pushing for higher ground, the H4 Quasimodo resistance level at 1344.0 is a logical upside target, followed by the area between 1357.6 and 1350.7 (comprised of the weekly resistance level, the daily Quasimodo resistance level and also the H4 Quasimodo resistance level). The latter also makes for an ideal sell zone, too.
As 1357.6/1350.7 is somewhat small in range, traders are recommended to wait for additional confirmation before committing funds to any short positions, should we reach this high. This could be anything from a H4 bearish candlestick configuration, a lower-timeframe MA crossover or even drilling down to the lower timeframes and attempting to trade local (price action) structure within the zone.
The accuracy, completeness and timeliness of the information contained on this site cannot be guaranteed. IC Markets does not warranty, guarantee or make any representations, or assume any liability with regard to financial results based on the use of the information in the site.
News, views, opinions, recommendations and other information obtained from sources outside of www.icmarkets.com.au, used in this site are believed to be reliable, but we cannot guarantee their accuracy or completeness. All such information is subject to change at any time without notice. IC Markets assumes no responsibility for the content of any linked site. The fact that such links may exist does not indicate approval or endorsement of any material contained on any linked site.
IC Markets is not liable for any harm caused by the transmission, through accessing the services or information on this site, of a computer virus, or other computer code or programming device that might be used to access, delete, damage, disable, disrupt or otherwise impede in any manner, the operation of the site or of any user’s software, hardware, data or property.


