
DXY:
The DXY instrument is currently showcasing a bearish trend, suggesting a potential continuation of this bearish momentum towards the 1st support level.
The 1st support is found at 99.42 and is classified as an overlap support, which could offer considerable stability for the price. The 2nd support level is positioned at 97.72, another overlap support that could provide a safety net in the event of a further price drop.
On the other hand, the 1st resistance level is situated at 100.84, acting as a pullback resistance that could potentially halt upward price movements.
Furthermore, the 2nd resistance level at 101.69, another pullback resistance, could pose a substantial barrier to any bullish price movements.

EUR/USD:
The EUR/USD pair is currently showcasing a bullish trajectory, hinting at the possibility of this bullish trend continuing towards the 1st resistance level.
The 1st support is established at 1.1095 and serves as a pullback support, likely offering considerable stability for the price. In the event of a further decrease, the 2nd support level, placed at 1.1007, acts as an overlap support and could provide a safety cushion.
On the flip side, the 1st resistance level is found at 1.1183 and is identified as a swing high resistance. It coincides with a 100% Fibonacci projection and a 127.20% Fibonacci extension, implying a Fibonacci confluence that could notably reinforce this resistance level.
If the price manages to break through this level, it could potentially target the 2nd resistance level at 1.1285. This level, labelled as an overlap resistance, might pose a significant obstacle to further price hikes.

EUR/JPY:
The EUR/JPY instrument currently demonstrates a bullish momentum. There is potential for the price to make a bullish bounce off the 1st support and head towards the 1st resistance.
The 1st support level is located at 153.43 and is considered significant as it represents a swing low support and aligns with the 38.20% Fibonacci retracement. The 2nd support level is positioned at 151.68 and is recognized as a strong support level. It represents an overlap support and aligns with the 50% Fibonacci retracement.
Moving on to the resistance levels, the 1st resistance is found at 155.32 and is deemed significant. It represents an overlap resistance and aligns with the 38.20% Fibonacci retracement. The 2nd resistance level is situated at 156.66 and is considered noteworthy as it represents another overlap resistance, along with the 78.60% Fibonacci retracement.

EUR/GBP:
The EUR/GBP instrument currently exhibits a bullish momentum. There is potential for the price to make a bullish continuation towards the 1st resistance.
The 1st support level is located at 0.8522 and is considered significant as it represents an overlap support. The 2nd support level is positioned at 0.8489 and is recognized as a strong support level. It represents another overlap support.
Moving on to the resistance levels, the 1st resistance is found at 0.8583 and is deemed significant as it represents a swing high resistance. The 2nd resistance level is situated at 0.8637 and is considered noteworthy. It represents an overlap resistance, along with a 161.80% Fibonacci extension.

GBP/USD:
The GBP/USD pair is presently exhibiting a bullish momentum, with the potential for a bearish reaction off the 1st resistance leading to a drop towards the 1st support level.
The 1st support level is located at 1.2847 and acts as a pullback support, providing a possible level of price stability. A further drop could be cushioned by the 2nd support level at 1.2753, identified as an overlap support.
However, if the price bounces upwards, it might face the 1st resistance level at 1.2999. This pullback resistance coincides with a 78.60% Fibonacci projection and a 161.80% Fibonacci extension, indicating a Fibonacci confluence that strengthens this resistance level.
If the price overcomes this level, it could aim for the 2nd resistance level at 1.3143, characterized as a swing high resistance, which could pose a significant barrier to further price increases.

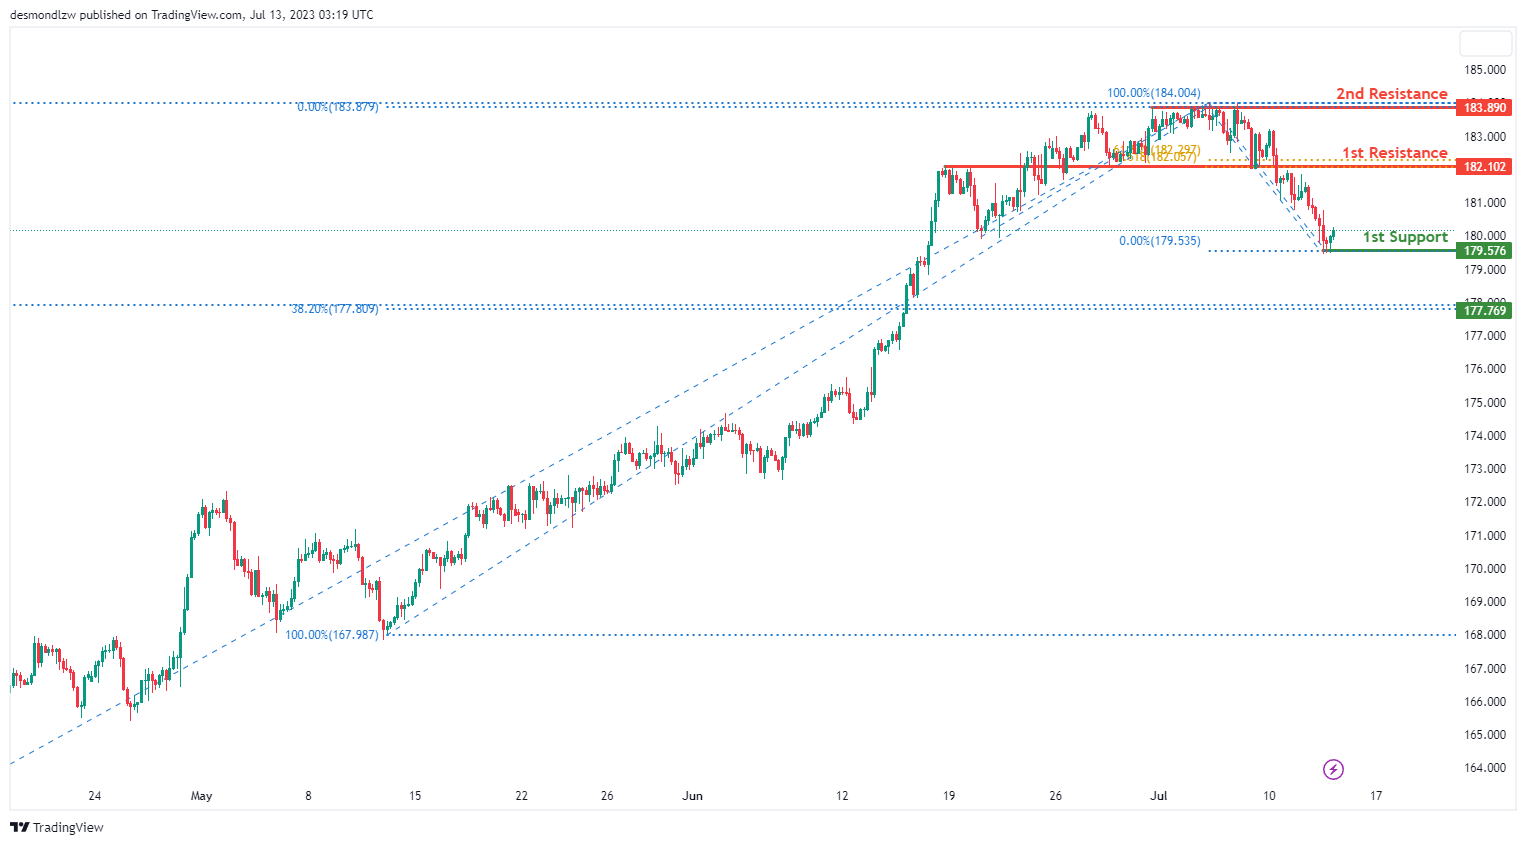
GBP/JPY:
The GBP/JPY instrument currently exhibits a bullish momentum. There is potential for the price to make a bullish bounce off the 1st support and head towards the 1st resistance.
The 1st support level is located at 179.57 and is considered significant as it represents a swing low support. The 2nd support level is positioned at 177.76 and is recognized as a strong support level. It represents a swing low support and aligns with the 23.60% and 38.20% Fibonacci retracement levels, indicating a Fibonacci confluence.
Moving on to the resistance levels, the 1st resistance is found at 182.10 and is deemed significant. It represents an overlap resistance and aligns with the 61.80% Fibonacci retracement and the 61.80% Fibonacci projection, indicating a Fibonacci confluence. The 2nd resistance level is situated at 183.89 and is considered noteworthy as it represents a multi-swing high resistance.
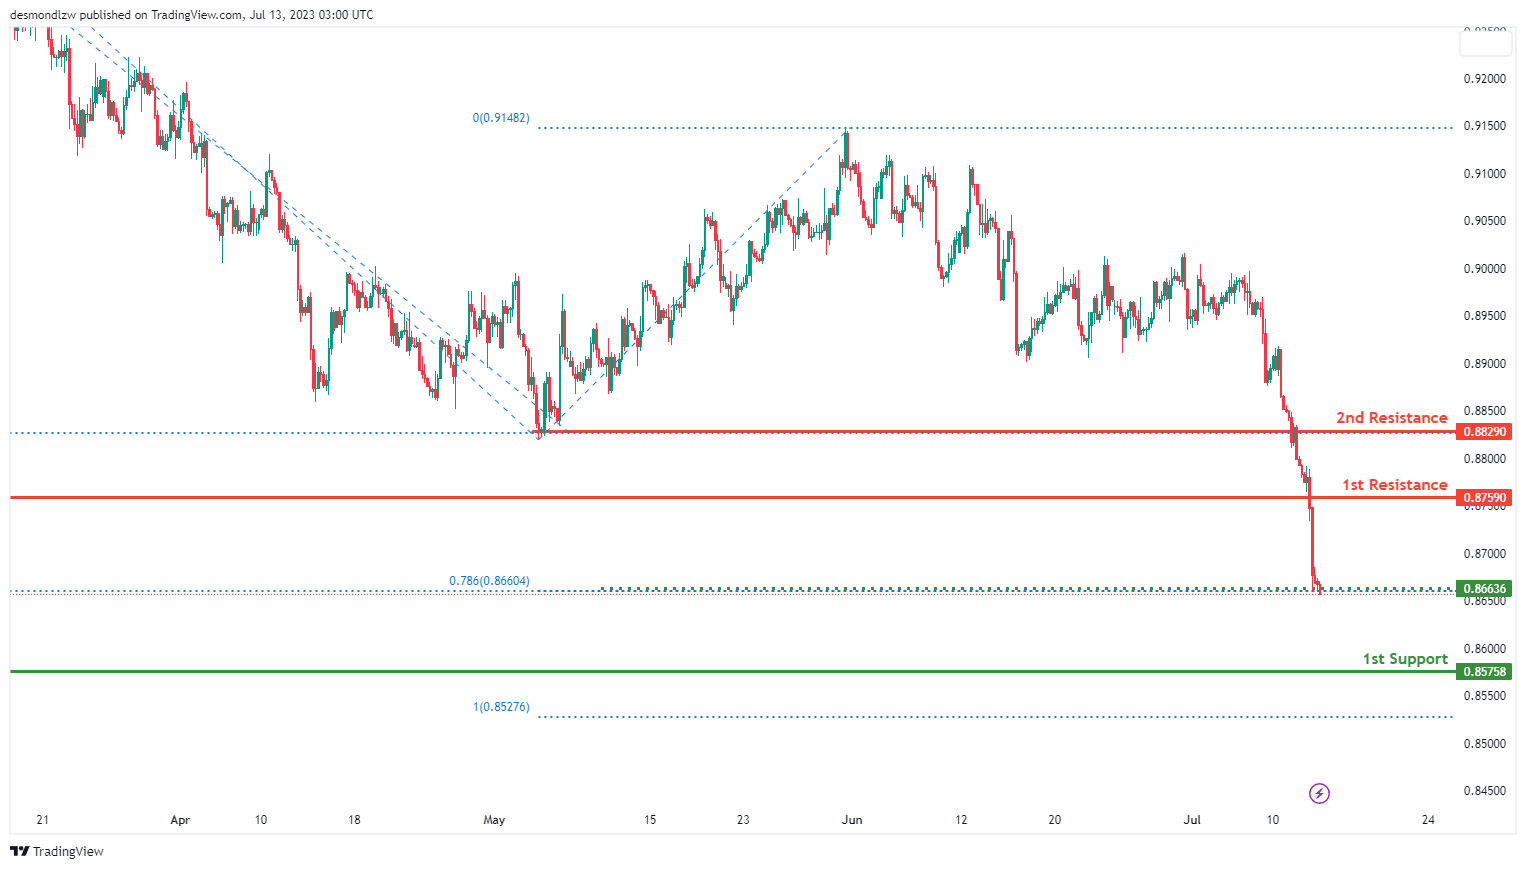
USD/CHF:
The USD/CHF pair is currently showing a bearish momentum, suggesting a potential continuation of this bearish trend towards the 1st support level.
The 1st support level is situated at 0.8575, characterized as a swing low support, which could provide a significant level of price stability. The intermediate support level at 0.8663, aligns with a 78.60% Fibonacci projection and a -27% Fibonacci expansion, signifying a Fibonacci confluence that reinforces this support level.
On the other hand, the price might encounter resistance at the 1st level of 0.8759, acting as a pullback resistance that might provide a challenge to any bullish trend.
If the price manages to surpass this resistance, it might aim for the 2nd resistance level at 0.8829, classified as a swing high resistance, which could serve as a significant hurdle to further price ascents.
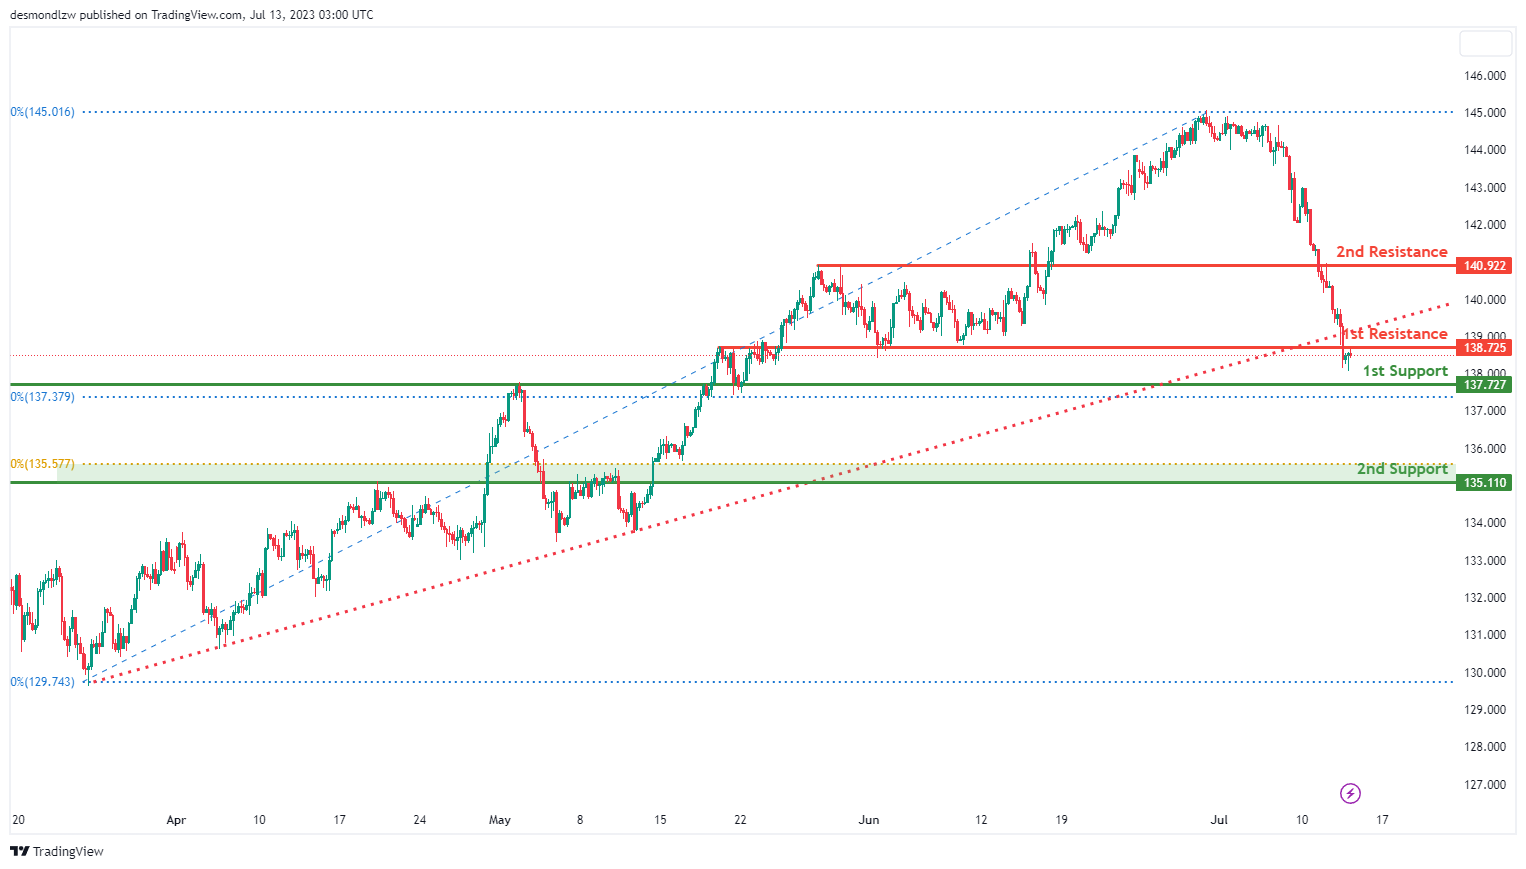
USD/JPY:
The USD/CHF pair is currently showing a bearish trend, triggered by a break below an ascending support line, suggesting a potential bearish continuation towards the 1st support level.
The 1st support level is situated at 137.72, characterized as an overlap support, coinciding with a 50% Fibonacci retracement, thus offering a significant level of price stability. Further down, the 2nd support level is at 135.11, another overlap support, aligning with a 61.80% Fibonacci retracement, reinforcing its significance.
On the upside, if the price starts to reverse, the 1st resistance level at 138.72, acting as a pullback resistance, could pose a significant challenge to the price advance.
If the price manages to breach this level, it might aim for the 2nd resistance level at 140.92, classified as an overlap resistance, which could serve as a potential hurdle to further price ascents.
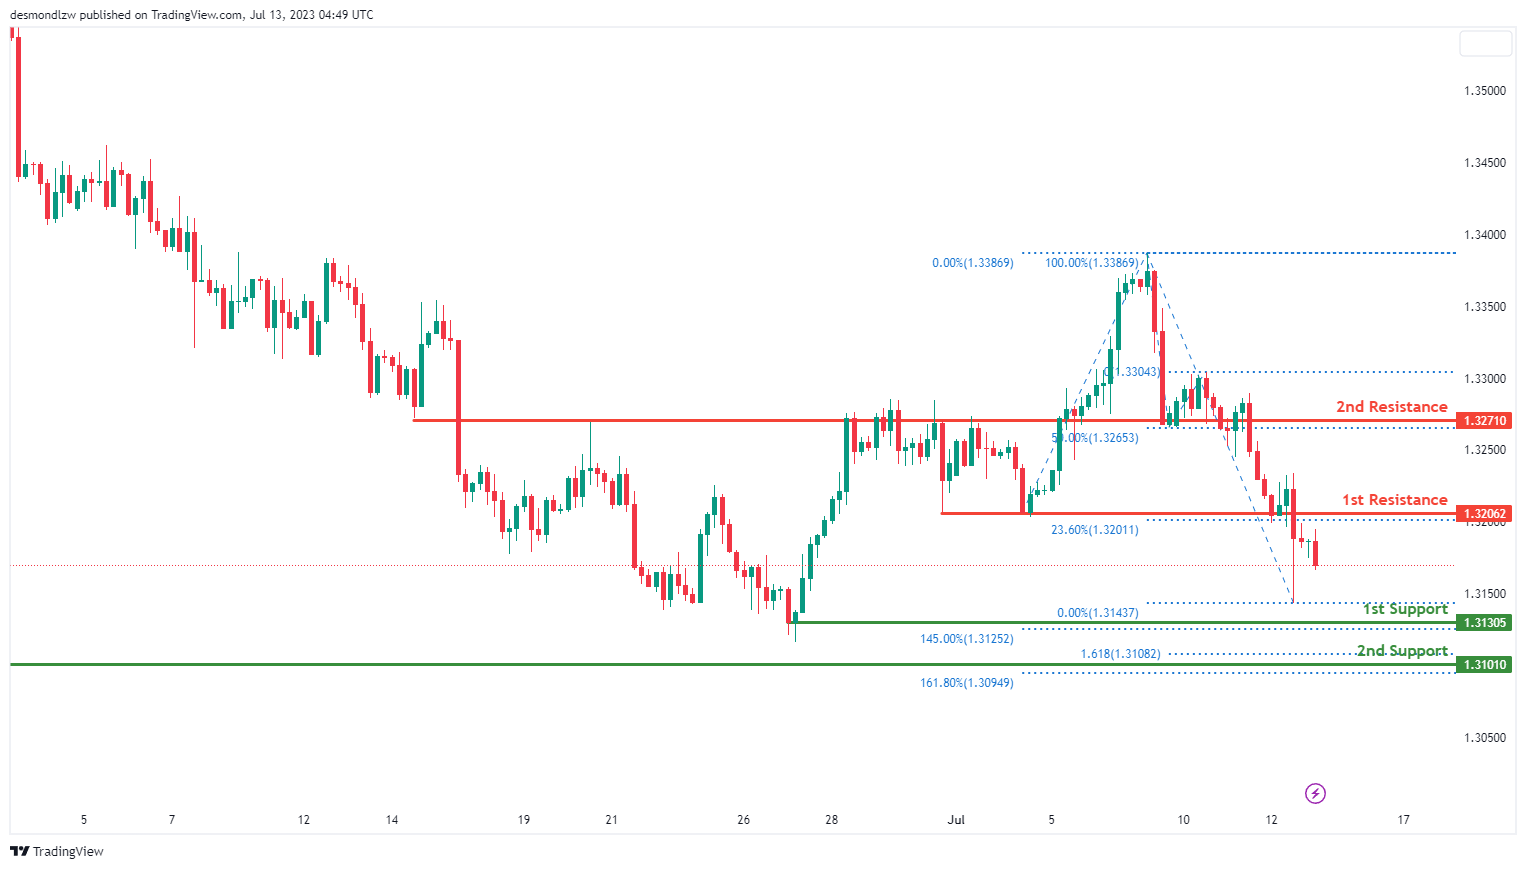
USD/CAD:
The USD/CAD pair is currently demonstrating a bearish trend, implying a potential bearish continuation towards the 1st support level.
The 1st support level stands at 1.3131 and is recognized as an overlap support that aligns with a 145.00% Fibonacci extension level, providing significant stability for the price. The 2nd support level at 1.3101, another overlap support, coincides with the 161.80% Fibonacci extension and 161.80% Fibonacci projection levels. The confluence of these Fibonacci levels adds robustness to this support level.
In contrast, the 1st resistance level is found at 1.3206, identified as an overlap resistance that also aligns with a 23.60% Fibonacci retracement level. This level could pose a significant hurdle to any upward price movements.
Further resistance might be encountered at the 2nd resistance level of 1.3271, which is an overlap resistance and coincides with a 50% Fibonacci retracement, offering another substantial barrier to price increases.
AUD/USD:
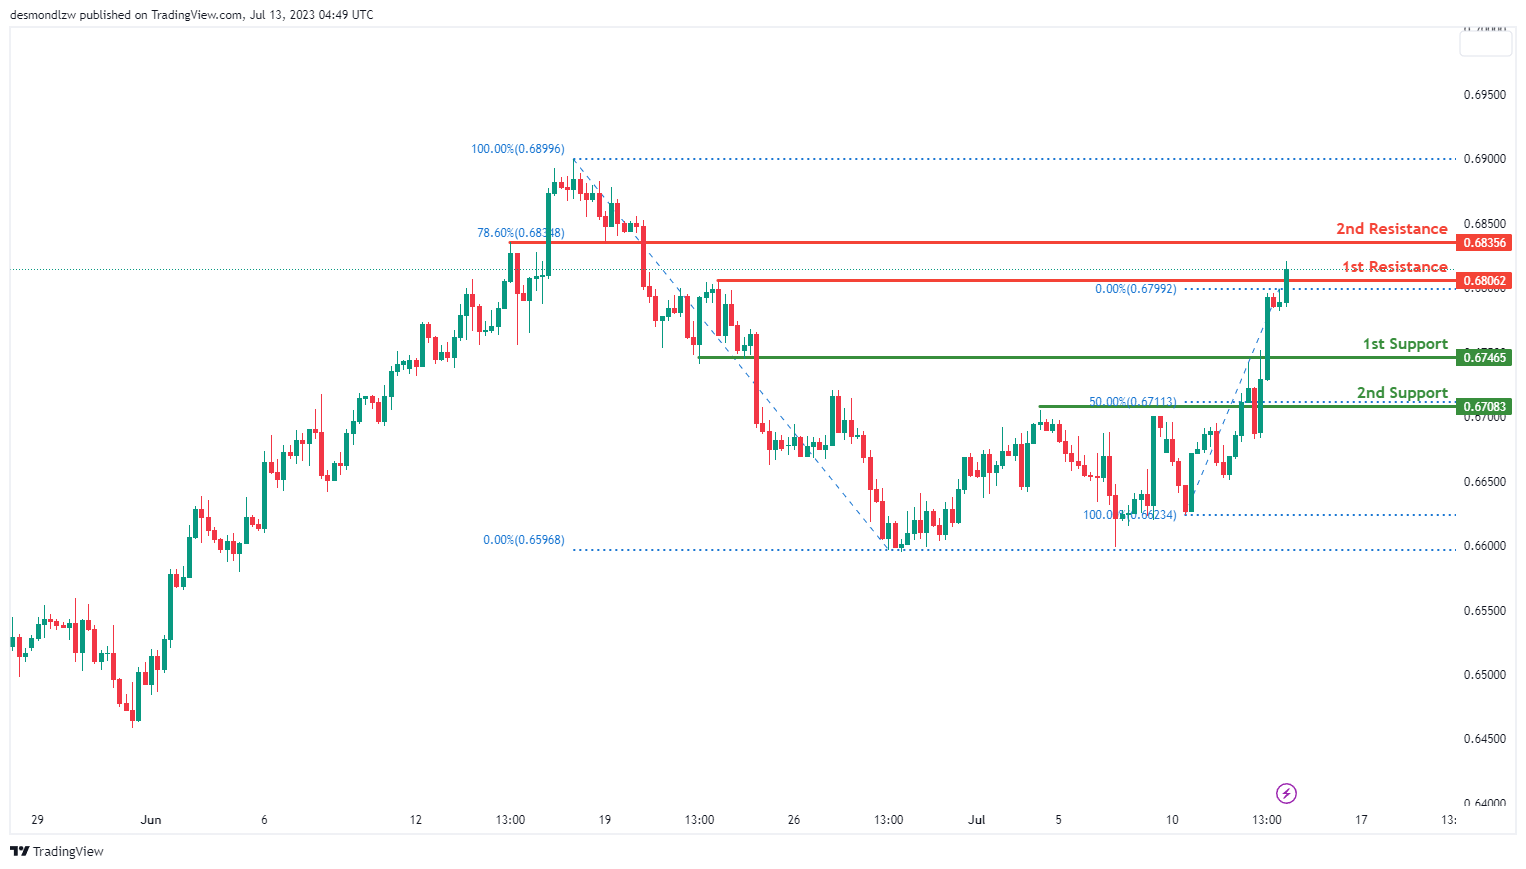
The AUD/USD pair is presently showing a bullish trend, suggesting a potential bullish continuation towards the 2nd resistance level.
The 1st support level is positioned at 0.6747, serving as an overlap support, offering significant stability for the price. The 2nd support level is situated at 0.6708, which is another overlap support, coinciding with a 50% Fibonacci retracement level, strengthening its role as a protective layer for the price.
Conversely, the price may continue its bullish movement towards the 2nd resistance level at 0.6836 after breaking through the 1st resistance at 0.6806, which was an overlap resistance. This 2nd resistance level, identified as an overlap resistance, aligns with a 78.6% Fibonacci retracement level, strengthening its importance.
NZD/USD
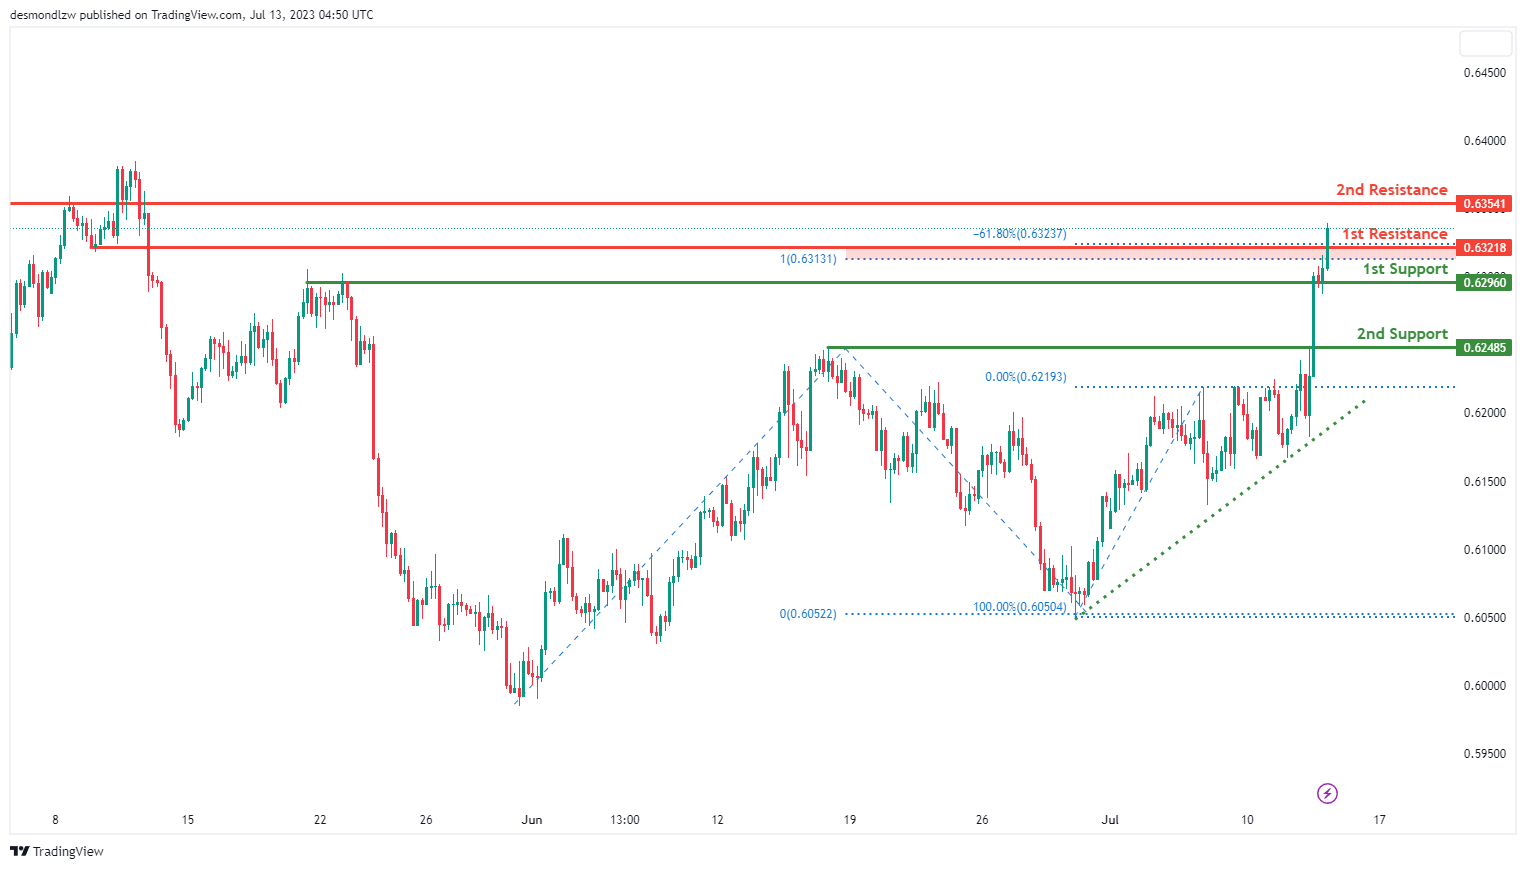
The NZD/USD pair currently exhibits a bullish momentum, indicating a possible bullish continuation towards the 2nd resistance level.
The 1st support level is set at 0.6296, acting as an overlap support, which provides a significant level of price stability. Further, the 2nd support level is found at 0.6249, functioning as another overlap support, offering additional assurance for potential price dips.
On the upside, the price may continue its bullish trend towards the 2nd resistance level at 0.6354 after breaking above the 1st resistance at 0.6322, which is an overlap resistance that aligns with a confluence of Fibonacci levels i.e. the -61.80% Fibonacci expansion and 100.00% Fibonacci projection levels, bolstering its significance.
DJ30:
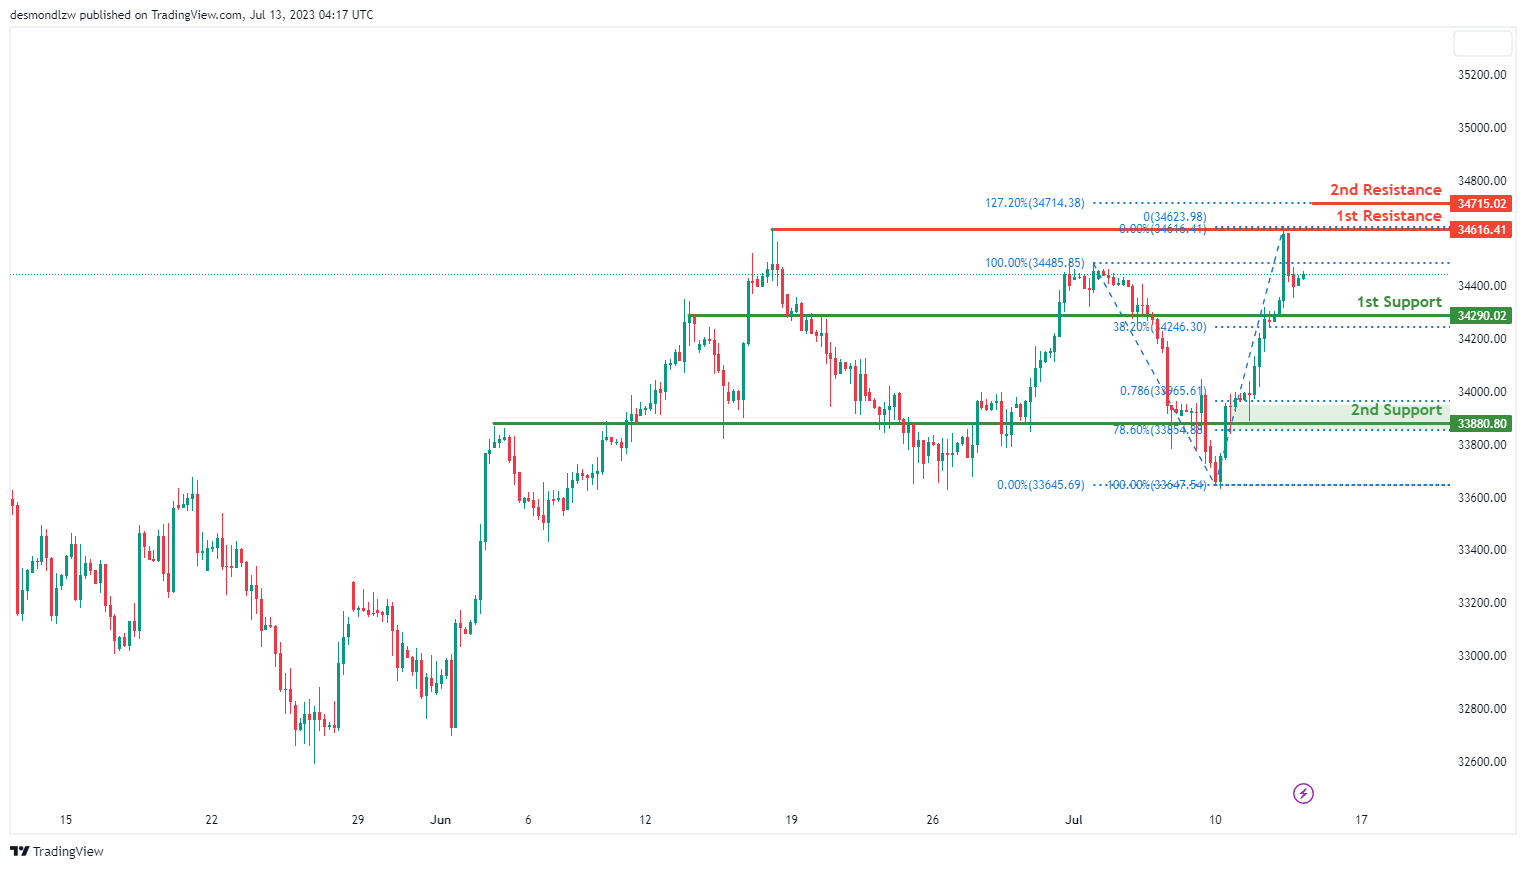
The DJ30 (Dow Jones Industrial Average) chart currently exhibits a bullish momentum. There is potential for the price to continue its upward movement towards the 1st resistance.
The 1st support level is located at 34290.0 and is considered significant as it represents an overlap support and aligns with the 38.20% Fibonacci retracement.
The 2nd support level is positioned at 33880.8 and is recognized as a strong support level. It represents an overlap support and aligns with the 78.60% Fibonacci retracement and the 78.60% Fibonacci projection, indicating a Fibonacci confluence.
Moving on to the resistance levels, the 1st resistance is found at 34616.4 and is deemed significant due to its role as a multi-swing high resistance. The 2nd resistance level is situated at 34733.2 and is considered noteworthy as it is situated at the 127.20% Fibonacci extension.
GER30:
The GER30 (DAX) chart currently exhibits a bullish momentum. There is potential for the price to continue its upward movement towards the 1st resistance.
The 1st support level is located at 15862.2 and is considered significant as it represents a pullback support. The 2nd support level is positioned at 15693.1 and is recognized as a strong support level due to its pullback support characteristics.
Moving on to the resistance levels, the 1st resistance is found at 16206.0 and is significant as it represents a swing high resistance. The 2nd resistance level is situated at 16413.4 and is considered noteworthy as it represents another swing high resistance, along with a 127.20% Fibonacci extension.
Additionally, there is an intermediate resistance level at 16064.1, which is considered significant due to its overlap resistance and its correlation with the 78.60% Fibonacci retracement level.

US500
The US500 (S&P 500) chart currently demonstrates a bullish momentum. There is potential for the price to continue its upward movement towards the 1st resistance.
The 1st support level is located at 4456.0 and is considered significant as it represents a pullback support. The 2nd support level is positioned at 4379.3 and is recognized as a strong support level. It represents an overlap support and aligns with the 61.80% Fibonacci retracement level.
Moving on to the resistance levels, the 1st resistance is found at 4510.6. This resistance level is considered significant as it represents a swing-high resistance level, a 161.80% Fibonacci extension, and a 100% Fibonacci projection, indicating a Fibonacci confluence.

BTC/USD:
The BTC/USD instrument is currently showing a neutral overall momentum. It’s conceivable that the price might fluctuate between the 1st support and 1st resistance levels. The 1st support is positioned at 29826 and is viewed as strong due to its overlap support and a 23.60% Fibonacci Retracement.
The 2nd support, found at 28274, is also considered robust due to its overlap support and a 50% Fibonacci Retracement.
On the other hand, the 1st resistance is located at 31457 and is deemed significant owing to its multi-swing high resistance and a 61.80% Fibonacci Projection. The 2nd resistance, at 32252, is notable for its swing high resistance nature, which could potentially pose a significant obstacle for any upward movement in price.

ETH/USD:
The ETH/USD instrument is currently on a bearish trend, largely attributed to the price trading below the bearish Ichimoku cloud.
As the trend proceeds, it’s probable that the price might continue on this bearish direction towards the 1st support, positioned at 1826.24. This support level is regarded as strong due to its character as a multi-swing low support.
Further on, the 2nd support stands at 1763.33 and is considered strong due to its overlap support and a 61.80% Fibonacci Retracement.
On the other hand, the 1st resistance is positioned at 1916.21 and is recognized as significant due to its overlap resistance and a 61.80% Fibonacci Retracement. The 2nd resistance, found at 1975.62, is also notable as it represents swing high resistance, and could potentially pose an obstacle to any upward price movements.
An intermediate support level is also noticeable at 1846.13, recognized as durable due to its status as a multi-swing low support.

WTI/USD:
The WTI/USD chart is currently demonstrating bullish momentum, suggesting a potential continuation of this trend towards the 1st resistance level.
The 1st support level is at 74.25, characterized as an overlap support that provides a considerable level of price stability. A 2nd layer of support lies at 72.78, defined as another overlap support, and also aligns with a 38.20% Fibonacci retracement level, reinforcing its potential to halt a downward price movement.
On the bullish side, the 1st resistance level is at 76.65. This overlap resistance is significant as it coincides with the 61.80% Fibonacci retracement and 161.80% Fibonacci projection levels (Fibonacci confluence), adding to its potential to hinder upward price movement.
Should the price manage to breach the 1st resistance, it could then aim for the 2nd resistance level at 78.93. This overlap resistance stands as another potential barrier to further price ascents.

XAU/USD (GOLD):
The XAU/USD pair currently exhibits a bullish trend, following a break above a descending resistance line, which suggests a potential bullish continuation towards the 1st resistance level.
On the downside, the 1st support level is found at 1952.62, serving as a pullback support, which could provide substantial stability to the price. Further down, the 2nd support level is located at 1931.62, identified as an overlap support that could potentially cushion any downward price movements.
On the upside, the price may continue its bullish trend towards the 1st resistance level at 1966.68. This resistance level is significant as it represents a multi-swing high resistance.
Should the price surpass this level, the next aim could be the 2nd resistance level at 1980.74, also a multi-swing high resistance, which aligns with a 50% Fibonacci retracement, strengthening its position as a potential barrier to further price increases.

The accuracy, completeness and timeliness of the information contained on this site cannot be guaranteed. IC Markets does not warranty, guarantee or make any representations, or assume any liability regarding financial results based on the use of the information in the site.
News, views, opinions, recommendations and other information obtained from sources outside of www.icmarkets.com, used in this site are believed to be reliable, but we cannot guarantee their accuracy or completeness. All such information is subject to change at any time without notice. IC Markets assumes no responsibility for the content of any linked site.
The fact that such links may exist does not indicate approval or endorsement of any material contained on any linked site. IC Markets is not liable for any harm caused by the transmission, through accessing the services or information on this site, of a computer virus, or other computer code or programming device that might be used to access, delete, damage, disable, disrupt or otherwise impede in any manner, the operation of the site or of any user’s software, hardware, data or property.


