
EUR/USD:
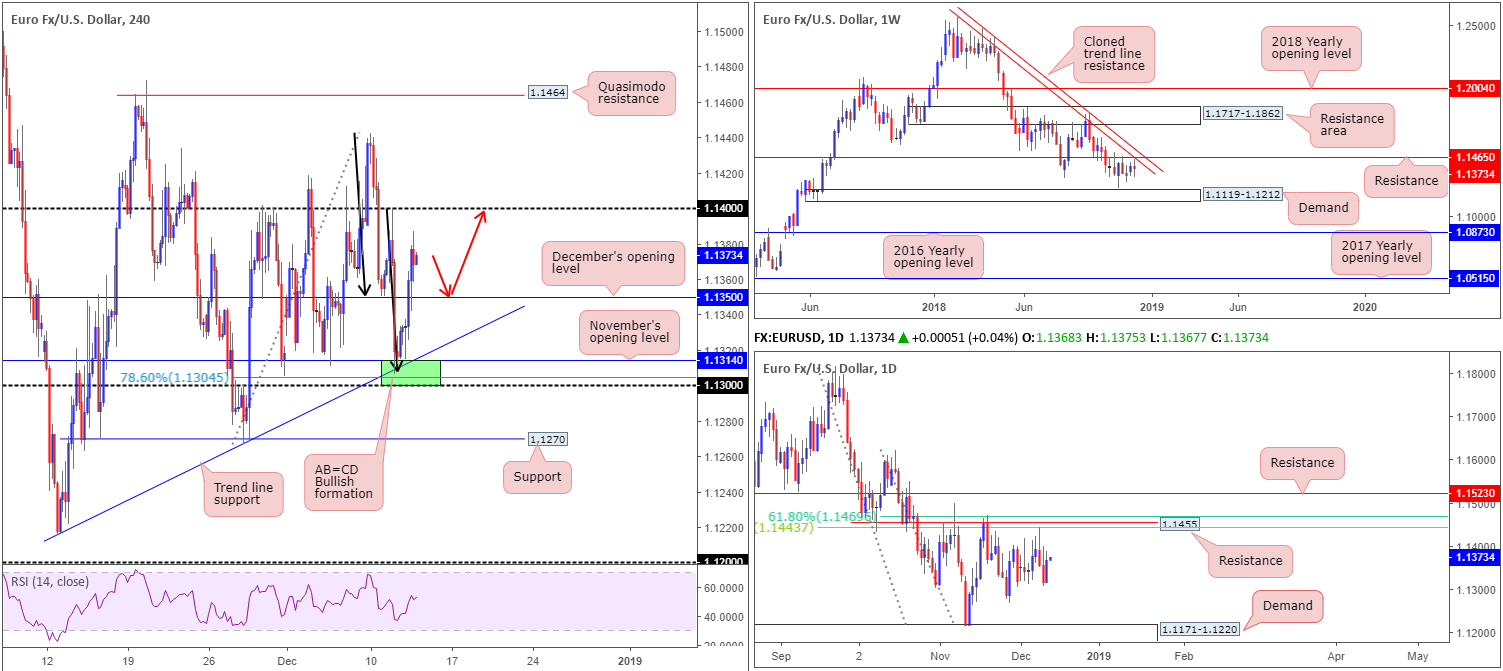
In Wednesday’s briefing the piece underlined a strong interest in the H4 support area seen at 1.13/1.1314 as a possible buy zone (green – comprised of November’s opening level at 1.1314, a trend line support [taken from the low 1.1215], a 78.6% Fibonacci support value at 1.1304, a round number at 1.13 and a complementing AB=CD bullish pattern [black arrows]).
Reinforced by a softer US dollar across the board and more convergence between Italy and the EU on 2019 budget lines, the H4 candles responded beautifully from 1.13/1.1314 Wednesday. Firmly breaking a two-day bearish phase and reaching highs of 1.1387, the pair concluded the day overthrowing December’s opening level at 1.1350, consequently exposing 1.14. Well done to any of our readers who managed to jump aboard this move.
In terms of the higher-timeframe picture, weekly flow remains languishing beneath resistance priced in at 1.1465 that brings with it a nearby cloned trend line resistance (extended from the high 1.2413). It may also interest some traders to note the current weekly candle is emphasizing a somewhat indecisive tone at the moment. A closer reading on the daily timeframe adds a proven base of resistance circulating around the 1.1455 region. What’s appealing here, other than the fact the level capped upside three times in November and is closely linked to the weekly resistance mentioned above at 1.1465, is the merging Fibonacci resistances: a 61.8% and a 38.2% at 1.1469 and 1.1443, respectively.
Areas of consideration:
Having seen room for buyers to extend higher on all three timeframes, a retest play off December’s opening level mentioned above at 1.1350 may be in the offing today (red arrows), targeting 1.14 as the initial take-profit zone (ideal place to think about liquidating partial profits and reducing risk to breakeven), followed by daily resistance at 1.1455 and then weekly resistance at 1.1465.
As for entry, waiting for additional candlestick confirmation to form and entering based on the selected structure is an option, or traders could simply enter at 1.1350 and position stop-loss orders 15-20 pips beneath the level. The former is considered the more conservative route.
Today’s data points: EUR Main Refinancing Rate; ECB Press Conference.
GBP/USD:
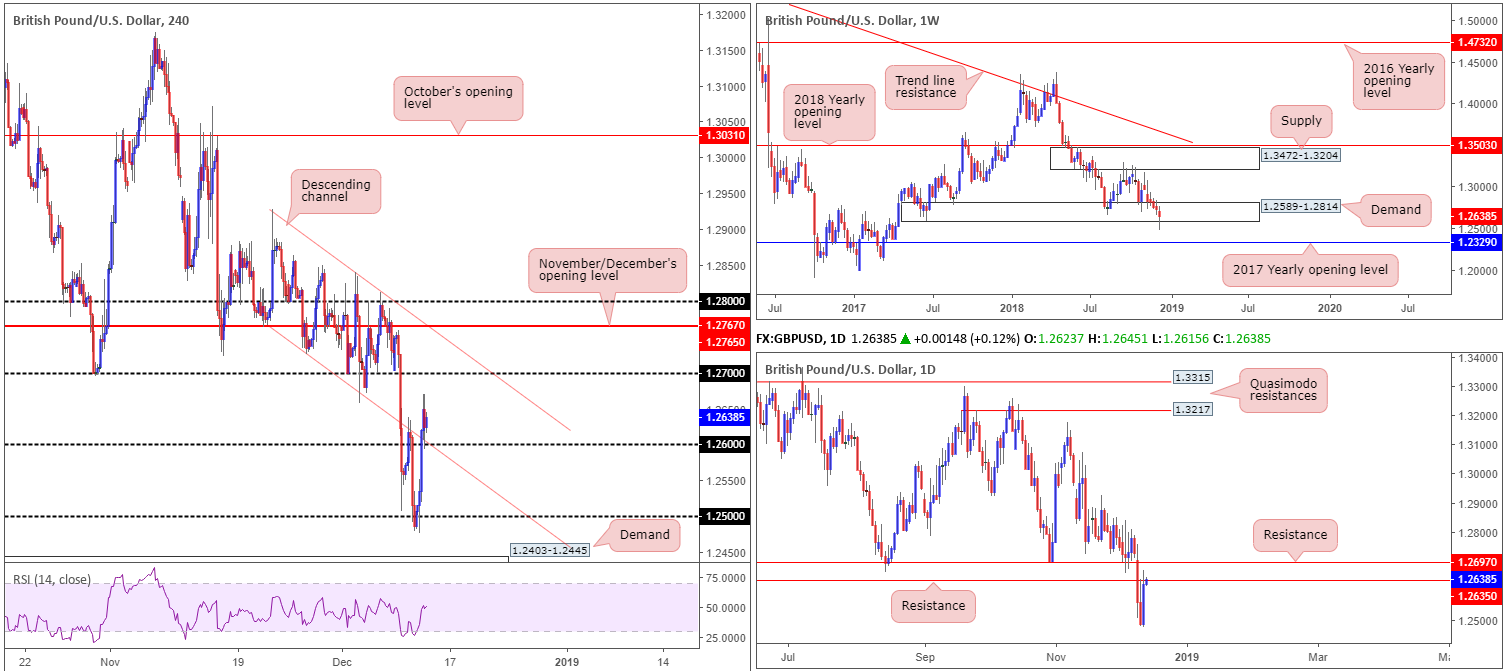
UK PM May survived a no confidence motion against her leadership Wednesday, winning the vote by 200 – 117. The vote represented a comfortable victory. Following the results, sterling turned lower and attempted to reclaim 1.26 to the downside, though finished the day wrapping up at 1.2637, up 1.10% on the day.
Along with maintaining a defense above 1.26, the H4 candles also reclaimed their spot within the descending channel formation (extended from the low 1.2725), highlighting a possible run towards 1.27. Potentially supporting this move is the weekly timeframe, which has price action trading back within the walls of demand at 1.2589-1.2814, despite a recent move beneath its partitions. The outlook on the daily timeframe, nevertheless, shows clear resistance plotted at 1.2635 entered the fold yesterday, shadowed closely by another layer of resistance at 1.2697, consequently placing a question mark on possible buying.
Areas of consideration:
In essence we have the weekly picture showing price attempting to reestablish itself within demand, though buyers are perhaps week here owing to the lower edge recently suffering a break to the downside. Daily structure displays resistance parked at 1.2635, which could pose a problem for weekly buyers and H4 players looking to fade any retest off 1.26 as support today.
Irrespective of the direction one selects, opposing structure is clearly evident. Given the lack of high-probability setups in view, the research team believes neither a long nor short is attractive today.
Today’s data points: Limited.
AUD/USD:
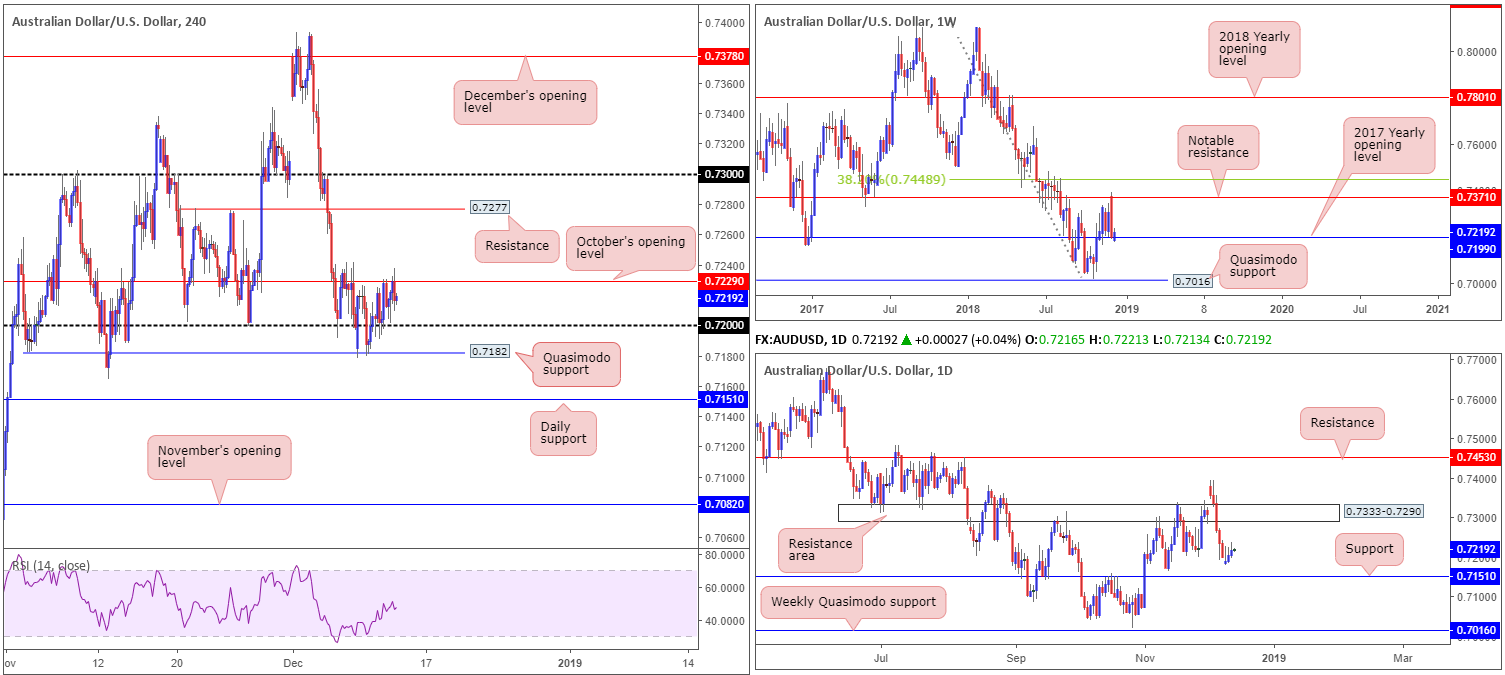
The Australian dollar managed to eke out another marginal gain vs. its US counterpart Wednesday, up 0.17% on the day. H4 movement, as you can see, continues to establish support off its 0.72 level, though is struggling to overthrow October’s opening level priced in at 0.7229. Should we eventually climb above this barrier, the river north appears clear to challenge resistance coming in at 0.7277, followed closely by the 0.73 handle.
The viewpoint from the weekly timeframe remains bullish as long as the 2017 yearly opening level at 0.7199 continues to hold (effectively represents the 0.72 handle on the H4 scale). Daily flow, on the other hand, shows potential to explore higher ground until reaching a reasonably well-defined resistance area at 0.7333-0.7290. Though before we reach this zone, traders also need to be prepared for the possibility of a push lower to bring in buyers from support at 0.7151.
Areas of consideration:
A H4 close above October’s opening level at 0.7229 would, given where we’re coming from on the weekly timeframe, be considered a bullish cue to take things higher. Traders have the choice of simply buying the breakout above 0.7229 with stop-loss orders plotted beneath the breakout candle’s low, or for the more conservative trader, wait and see if price retests 0.7229 as support in the shape of a bullish candlestick pattern and enter on the selected structure. Either way, the first take-profit target resides around the H4 resistance mentioned above at 0.7277.
In regard to selling this market, it remains a challenge due to the 2017 yearly opening level mentioned above at 0.7199 on the weekly timeframe.
Today’s data points: Limited.
USD/JPY:
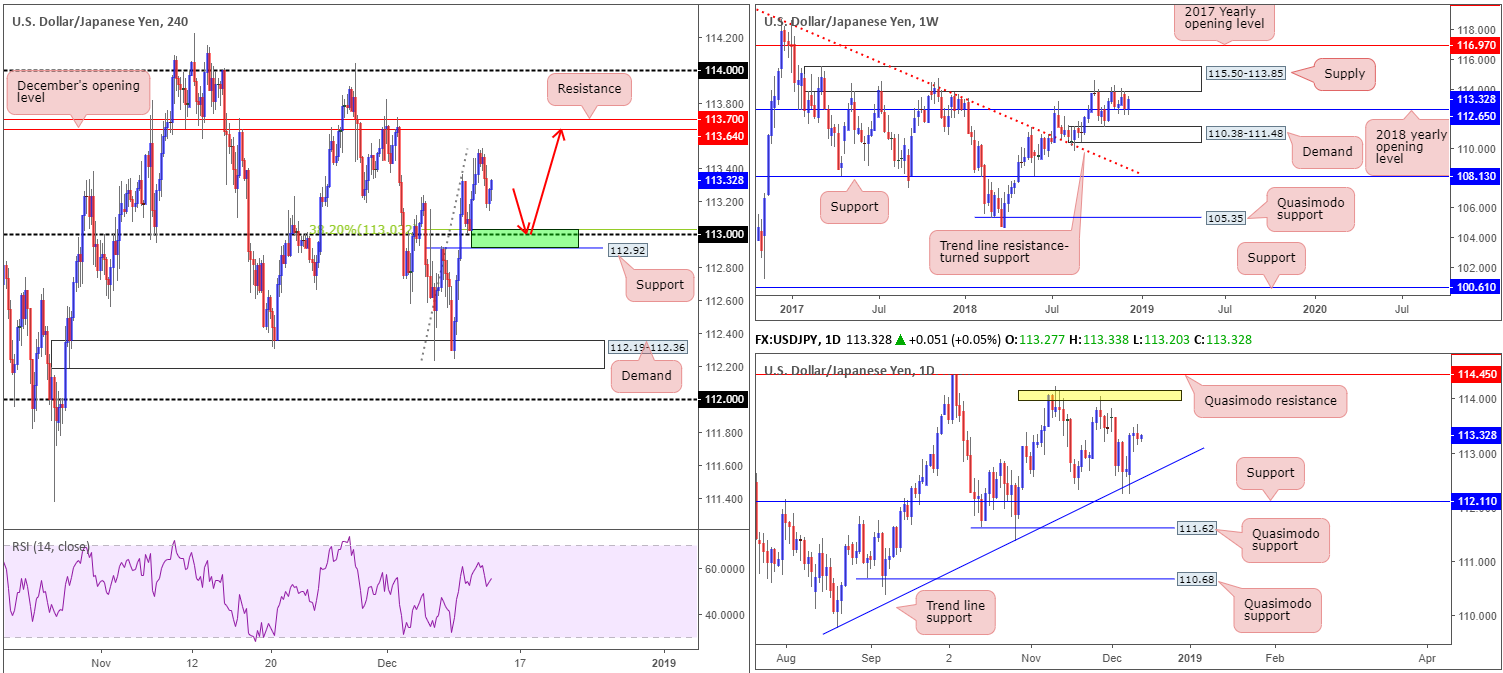
Leaving December’s opening level at 113.64/resistance at 113.70 unchallenged on the H4 timeframe, Wednesday’s movement turned lower and struck lows of 113.14, weighed on by broad-based USD weakness. The 113 handle remains a key level of interest in this market at the moment, which happens to closely converge with a 38.2% Fibonacci support at 113.03 and a local swing support residing at 112.92 (green).
A violation of 112.92/113.03 could lead to a move being seen towards 112.65, a weekly support in the shape of the 2018 yearly opening level. Currently, however, weekly price appears poised to press for higher ground, targeting nearby weekly supply at 115.50-113.85. The daily timeframe, on the other hand, displays slightly more room for maneuver it seems. The candles have tops located around the 114.05ish neighbourhood (yellow) in view as a possible upside resistance, though a move lower to retest trend line support (etched from the low 109.77) is just as likely, according to structure.
Areas of consideration:
Having observed and noted both weekly and daily timeframes exhibit space to explore higher levels, a retest play off the small H4 green zone at 112.92/113.03 is a consideration in today’s sessions. As the area is somewhat narrow, traders are urged to avoid the temptation of trading this zone without at least additional candlestick confirmation. The reason for this is due to round numbers often falling victim to stop runs (or fakeouts). Aside from potentially evading a possible fakeout, entering on the back of a bullish candlestick configuration provides a structure in terms of entry/stop parameters and also displays whether or not buyer interest is present.
As for upside targets out of 112.92/113.03, December’s opening level at 113.64/resistance at 113.70 on the H4 timeframe are in sight, followed closely by 113.85: the underside of the weekly supply zone.
Today’s data points: Limited.
USD/CAD:
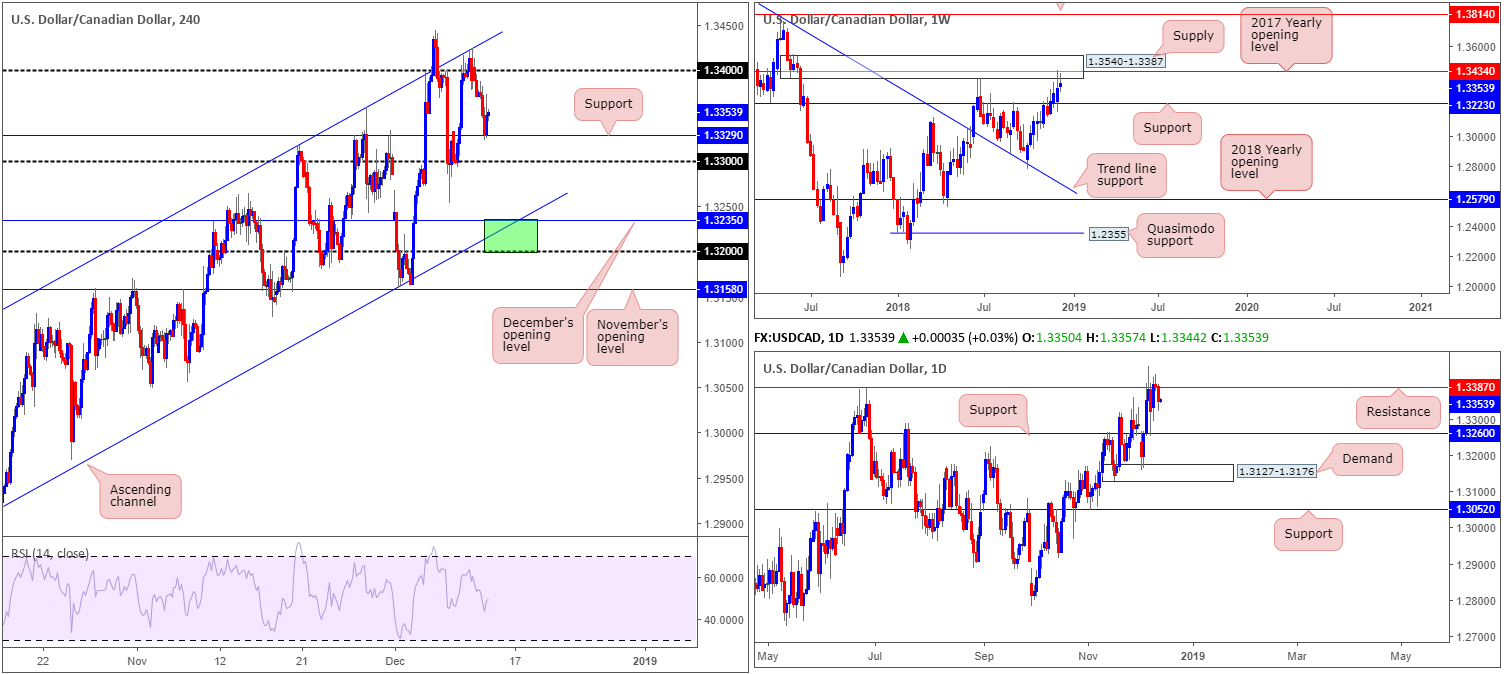
As anticipated, following a strong H4 bearish candle forming sub 1.34 in early Asia Wednesday, the USD/CAD pressed for lower levels until reaching H4 support coming in at 1.3329. This was a noted move to keep an eye open for in Wednesday’s briefing, so well done to any of our readers who managed to jump aboard here.
Despite H4 support holding ground into yesterday’s close, further downside could still be upon us. The research team notes weekly price challenging supply at 1.3540-1.3387/the 2017 yearly opening level at 1.3434, and daily movement turning lower from 1.3387: a resistance level.
Selling at current price, however, would be a chancy move, knowing we have active buyers interested off H4 support mentioned above at 1.3329. Yet, even with a decisive H4 close beneath this barrier and the 1.33 handle, traders would immediately face support from the daily timeframe at 1.3260 (the next downside target on the daily scale). Therefore, selling sub 1.33 is challenging.
Areas of consideration:
Ultimately, December’s opening level at 1.3235 and its merging H4 channel support (etched from the low 1.2916) is a location active buyers likely reside. This is due to its close connection with higher-timeframe supports. Daily support, as we already know, resides around 1.3260, though we also have weekly support coming in at 1.3223 which forms the next downside target on the weekly scale.
On account of the above reading, the green zone on the H4 timeframe at 1.32/1.3235 is an area worthy of attention for possible long trades today/tomorrow, with an initial upside target set at 1.33. Conservative traders may elect to enter on the back of candlestick confirmation, while more aggressive traders might opt to simply enter long from 1.3235 and position stops a couple of pips beneath 1.32.
Today’s data points: Limited.
USD/CHF:
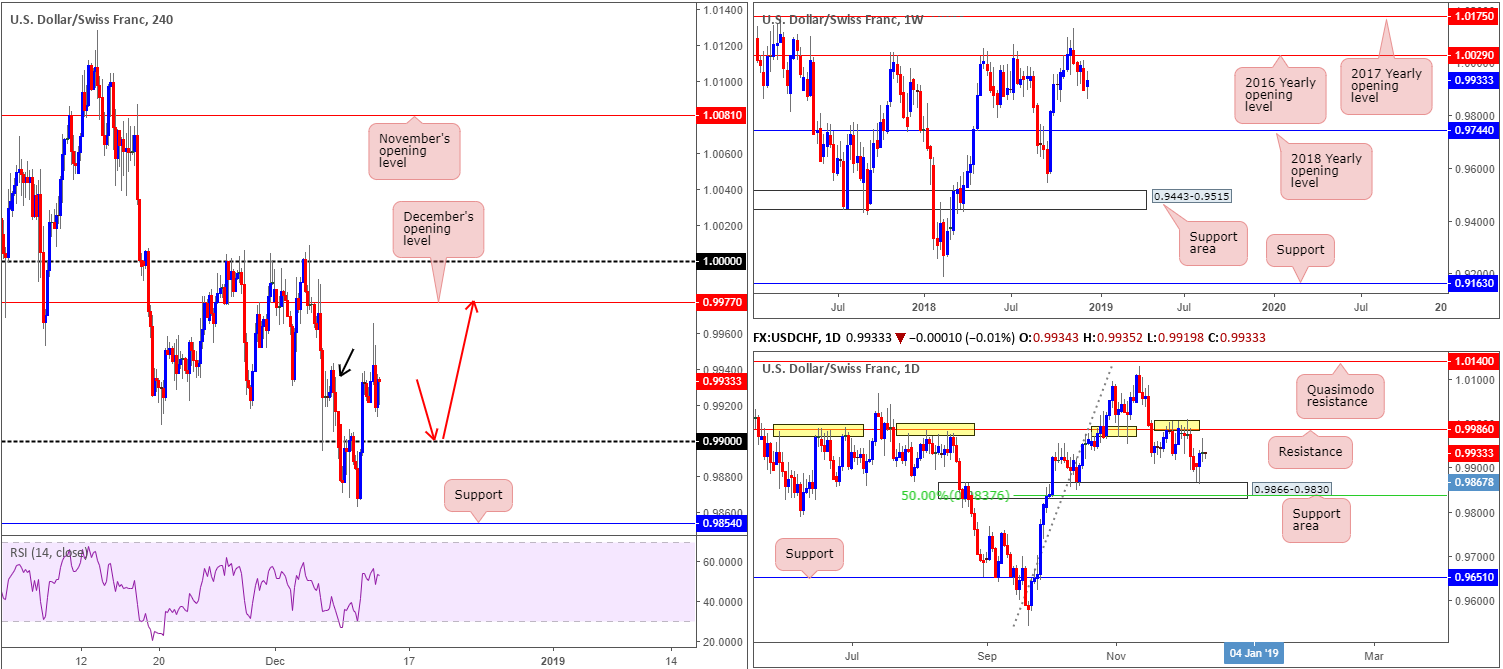
USD/CHF prices are effectively unchanged this morning, despite ranging in excess of 50 pips Wednesday. In view of the lackluster close, a large portion of today’s report will echo thoughts put forward in yesterday’s analysis.
With H4 supply marked with a black arrow at 0.9943-0.9926 largely consumed by yesterday’s movement, the runway north is potentially free of major resistance until reaching December’s opening level at 0.9977.
Higher-timeframe structure shows daily flow has space to press towards resistance plotted at 0.9986, following a strong recovery off a support area at 0.9866-0.9830 Tuesday. Weekly flow, on the other hand, has room to trade as far north as 1.0029: the 2016 yearly opening level, while to the downside active support does not enter the fold until 0.9744: the 2018 yearly opening level.
Areas of consideration:
Having seen H4 price take out the H4 supply mentioned above at 0.9943-0.9926, along with both weekly and daily timeframes displaying room to climb higher, a retest off of 0.99 today in the shape of a bullish candlestick configuration (entry/stop parameters can be defined according to this pattern) would likely be enough to justify a long position in this market.
As for upside targets, the research team feels December’s opening level at 0.9977 is a reasonable objective, trailed closely by daily resistance at 0.9986 and then 1.0000 (parity) on the H4 timeframe.
Today’s data points: SNB Monetary Policy Assessment and Libor Rate; SNB Press Conference.
Dow Jones Industrial Average:
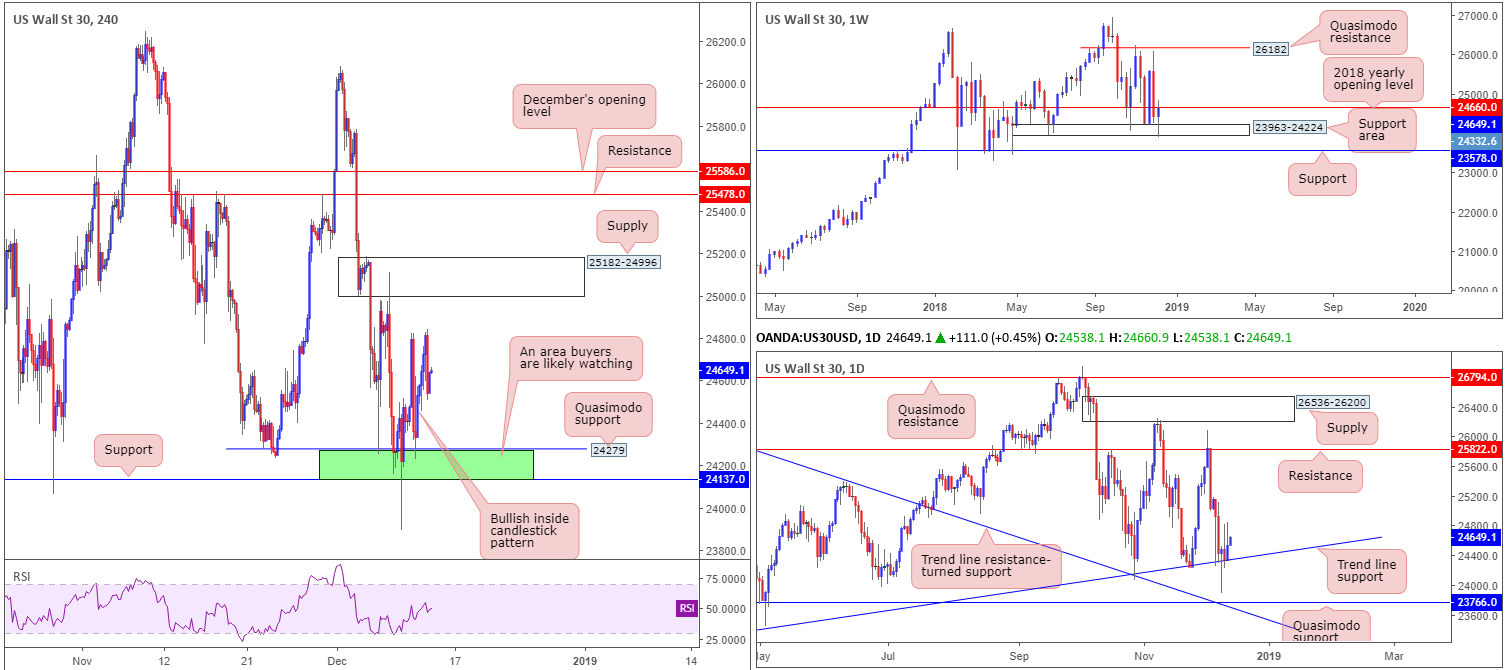
Kicking this morning’s report off from the top, the index is currently challenging the underside of its 2018 yearly opening level at 24660 after responding from a nearby support area priced in at 23963-24224. Daily movement, however, continues to hold ground off a trend line support (etched from the low 23055), with eyes on resistance at 25822 as the next upside target.
A closer reading on the H4 timeframe shows the action extended higher Wednesday following the creation of a bullish inside candle formation off 24137/24279 (green – comprised of a H4 Quasimodo support at 24279, a H4 support at 24137 and the top edge of the said weekly support area at 24224). Price action failed to sustain gains beyond 24842, however, and descended to lows of 24507 before ending the day printing a mild recovery. Technically, the reason behind price action failing to extend beyond this point is largely due to weekly resistance mentioned above at 24660.
Areas of consideration:
For those who remain long this market off of the noted H4 bullish inside candle pattern, you may have very well been stopped out for breakeven should you have reduced risk upon price reaching higher levels yesterday. If you remain long, nevertheless, an attempt to run towards H4 supply could still be on the cards at 25182-24996. Taking partial profits off the table at this area is recommended at this point, since not only will H4 sellers likely wanting to get involved from here, they will be joining alongside potential weekly selling as well.
Today’s data points: Limited.
XAU/USD (Gold):
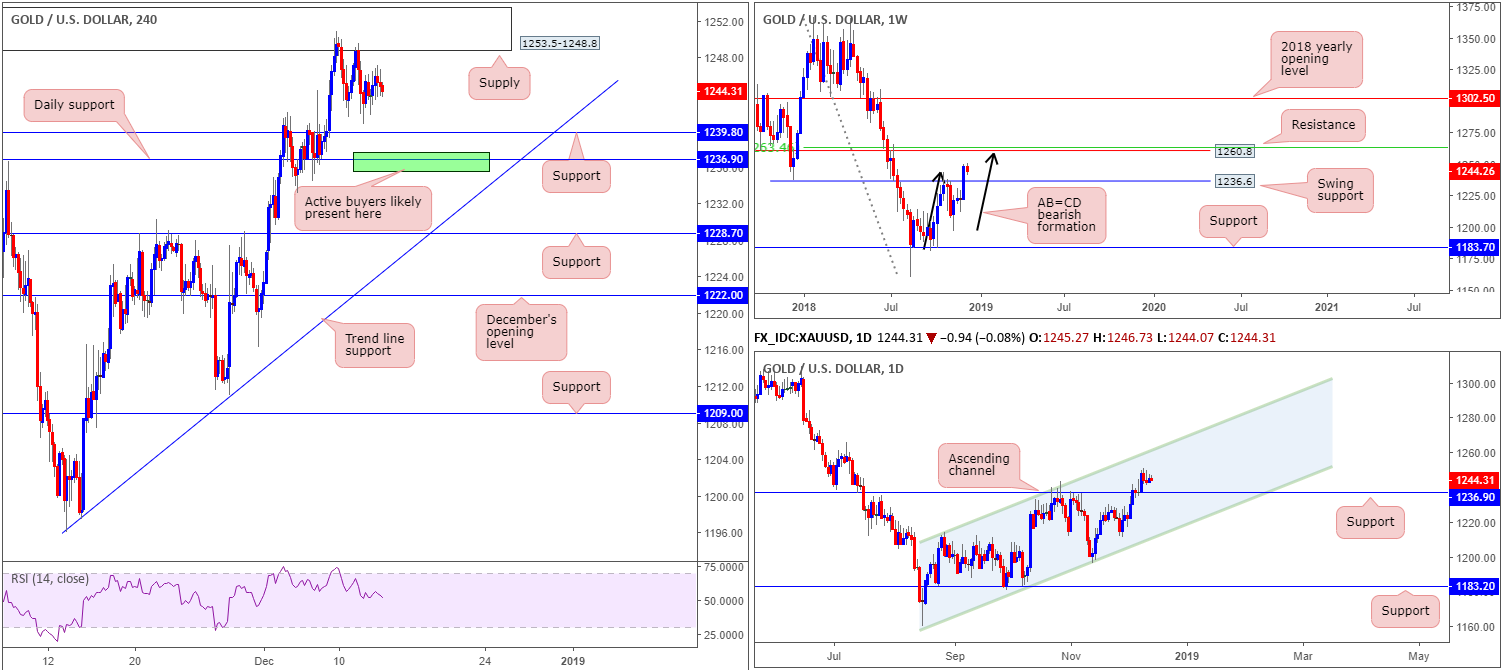
Wednesday was a pretty much sideways market, ranging no more than $5 on the day. As a result of this, H4 supply at 1253.5-1248.8, as you can see, remains in the fold. Beneath this area, we have a H4 support present nearby at 1239.8, trailed closely by a daily support level priced in at 1236.9. This daily level is also represented as a swing support on the weekly timeframe at 1236.6.
In regards to higher-timeframe action, further buying is still very much on the cards, according to our technical studies. Weekly price action has eyes on resistance at 1260.8, which happens to also be joined by a possible AB=CD bearish completion point (black arrows) and a nearby 50.0% resistance value at 1263.4. Daily price, on the other hand, has a channel resistance (etched from the high 1214.3) to target.
Areas of consideration:
Ultimately, the research team still believes if the market tests daily support highlighted above at 1236.9, a rotation to the upside will highly likely be observed. This is simply because both weekly and daily timeframes agree support resides around 1236.9ish.
Should the metal explore higher ground from current prices, however, and challenge the current H4 supply, waiting for the area to be engulfed is recommended over selling the zone. A break above this area followed by a pullback to the daily support at 1236.9 places the market in good stead for a rally towards weekly resistance at 1260.8. The break through H4 supply theoretically clears the majority of sellers out of the market, unlocking the pathway north to higher levels.
The use of the site is agreement that the site is for informational and educational purposes only and does not constitute advice in any form in the furtherance of any trade or trading decisions.
The accuracy, completeness and timeliness of the information contained on this site cannot be guaranteed. IC Markets does not warranty, guarantee or make any representations, or assume any liability with regard to financial results based on the use of the information in the site.
News, views, opinions, recommendations and other information obtained from sources outside of www.icmarkets.com.au, used in this site are believed to be reliable, but we cannot guarantee their accuracy or completeness. All such information is subject to change at any time without notice. IC Markets assumes no responsibility for the content of any linked site. The fact that such links may exist does not indicate approval or endorsement of any material contained on any linked site.
IC Markets is not liable for any harm caused by the transmission, through accessing the services or information on this site, of a computer virus, or other computer code or programming device that might be used to access, delete, damage, disable, disrupt or otherwise impede in any manner, the operation of the site or of any user’s software, hardware, data or property.


