
Key risk events today:
UK Prelim GDP q/q; BoE Gov. Bailey Speaks; US CPI m/m and Core CPI m/m; US Unemployment Claims; ECB’s Lagarde, BoE’s Bailey and Fed Chairman Powell to participate in a panel discussion about monetary policy at the ECB Forum on Central Banking.
(Previous analysis as well as outside sources – italics).
EUR/USD:
In wake of dovish ECB rhetoric from President Lagarde on Wednesday, Europe’s single currency withdrew to deeper water against a broadly stronger dollar.
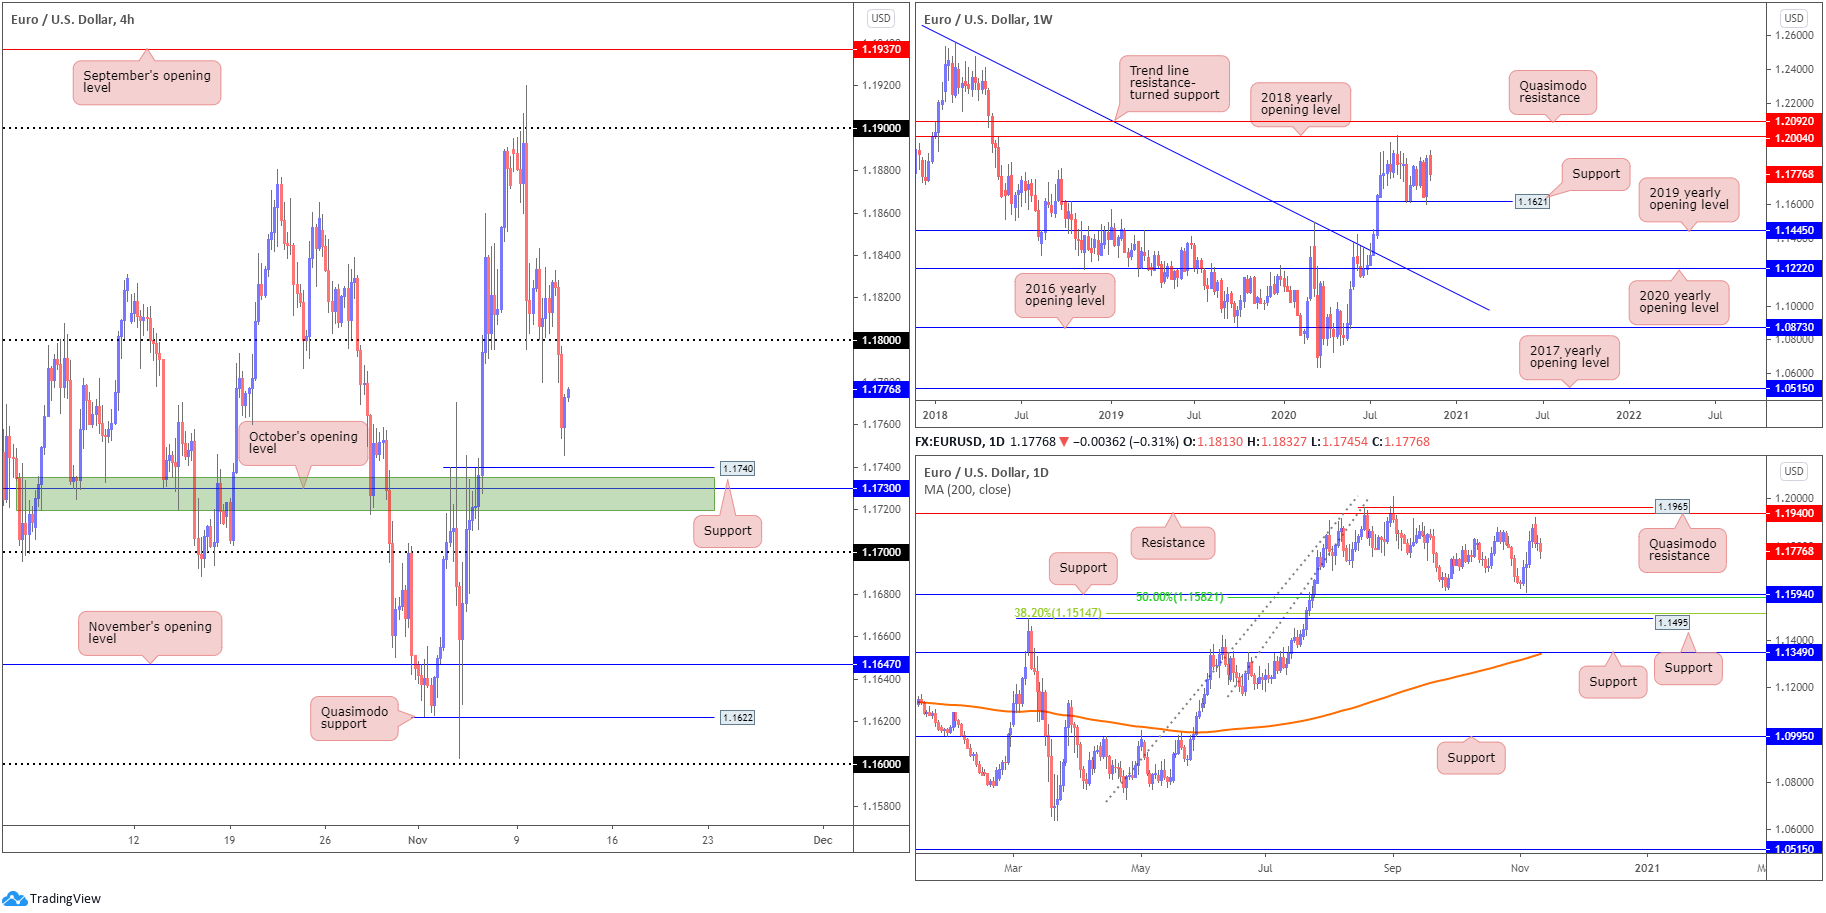
Abandoning the 1.18 handle, H4 recently pencilled in a bottom just north of support at 1.1740 (a previous Quasimodo resistance), as well as a support zone (green) around 1.1719-1.1735 and October’s opening value at 1.1730. Technically, despite the recovery, there’s little stopping H4 from shaking hands with the aforementioned support areas today.
Elsewhere, the Higher timeframes show weekly price attempting to reclaim last week’s 2% advance, threatening a possible retest at 1.1621 support. Should buyers eventually regain consciousness, keep an eye on the 2018 yearly opening value at 1.2004, closely shadowed by Quasimodo resistance priced at 1.2092. Trend traders may also acknowledge July’s trend line resistance break, taken from the high 1.2555, on top of the break of the 1.1495 March 9 swing high.
A closer reading of price action on the daily timeframe reveals the unit snapped a four-day bullish phase on Monday, ahead of resistance at 1.1940 and Quasimodo resistance at 1.1965, with Wednesday extending the retracement slide by 0.3%. Support at 1.1594, and nearby 50.0% retracement ratio at 1.1582, reside as the next downside targets should further selling take shape.
Areas of consideration:
- October’s opening value at 1.1730 and connecting H4 areas form a support to be aware of, though do take into account no higher timeframe support exists here. The same holds true for the 1.17 handle on the H4.
- November’s opening value at 1.1647 puts across potentially workable support, merging closely with weekly support at 1.1621 and H4 Quasimodo support from 1.1622.
- On account of the above, bearish scenarios could also form south of 1.17, targeting at least 1.1647 on the H4.
GBP/USD:
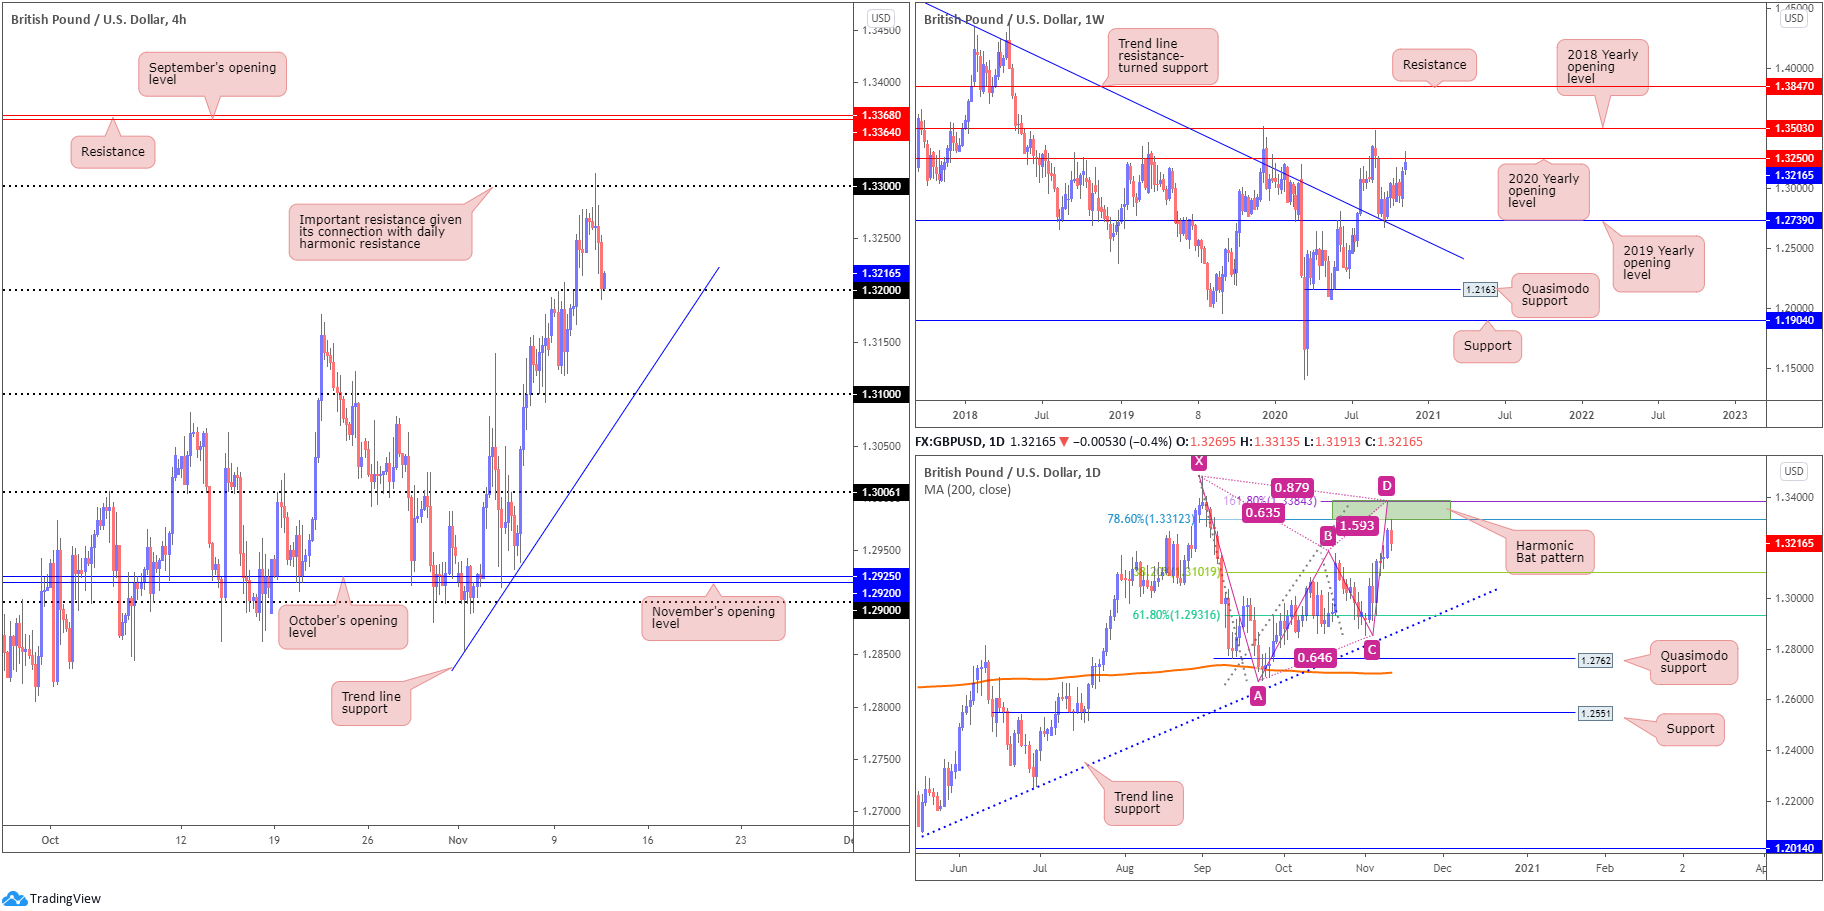
Amidst negative Brexit updates, GBP/USD settled around the 1.32 figure on the H4, falling more than 100 pips on Wednesday.
For those who read Wednesday’s technical briefing you may recall the following (italics):
Interestingly, also circling the 1.33 handle is a daily bearish harmonic Bat pattern with a potential reversal zone (PRZ) stationed at 1.3384/1.3312. This may, assuming the harmonic configuration lures price higher, develop a fakeout above current resistance on the weekly timeframe: the 2020 yearly opening value at 1.3250.
As evident from the charts this morning, we mildly surpassed 1.13 to test (to-the-pip) the underside of the daily bearish harmonic Bat pattern’s PRZ at 1.3384/1.3312 before turning lower on Wednesday.
Areas of consideration:
- Traders short the daily bearish harmonic Bat pattern’s PRZ at 1.3384/1.3312 perhaps have the 38.2% Fibonacci retracement ratio at 1.3109 in sight as an initial take-profit target (arranged from legs A-D).
- Should the above come to fruition, long positions off the 1.32 handle on the H4 may suffer and, assuming a H4 close south of 1.32, may provide sellers another bearish scenario, targeting trend line support, taken from the low 1.2854, and the 1.31 handle.
AUD/USD:
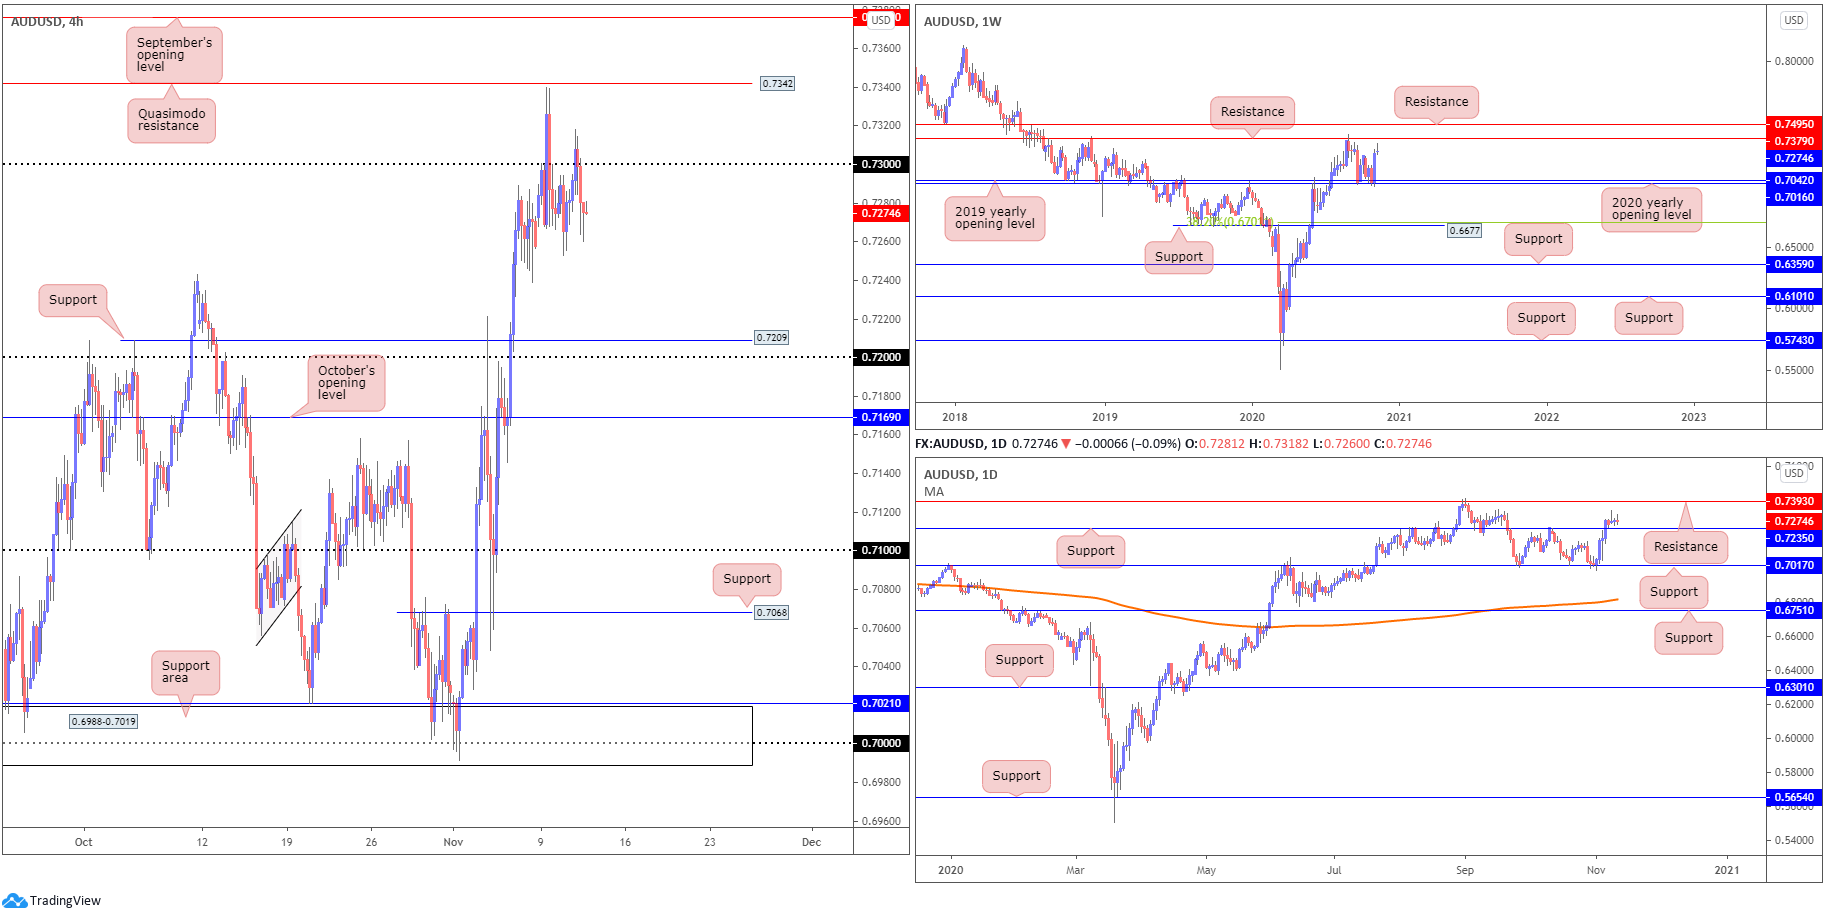
It was another muted session in the AUD/USD space on Wednesday, ranging between 0.7318/0.7260.
H4, as you can see, attempted to capture the 0.73 handle, yet failed to sustain gains beyond 0.7318. North of the round number, Quasimodo resistance at 0.7342 is visible, followed by September’s opening value at 0.7376. Additional weakness, on the other hand, movement that overthrows local lows at 0.7239, shines the spotlight on support at 0.7209 and the 0.72 handle.
From the weekly timeframe, price structure remains unchanged (italics):
Last week’s risk rally, together with the 2020 (0.7016) and 2019 (0.7042) yearly opening values (supports), underpinned the Australian dollar’s near-250-pip advance against the US dollar, consequently producing a sizeable bullish engulfing candle. The positive close, in addition to this market trending higher since early 2020, might motivate additional bullish flow towards resistance priced in at 0.7379.
From the daily timeframe, nevertheless, light remains fixed on support at 0.7235, while a revival of bids could attack resistance at 0.7393.
Areas of consideration:
Outlook unchanged.
- Sellers still have their work cut out for them under 0.73 on the H4. Not only do both weekly and daily charts reveal room to move above 0.73 to at least 0.7379 (weekly resistance), a downside move on the H4 could be halted as soon as 0.7235 support on the daily timeframe.
- A retreat to 0.72, however, could trigger dip-buyers, while a decisive H4 close above 0.73 may tempt breakout buying moves, targeting Quasimodo resistance at 0.7342, followed by September’s opening value at 0.7376 (and weekly resistance at 0.7379).
USD/JPY:
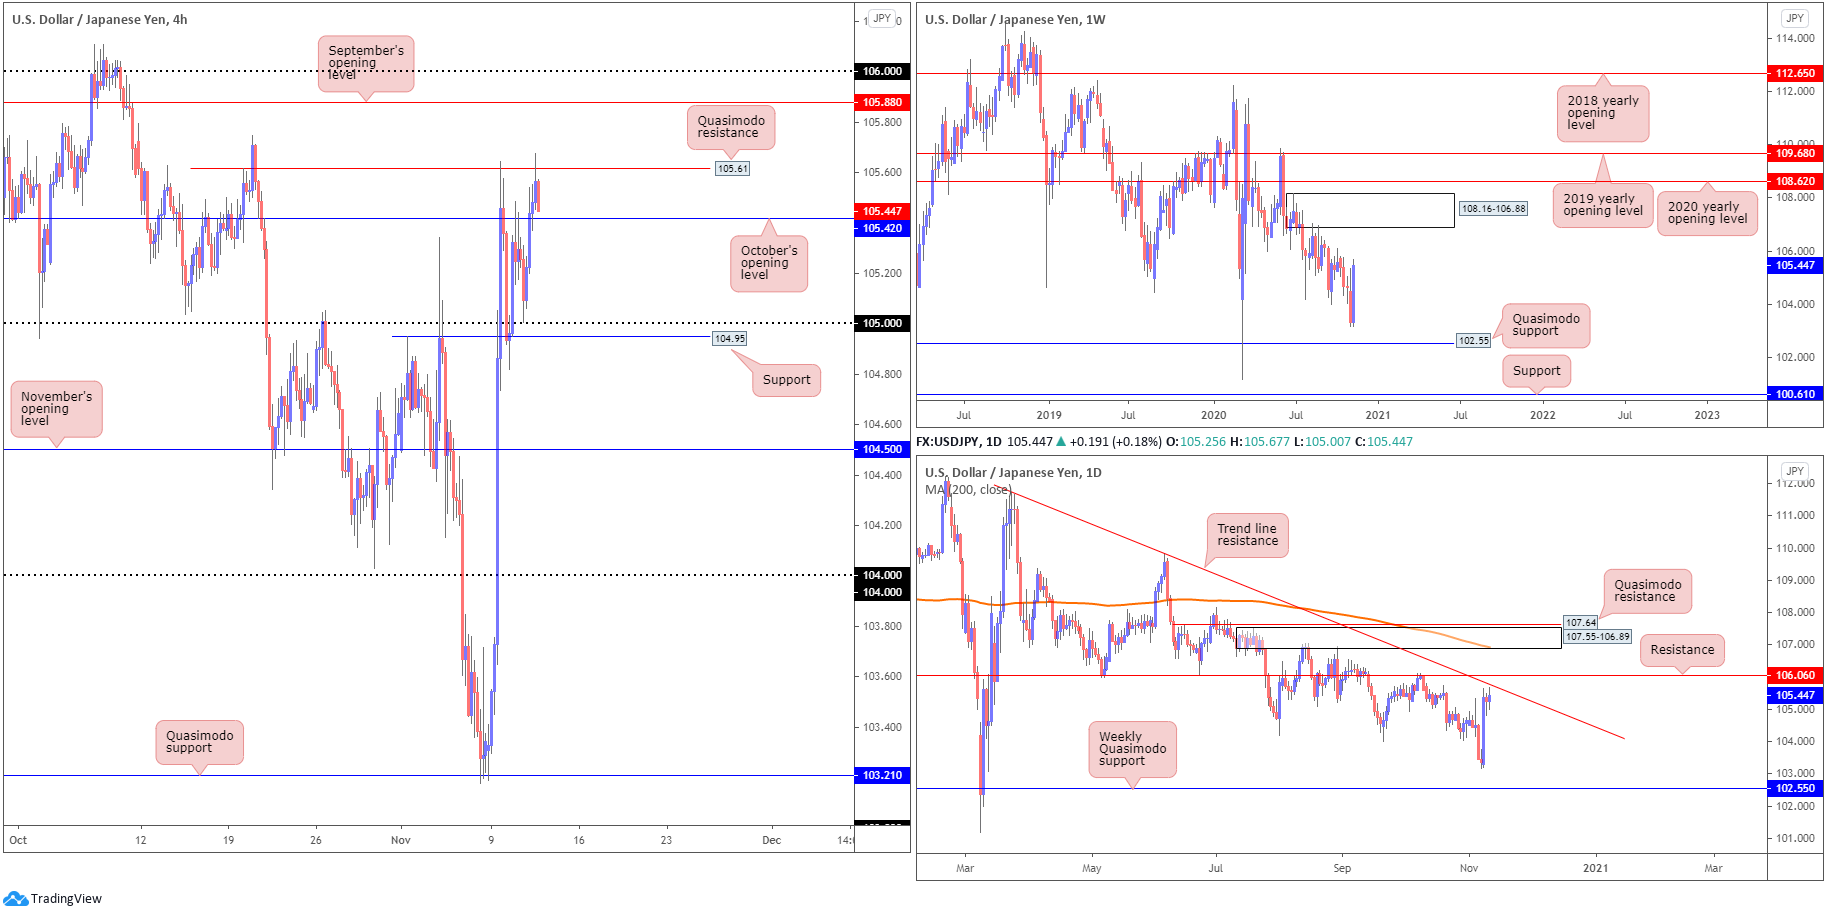
USD/JPY Wednesday tracked broad bullish USD dynamics, rebounding from the 105 handle and overthrowing October’s opening value at 105.42 to recently touch gloves with H4 Quasimodo resistance from 105.61. In the event buyers retain a bullish tone today, September’s opening value at 105.88 and the 106 handle are possibly watched resistances.
Longer-term action, overall, remains pretty much unchanged (italics):
The weekly timeframe has supply at 108.16-106.88 on its radar, with Quasimodo support priced in at 102.55 to the south of price. Price action on the daily timeframe, on the other hand, faces neighbouring trend line resistance, extended from the high 111.71, followed by resistance at 106.06.
Areas of consideration:
- H4 Quasimodo resistance at 105.61 is currently in play, though retaking October’s opening value at 105.42 may be a challenge given higher timeframes forecast further upside. 105.42, therefore, could be viewed as supportive structure today.
- A push higher shines the spotlight on the 106 handle and September’s opening value at 105.88 on the H4, a range that merges with daily trend line resistance and resistance from 106.06.
USD/CAD:
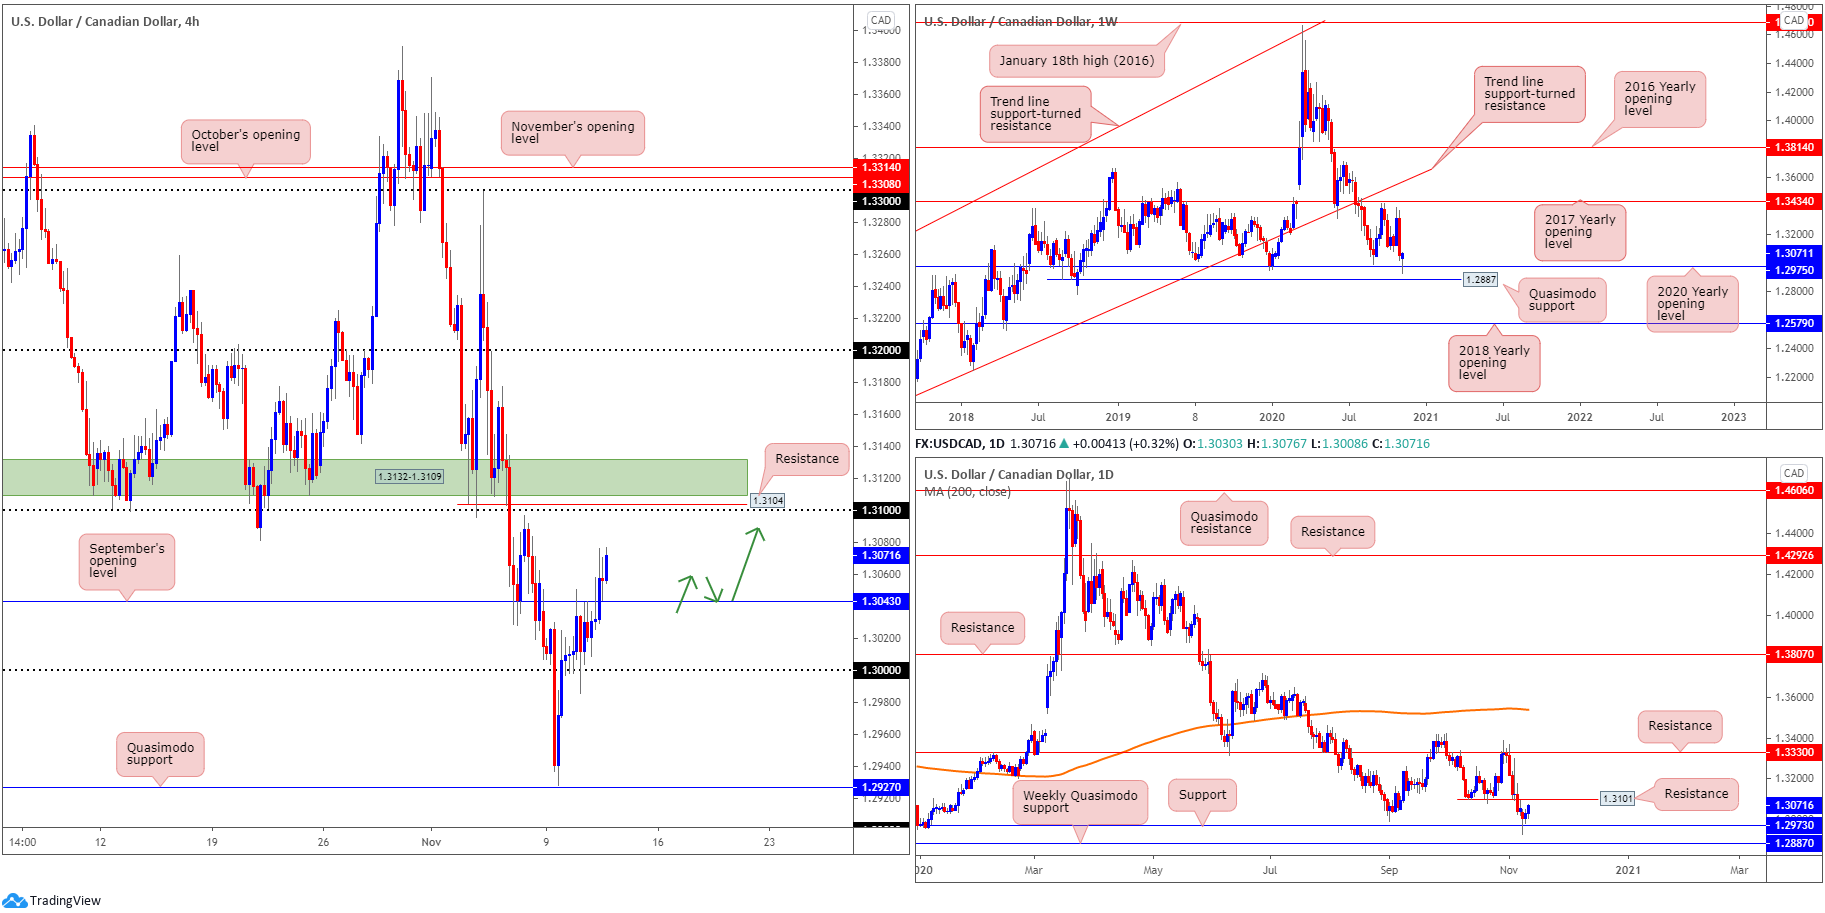
Underpinned amidst USD demand and WTI fading best levels, USD/CAD edged higher on Wednesday.
For those who read Wednesday’s technical briefing you may recall the following (italics):
Aided by higher timeframe supports, a H4 close above September’s opening value at 1.3043 today may encourage a bullish theme, confirming bullish intent off the round number 1.30 to target the 1.31 handle and also daily resistance plotted at 1.3101. Conservative traders, nonetheless, may seek a 1.3043 retest before pulling the trigger (green arrows).
As demonstrated on the H4 chart this morning, we have indeed broken through 1.3043 and retested the base as support. Continued buying could lead to a 1.31 test, shadowed by resistance at 1.3104 and another area of resistance at 1.3132-1.3109 (green).
From the weekly timeframe, price, currently in the shape of a hammer candlestick pattern, is finding support off the 2020 yearly opening value at 1.2975, a level tailed by a Quasimodo support priced in at 1.2887. A decisive rejection from the latter could eventually see the 2017 yearly opening value at 1.3434 enter the fray. However, given this market has traded lower since topping at 1.4667 in early 2020, breaking the aforementioned supports swings the pendulum in favour of further weakness towards the 2018 yearly opening value at 1.2579.
The daily timeframe, also in the form of a hammer candle pattern, recently had price communicate with support at 1.2973 (secured just north of weekly Quasimodo support at 1.2887). Resistance can be found at 1.3101 on the daily scale, a previous Quasimodo support level.
Areas of consideration:
- Continued upside is possible, targeting 1.31/1.3132-1.3109 on the H4 (and daily resistance at 1.3101).
- Bearish themes, therefore, could also develop around 1.3132-1.3109 today, fuelled on the back of daily resistance from 1.3201 and buy-stop liquidity above 1.32.
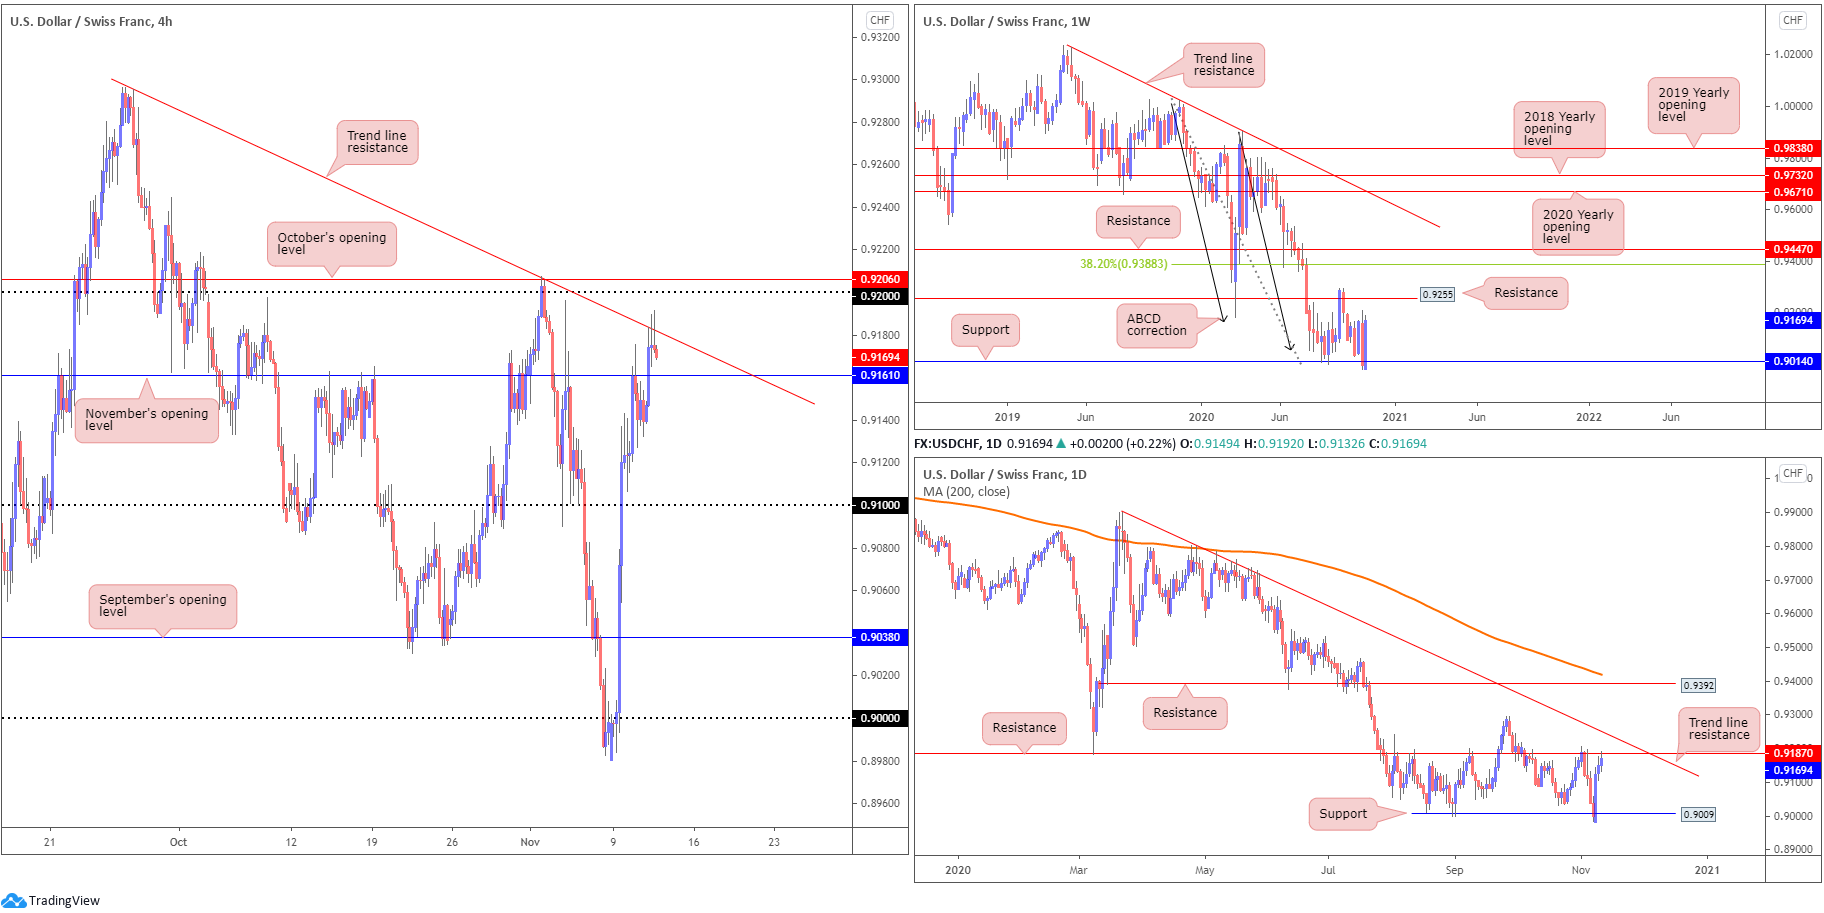
USD/CHF:
In the shape of three consecutive daily bullish candles, boosted amid broad USD strength, USD/CHF mustered enough strength to oust November’s opening value at 0.9161 on the H4 to test, in the form of a shooting star candle pattern, trend line resistance, extended from the high 0.9295. North of the aforementioned trend line resistance, the 0.92 handle is present, sheltered just under October’s opening value at 0.9206.
Further out on the weekly timeframe, traders will acknowledge we remain heavily bid off support at 0.9014, a level dovetailing closely with ABCD support at 0.9051 (black arrows). 0.9255 resistance (a prior Quasimodo support) is next in the firing range should buyers continue to support this market.
From the daily timeframe, however, we are, following a decisive recovery off Quasimodo support at 0.9009 on Monday, crossing swords with resistance at 0.9187. Beyond here, assuming weekly players continue to push higher, traders will likely recognise nearby trend line resistance, taken from the high 0.9901, which happens to merge with weekly resistance at 0.9255.
Areas of consideration:
- H4 trend line resistance (0.9295) may be of interest today, having seen the descending structure converge with daily resistance at 0.9187.
- 9206 (October’s opening value) and the 0.91 handle may also be viewed as interesting resistance on the H4.
- Weekly resistance at 0.9255 offers a longer-term ceiling, strengthened on the back of daily trend line resistance (0.9901).
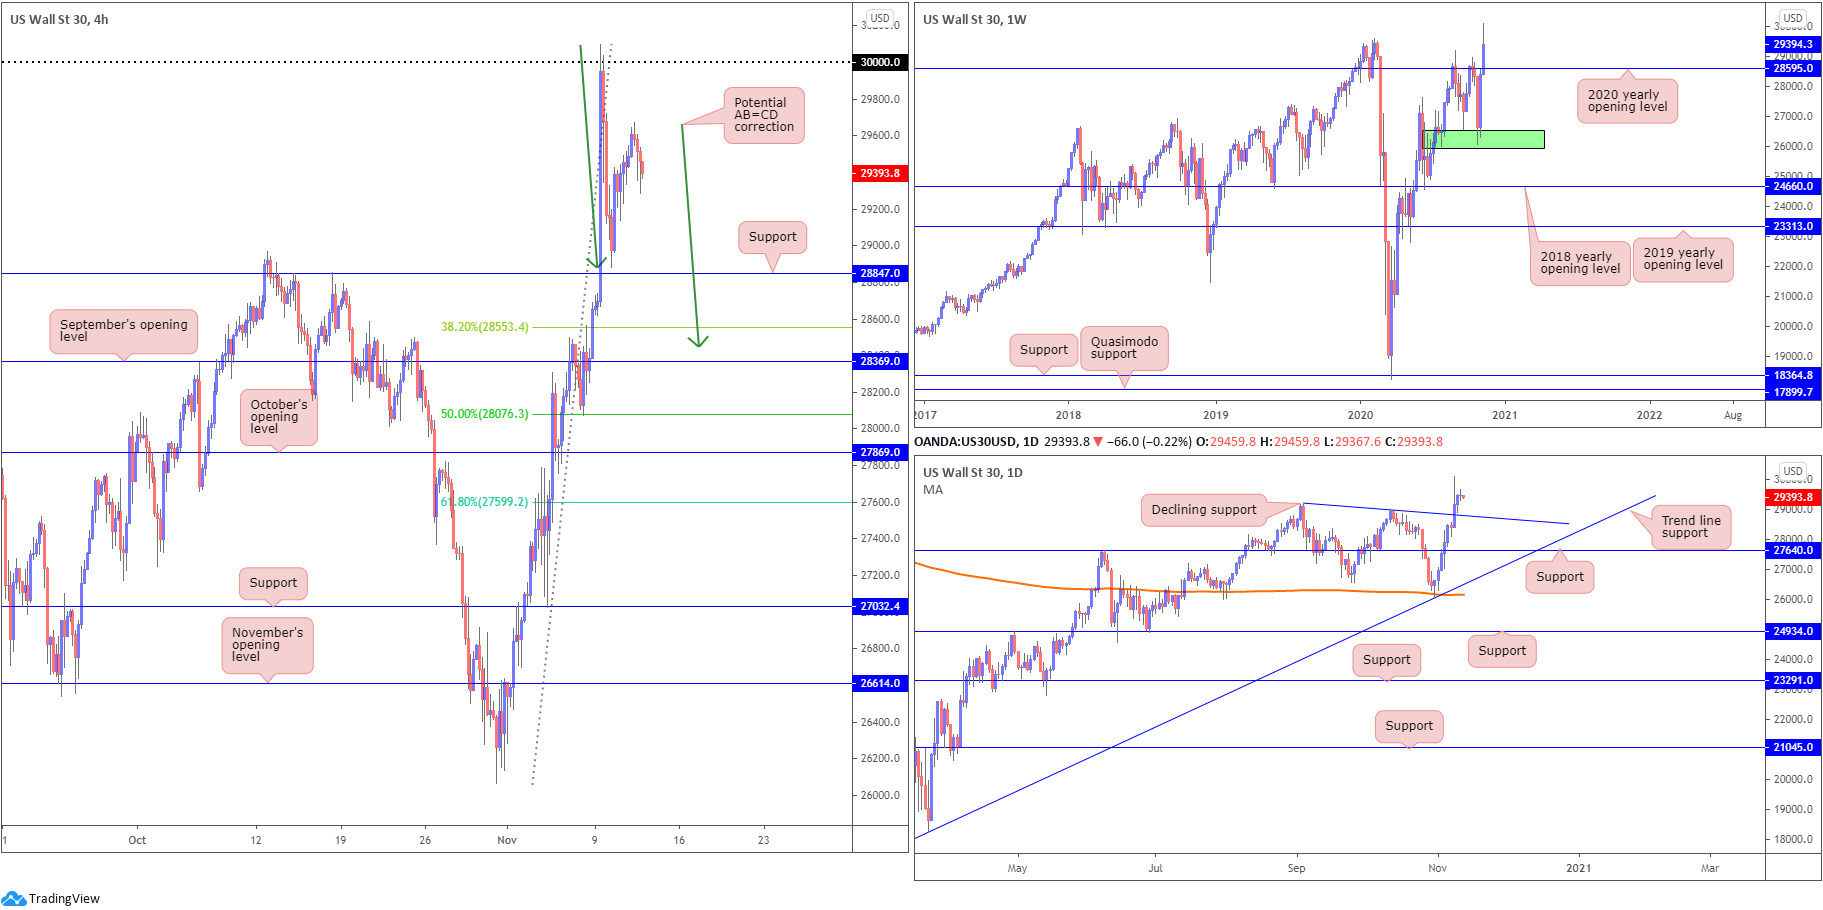
Dow Jones Industrial Average:
US equities finished mostly on the front foot Wednesday, bolstered on the back of outperforming tech stocks. The Dow Jones Industrial Average shed 23.29 points, or 0.08%, the S&P 500 traded higher by 27.13 points, or 0.77%, while the Nasdaq ended higher by 232.57 points, or 2.01%.
From a technical perspective the Dow delivered an indecisive stance on Wednesday, closing in the shape of a daily doji indecision candle. As it stands on the H4 scale, 30000 represents resistance and support falls in around 28847, with a break exposing the 38.2% Fibonacci retracement ratio at 28553, followed by September’s opening value at 28369. In addition, ABCD support can be found around 28450 (green arrows) in the event sellers make an appearance.
From the weekly timeframe, price hovers north of the 2020 yearly opening value at 28595, slightly off fresh all-time peaks at 30097. This follows last week’s 6.7% advance from demand at 25916-26523 (green). Price action on the daily timeframe has declining support in view, taken from the high 29193. Should a break of here come to pass, support at 27640 is seen.
Areas of consideration:
Outlook largely unchanged.
- Forming fresh all-time highs, as highlighted in recent analysis, will likely excite buyers.
- As a result, dip-buying opportunities remain on the table from H4 support at 28847 today should we test this level. Failure to hold, buyers’ crosshairs may switch to the 38.2% H4 Fibonacci retracement ratio seen at 28553, joined closely by H4 ABCD support around 28450 and September’s opening value at 28369.
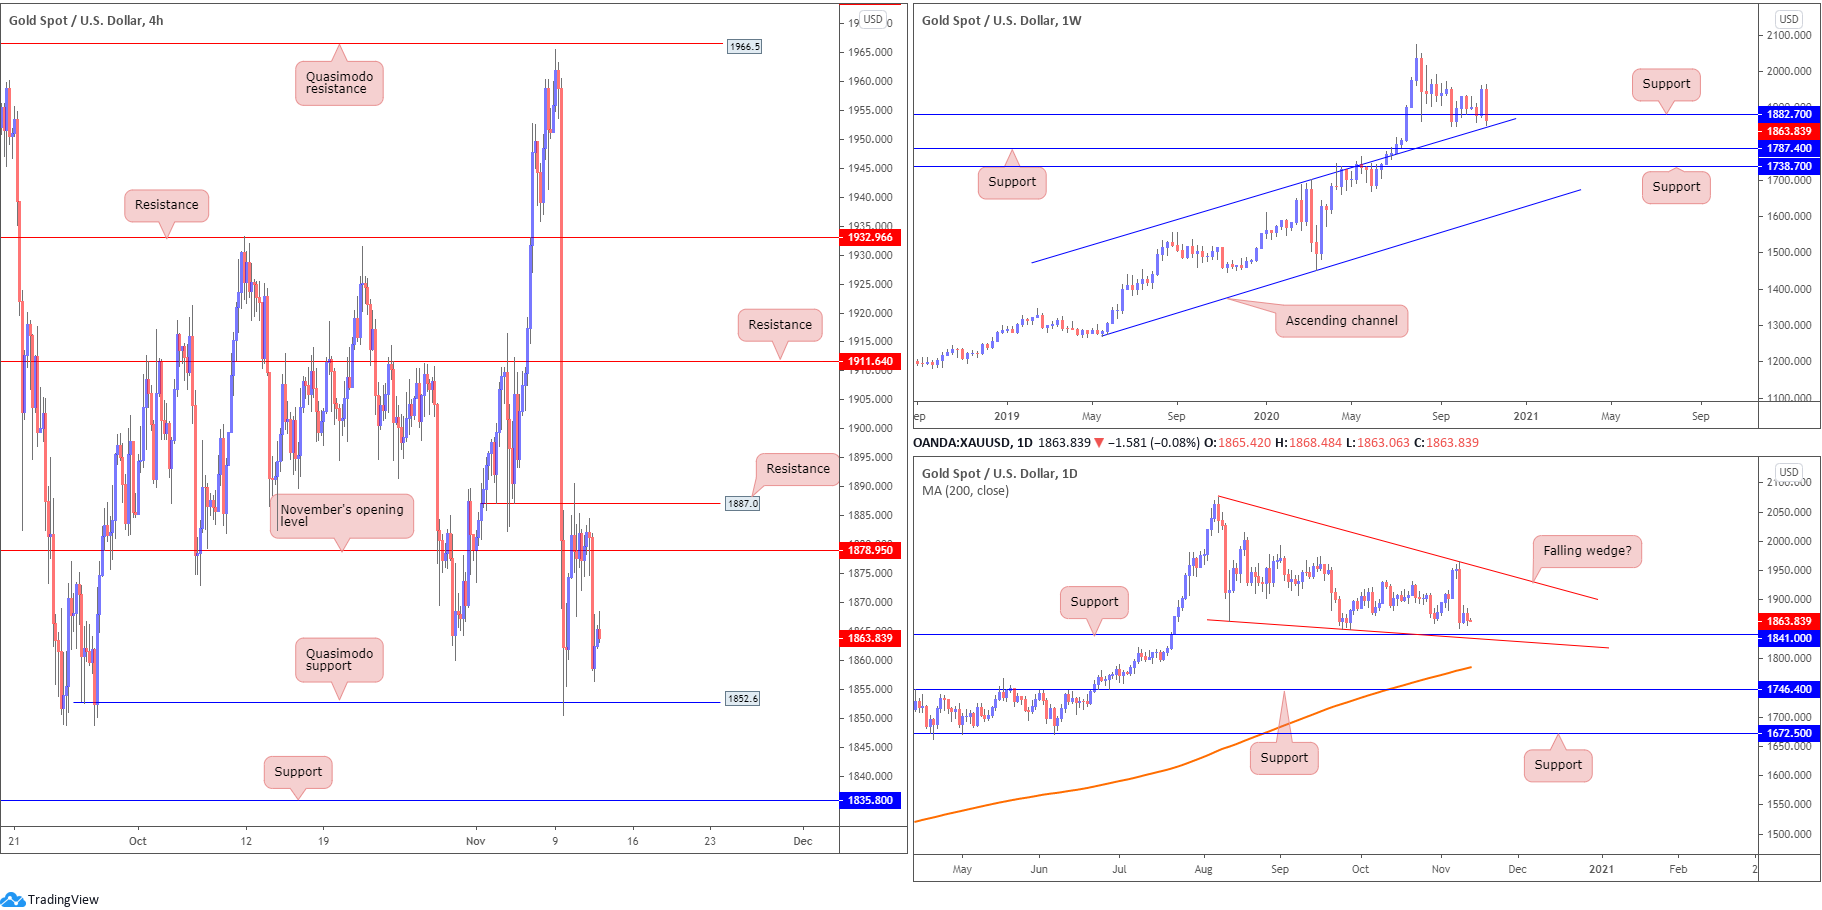
XAU/USD (GOLD):
Having seen the US dollar index extend gains off 92.13, spot gold tumbled from an area of H4 resistance on Wednesday, made up of November’s opening value at $1,878 and resistance at $1,887 (a previous Quasimodo support level). Recent losses, as you can see, place Quasimodo support at $1,852 in the firing range, with support seen at $1,835 if $1,852 is removed.
Higher up on the curve, weekly price recently dipped a toe under support at $1,882, coming within striking distance of channel resistance-turned support, taken from the high $1,703. What’s interesting from a technical perspective is daily support drawn from $1,841 converges with the weekly channel support. Another feature worth highlighting on the daily chart is a possible falling wedge pattern between $2,075/$1,862.
Areas of consideration:
- The H4 Quasimodo formation at $1,852 offers possible support today, in light of weekly support from $1,882 also in play.
- H4 resistance at $1,878-$1,887 also forms a base to watch in the event buyers stage a comeback.
- Should H4 support at $1,835 nudge its way into the limelight, the pendulum swings in favour of buyers here in terms of technical confluence: daily support at $1,841 and weekly channel support.
The accuracy, completeness and timeliness of the information contained on this site cannot be guaranteed. IC Markets does not warranty, guarantee or make any representations, or assume any liability regarding financial results based on the use of the information in the site.
News, views, opinions, recommendations and other information obtained from sources outside of www.icmarkets.com.au, used in this site are believed to be reliable, but we cannot guarantee their accuracy or completeness. All such information is subject to change at any time without notice. IC Markets assumes no responsibility for the content of any linked site.
The fact that such links may exist does not indicate approval or endorsement of any material contained on any linked site. IC Markets is not liable for any harm caused by the transmission, through accessing the services or information on this site, of a computer virus, or other computer code or programming device that might be used to access, delete, damage, disable, disrupt or otherwise impede in any manner, the operation of the site or of any user’s software, hardware, data or property


