A note on lower timeframe confirming price action…
Waiting for lower timeframe confirmation is our main tool to confirm strength within higher timeframe zones, and has really been the key to our trading success. It takes a little time to understand the subtle nuances, however, as each trade is never the same, but once you master the rhythm so to speak, you will be saved from countless unnecessary losing trades. The following is a list of what we look for:
- A break/retest of supply or demand dependent on which way you’re trading.
- A trendline break/retest.
- Buying/selling tails – essentially we look for a cluster of very obvious spikes off of lower timeframe support and resistance levels within the higher timeframe zone.
- Candlestick patterns. We tend to only stick with pin bars and engulfing bars as these have proven to be the most effective.
EUR/USD:
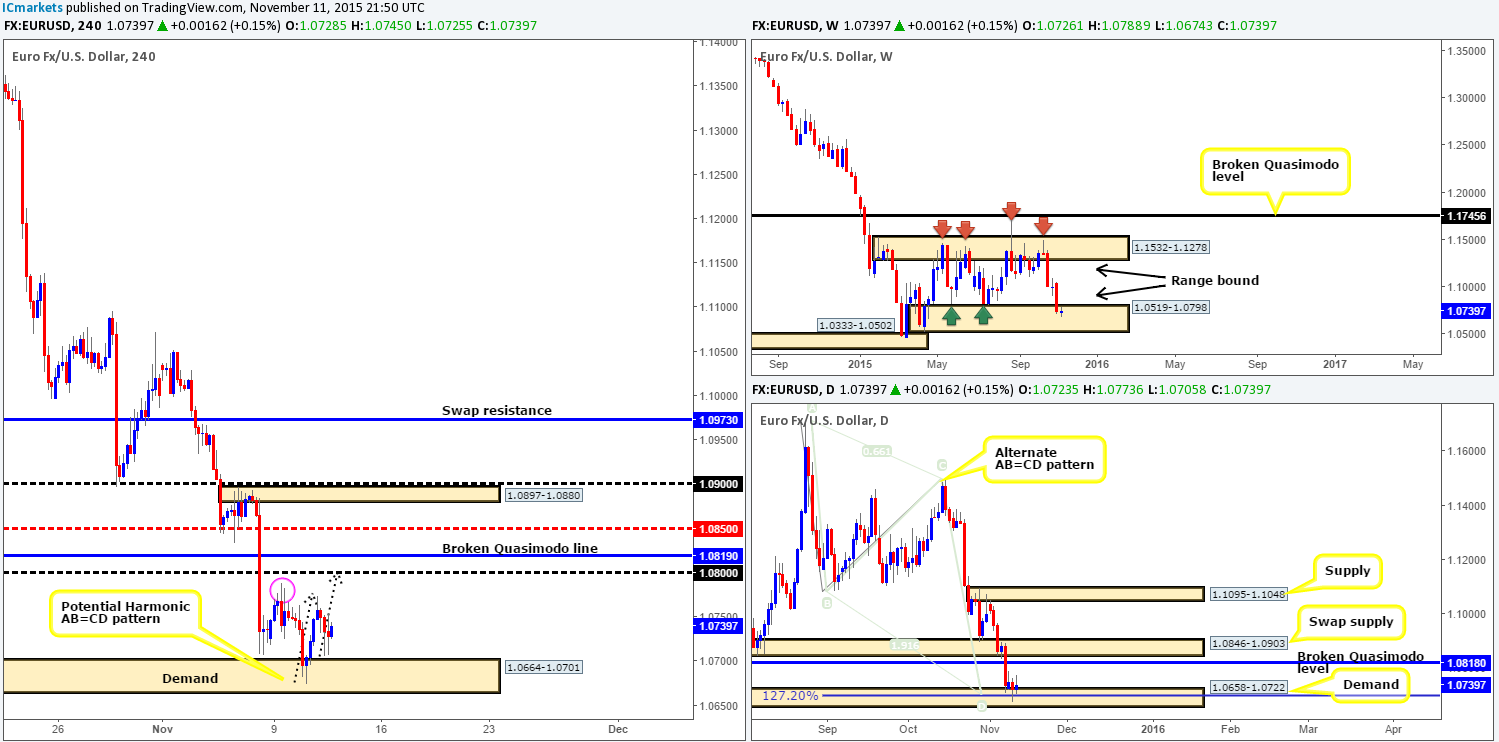
In our previous report (http://www.icmarkets.com/blog/wednesday-11th-november-daily-technical-outlook-and-review-u-s-canadian-bank-holidays-today/) we mentioned that we’d taken a long on the EUR pair at 1.06852, and was targeting Monday highs (pink circle) at 1.0788, followed by psychological resistance 1.0800 to take further profits (50% already closed). As shown on the chart, price did indeed continue to rally north coming so very close to hitting Monday’s highs. Our team, however, closed a further 25% of the position at the close of the H4 rejection wick seen at 1.0773.
We’re now going to let the rest of the remaining position run free, as we currently see a potential D-leg of a small Harmonic AB=CD pattern in the process of forming, completing nicely at the 1.0800 figure (see black arrows). In regards to shorting this AB=CD formation, we would advise caution and only trade here with lower timeframe confirming price action. Reason being is there will likely be a fakeout seen up to the broken Quasimodo line at 1.0819, before any sell-off takes place.
Concerning the current situation though, there’s agreement for higher prices being seen across the board regarding higher timeframe structures. Not only is price trading within a weekly range demand at 1.0519-1.0798, but it is also responding nicely to daily demand at coming in at 1.0658-1.0722 (sits within the above said weekly range demand and also coincides nicely with a bullish alternate AB=CD pattern at 1.0697).
Levels to watch/live orders:
- Buys: 1.06852 [LIVE] (Stop loss: breakeven).
- Sells: Possible sell trade around the 1.0800 region (confirmation required) (Stop loss: dependent on where one confirms this level).
GBP/USD:
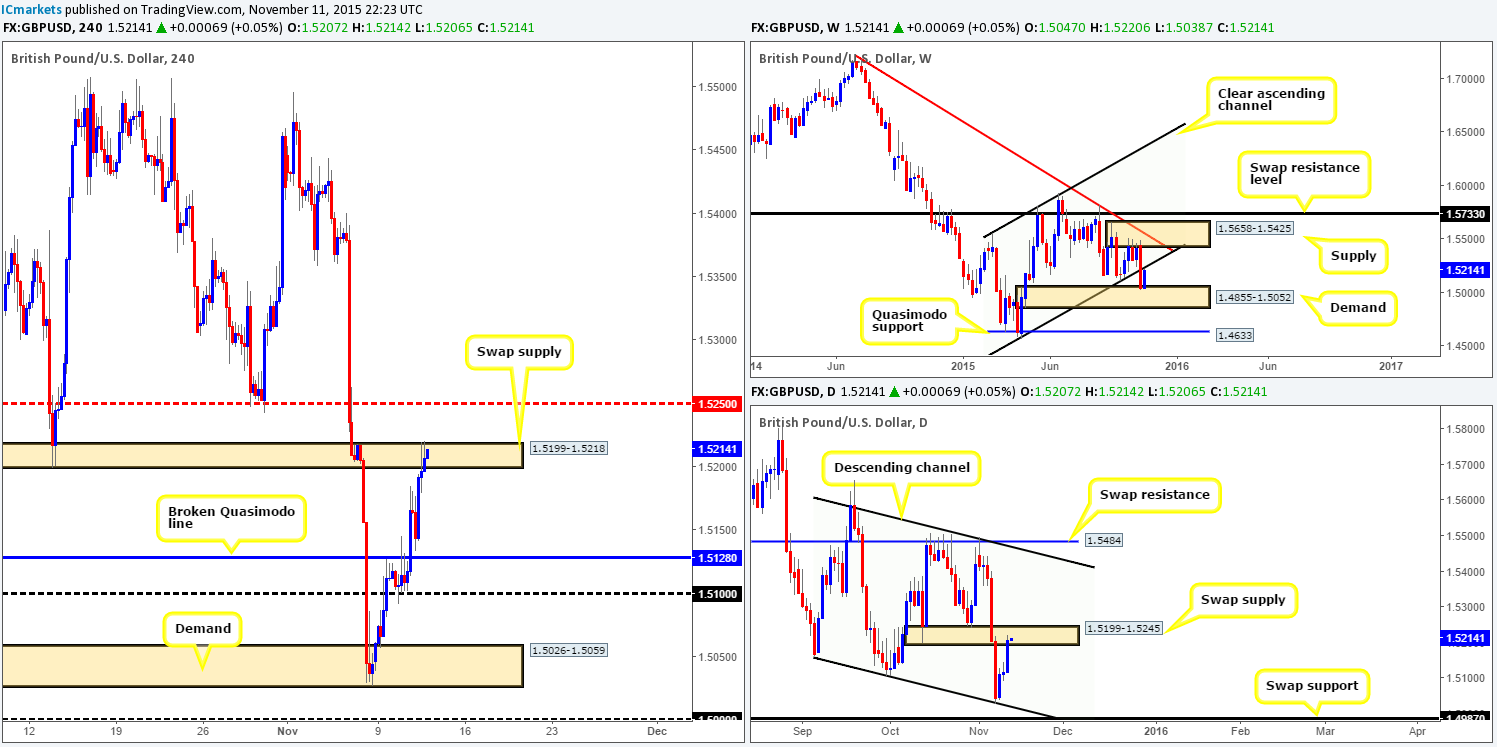
Coming at you directly from the top this morning, we can see that weekly action is now kissing the underside of the recently broken channel support-turned resistance line drawn from the low 1.4564. Moving down a scale to the daily timeframe, it is also clear to see that Cable has entered into the jaws of a swap supply zone at 1.5199-1.5245. Should active selling be seen, there is room on both timeframes in our opinion for a drive lower.
Turning our attention to the H4 timeframe, recent activity closed above the broken Quasimodo line at 1.5128, and just missed retesting this level as support before rocketing north up to a small swap supply area at 1.5199-1.5218 (located within the above said daily swap [supply] zone). This was unfortunate, since this was a noted buy zone in our previous report (http://www.icmarkets.com/blog/wednesday-11th-november-daily-technical-outlook-and-review-u-s-canadian-bank-holidays-today/) and would have made for a very profitable trade.
Based on the current H4 price action being seen, there are two rejection wicks, one of which is spiking above the current swap supply zone itself. Furthermore, the candle closes are all positive, suggesting that we may see a further drive north today up to at least mid-level resistance 1.5250. Given that this number sits just above the aforementioned daily swap (supply) zone, and is positioned very close to the weekly channel resistance (see above), we would much rather look for confirmed shorts at 1.5250 than at current prices.
Levels to watch/ live orders:
- Buys: Flat (Stop loss: N/A).
- Sells: 1.5250 [Tentative – confirmation required] (Stop loss: dependent on where one confirms this level).
AUD/USD:
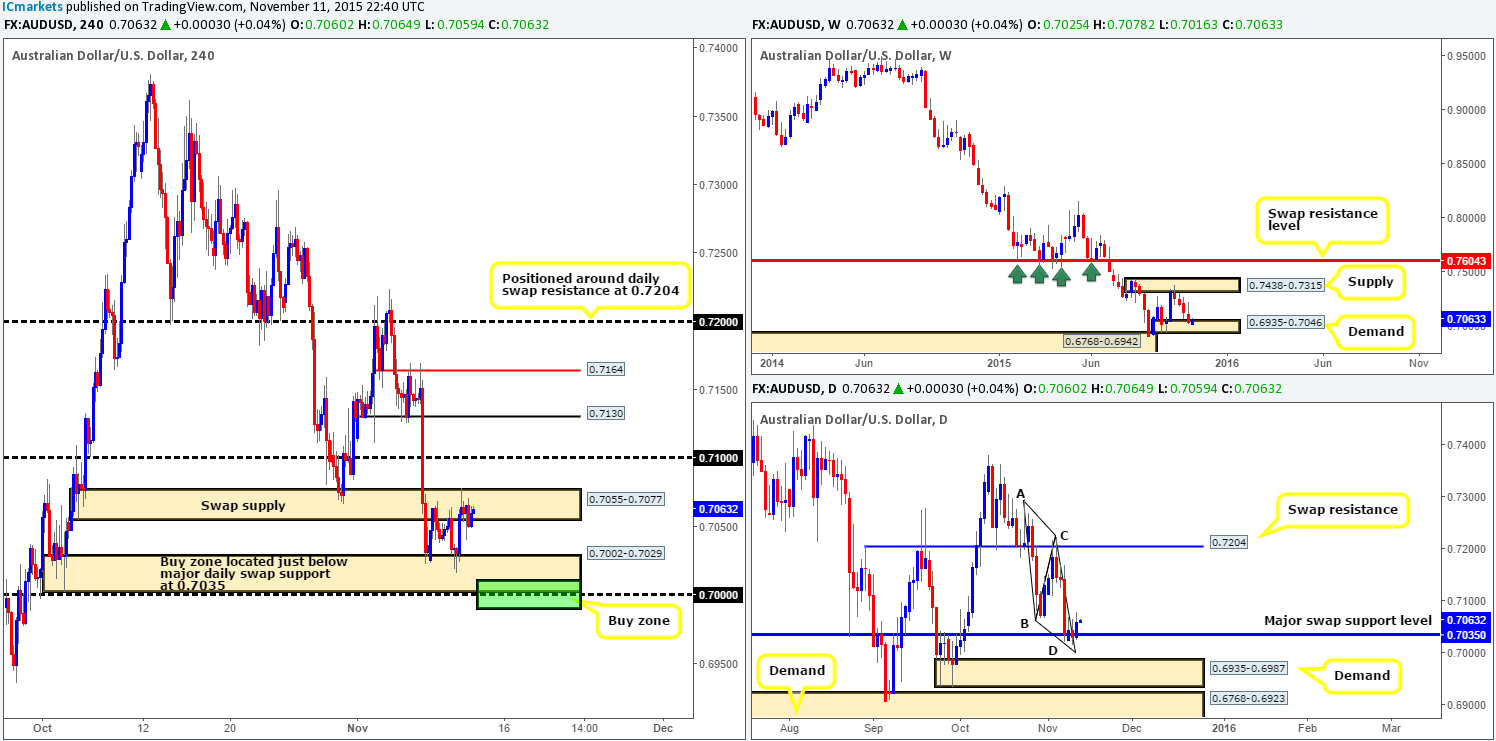
Kicking off this morning’s analysis with a look at the H4 timeframe shows that price has recently entered into a phase of consolidation fixed between swap supply at 0.7055-0.7077, and demand coming in at 0.7002-0.7029. This – coupled with market action currently trading around both a weekly demand at 0.6935-0.7046, and also a swap support level on the daily timeframe at 0.7035, we’re effectively looking for a move higher. Nevertheless, as our team pointed out yesterday, they have little interest in trying to fade the top side of the current H4 demand. Here’s why… The lower limits of this demand represents not only a huge psychological support at 0.7000, it is also a bottom of an AB=CD bull pattern on the daily timeframe! Thus making it a nice place to be looking to enter long from today should price reach this low.
As far as entry goes, however, we have placed a ten-pip buffer around 0.7000 for our buy zone (green area). Assuming that we spot a lower timeframe buy setup forming within this area (reason for requiring confirmation here is simply to avoid any fakeouts that may take place at 0.7000), we would have no hesitation in buying this market. Targets will of course be dependent on how price approaches the zone.
Levels to watch/ live orders:
- Buys: 0.7000 region [Tentative – confirmation required] (Stop loss: dependent on where one confirms this level).
- Sells: Flat (Stop loss: N/A).
USD/JPY:
For those who read our previous report on this pair (http://www.icmarkets.com/blog/wednesday-11th-november-daily-technical-outlook-and-review-u-s-canadian-bank-holidays-today/), you may recall us mentioning that we wanted to see this market close below psychological support 123.00 and retest it as resistance. Well, the close lower was indeed seen, but the retest was a little deeper than expected, thus not really tradable as per our rules of engagement. Looking at only H4 action right now, we see a potential long opportunity setting up – a symmetrical three-drive approach into mid-level support 122.50 (see black arrows).
However, when we throw the higher timeframes into the mix, the directional bias changes somewhat. For starters, we have no clear direction being seen on the weekly timeframe at the moment, as it’s currently loitering mid-range between a swap support area at 122.01-121.40, and a supply zone drawn from 125.27-124.11. Meanwhile, down on the daily timeframe, market action is being held lower by a swap resistance level at 123.33, which converges beautifully with an AB=CD bear top at 123.43.
This is not to say that a long trade will not work out from 122.50, we just feel it may only be good for a small intraday bounce at best. Should a close below 122.50 take place today, we would be very interested in looking for a confirmed short on the retest of this number, targeting psychological support 122.00, followed closely by demand drawn from 121.51-121.68 (located just within daily swap [demand] at 121.72-121.21).

Levels to watch/ live orders:
- Buys: 122.50 [Tentative – confirmation required] (Stop loss: dependent on where one confirms this level).
- Sells: Watch for bids to be consumed around 122.50 and then look to trade any retest seen at this level (confirmation required).
USD/CAD:
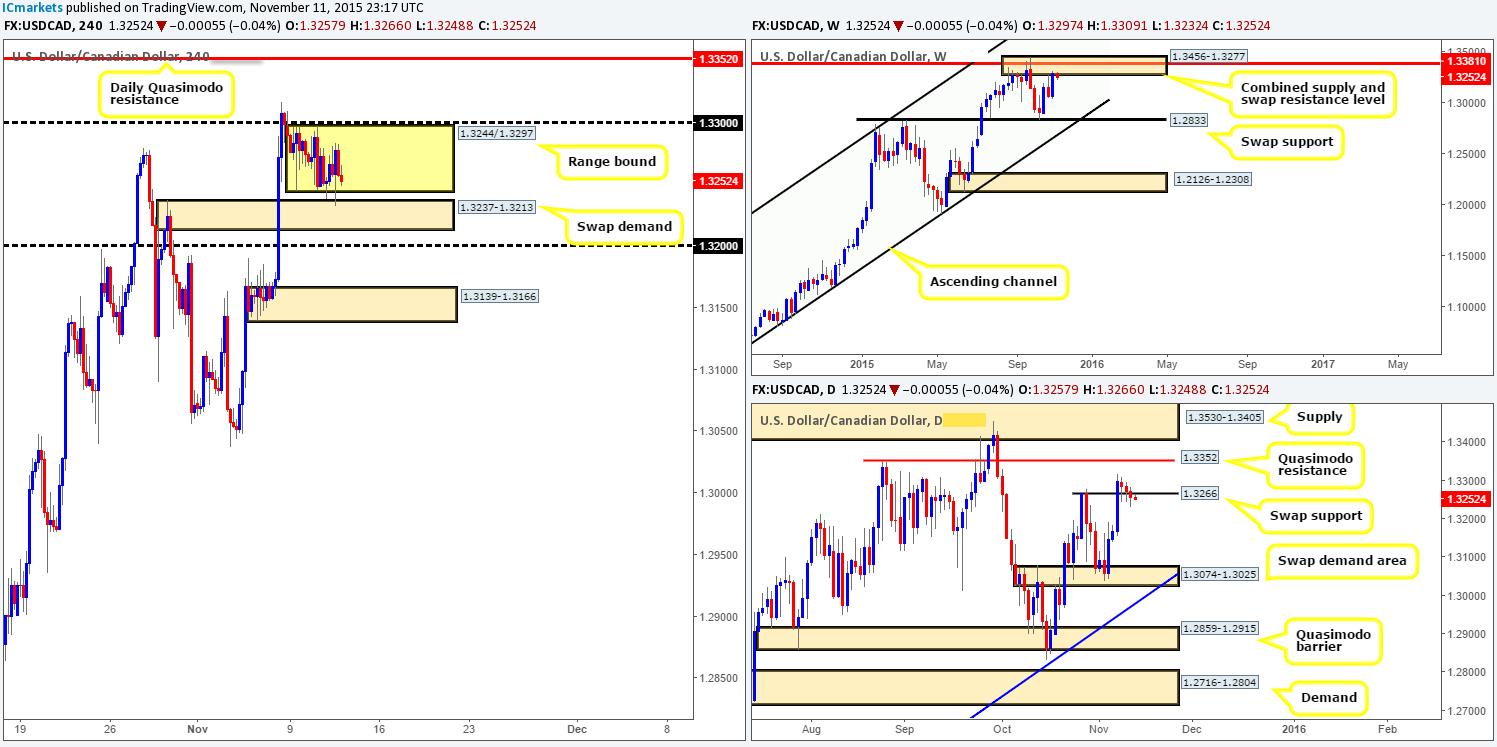
It should not really come as much of a surprise to see that trade was relatively thin during yesterday’s sessions due to both the U.S. and Canada being on vacation. Consequent to this, price remains ranging between 1.3244/1.3297. Beyond this consolidation, nevertheless, sits a swap demand area just below at 1.3237-1.3213, which, as you can see, was used to bolster prices up yesterday and keep price within its range. To the upside, we see a daily Quasimodo resistance level at 1.3352, which sits nicely within a combined weekly supply/ swap resistance area at 1.3456-1.3277/1.3381.
Given the above, where do we see this market heading today? Well, with prices trading at weekly supply (see above) right now and daily action closing slightly below a swap support at 1.3266, the short-side of the market seems the best bet. While this may be true, selling on the H4 may not be such a good idea… Not only do we have range lows at 1.3244 to contend with, but also the swap demand base mentioned above at 1.3237-1.3213, followed by psychological support 1.3200.
With everything taken into consideration, the only two places we would be comfortable shorting from today is the upper limit of the current H4 range, 1.3297, and the aforementioned daily Quasimodo resistance level (lower timeframe confirmation would be required at each barrier).
Levels to watch/ live orders:
- Buys: Flat (stop loss: N/A).
- Sells: 1.3297 [Tentative – confirmation required] (Stop loss: dependent on where one confirms this level) 1.3352 [Tentative – confirmation required] (Stop loss: dependent on where one confirms this level).
USD/CHF:
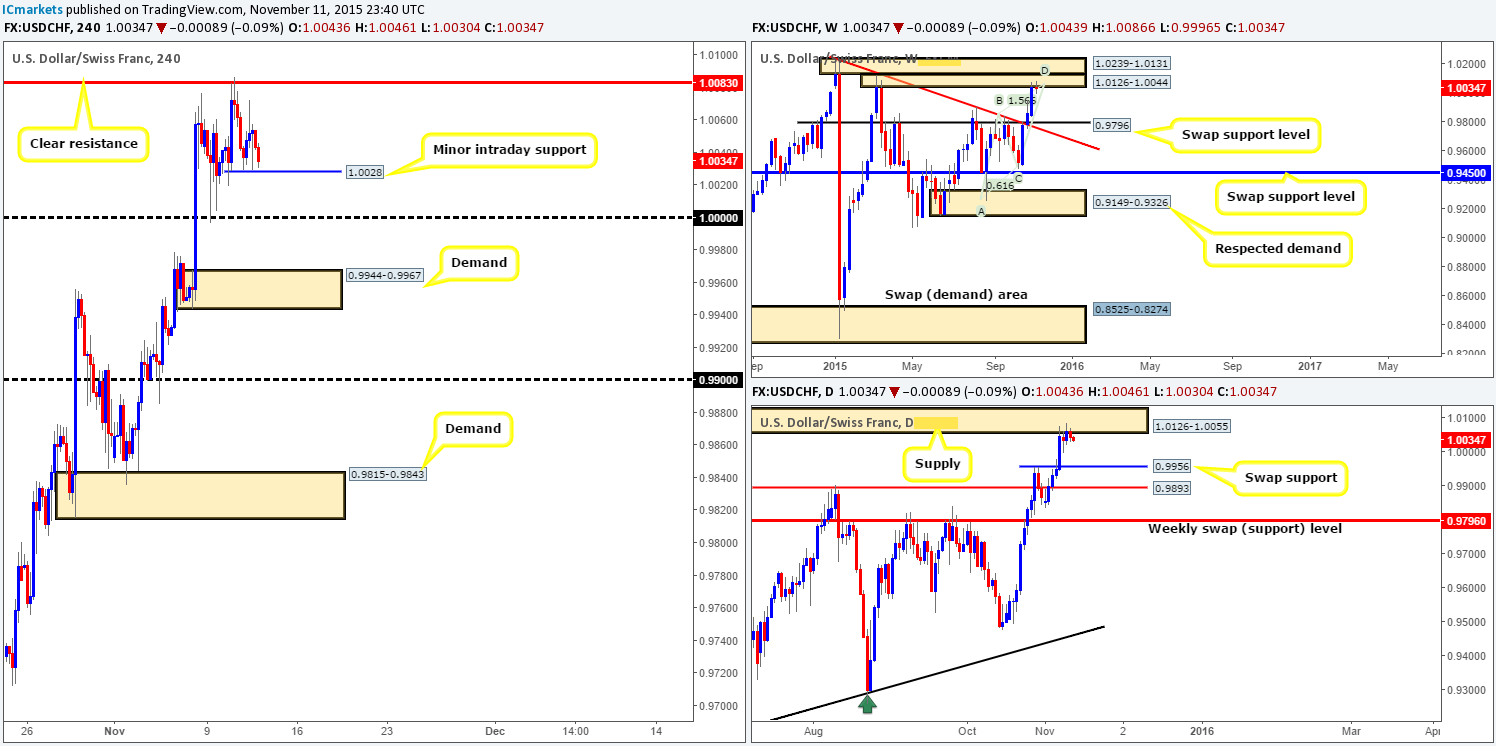
Similar to the USD/CAD, the USD/CHF saw somewhat of a lackluster performance yesterday, peaking at a high of 1.0072, and recording lows of 1.0029. Overall though, the rebound from the H4 resistance level at 1.0083 continues to extend lower. However, price is now very close to crossing swords with a minor intraday support barrier seen at 1.0028, which if broken, will likely send this market down to parity. In the event that it is respected, nevertheless, an upside move could be seen up to yesterday’s high (mentioned above), and even possibly back up to the aforementioned H4 resistance level.
Given the above, this is what we have jotted down so far…
- If price breaks below 1.0028, we see little opportunity to trade short or long. What??!! No long at parity? That’s correct! Here’s why… Weekly action is currently trading at the lower limits of a stacked supply formation coming in at 1.0126-1.0044 (upper zone is seen at 1.0239-1.0131). Additionally, we also see a nice-looking AB=CD Harmonic pattern completing around 1.0046 region. Similar to that of the weekly timeframe, daily action shows price now kissing the underside of supply drawn from 1.0126-1.0055 (ties in lovely with the weekly supply area mentioned above at 1.0126-1.0044). Therefore, if one were to consider a buy from 1.0000, you would effectively be entering long into both weekly and daily flow! Trade carefully!
- On the other hand, a second retest of the aforementioned H4 resistance barrier would likely be good for another short trade (with confirmation of course), due to it being located within strong heavy-weight supply (see italics above).
Levels to watch/ live orders:
- Buys: Flat (Stop loss: N/A).
- Sells: 1.0083 [Tentative – confirmation required] (Stop loss: dependent on where one confirms this level).
DOW 30:
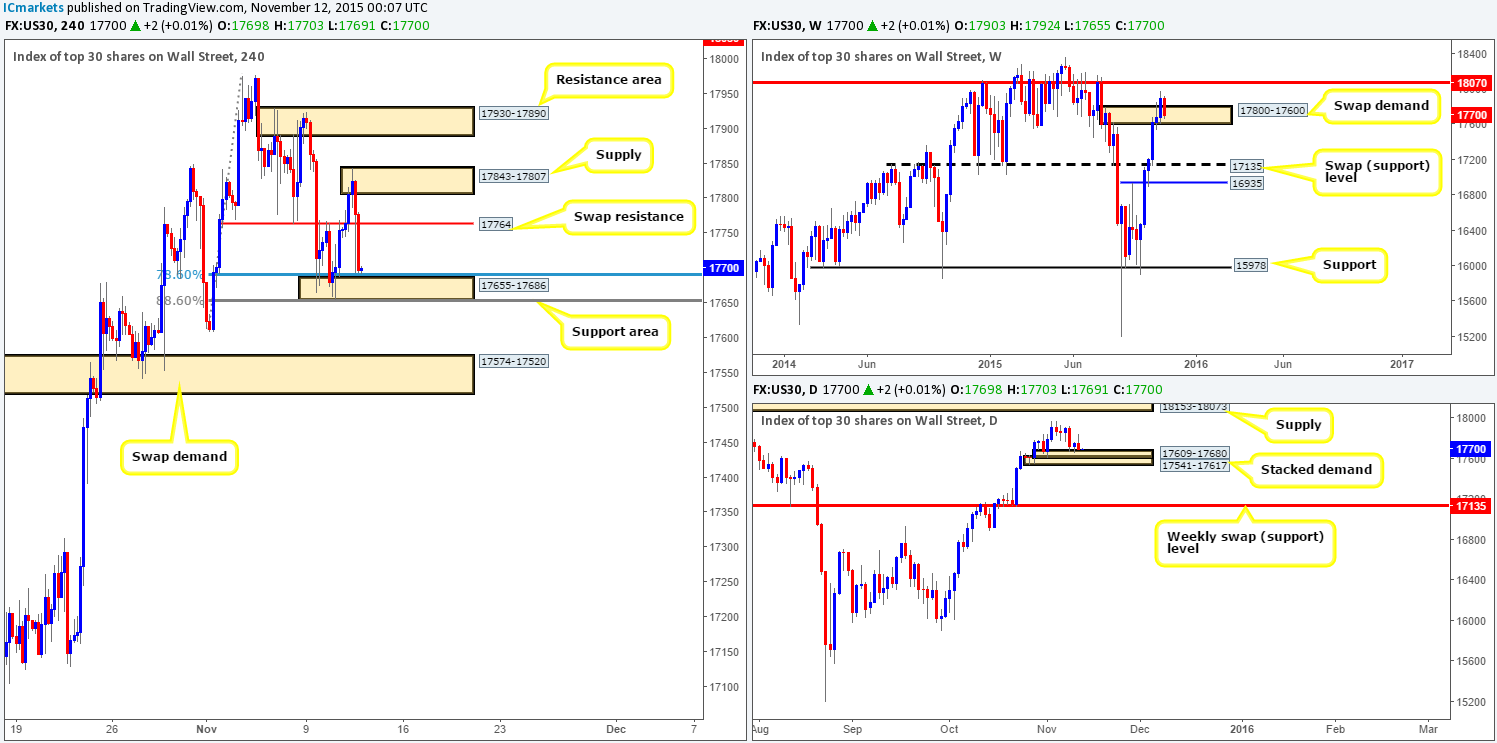
The DOW 30 begun positively yesterday, with a clean close above (what was at the time) a H4 swap supply zone at 17769-17795, and did in fact retest it as demand. Fortunately for us we were not around at that time, as we would have likely taken a long from here (noted buy zone in our previous report: http://www.icmarkets.com/blog/wednesday-11th-november-daily-technical-outlook-and-review-u-s-canadian-bank-holidays-today/) when the DOW heavily sold off. A lucky escape was all this was!
In light of price now loitering above a H4 support area at 17655-17686, bolstered together with both 88.6% and 78.6% Fibonacci levels, would we deem this a stable platform in which to look for longs from today? With current weekly action showing price is trading deep within a swap demand zone at 17800-17600, and price on the daily timeframe trading above a stacked demand formation at 17541-17617/17609-17680, we are technically biased to the long-side of this market.
That being the case, our objective for today is simple. Watch for a lower timeframe buy setup around the above said H4 support area. Should this play out, we’ll be eyeing the swap resistance at 17764 as our immediate take-profit level, followed by supply sitting at 17843-17807.
Levels to watch/ live orders:
- Buys: 17655-17686 [Tentative – confirmation required] (Stop loss: likely be around the 16647 region but will depend on where one confirms this area).
- Sells: Flat (Stop loss: N/A).
XAU/USD: (Gold)
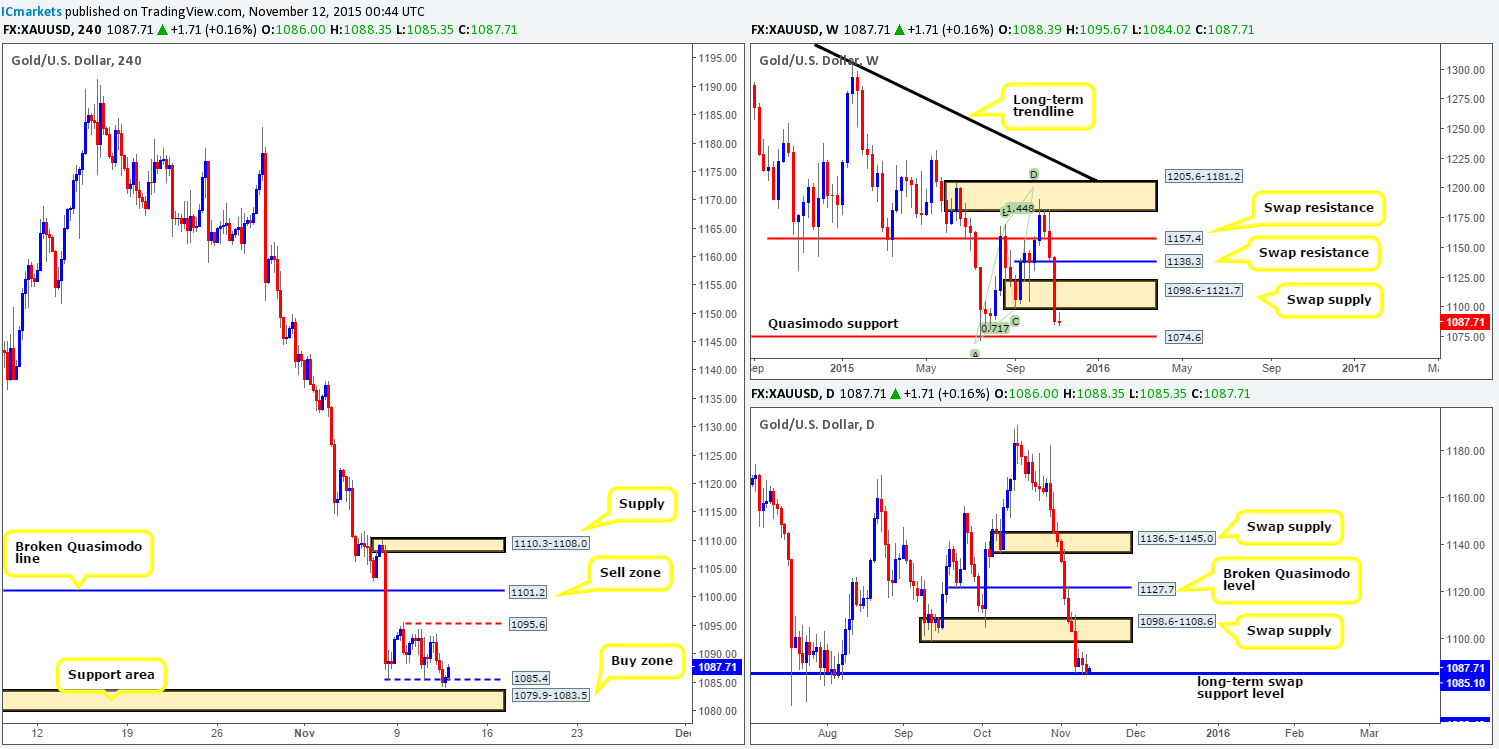
Yesterday’s action saw strong sellers step in from 1093.4 and drive the price of Gold lower as London opened its doors for business. This, as you can see, forced this market to momentarily surpass H4 support at 1085.4 and rebound from lows of 1084.0, just missing the H4 support area at 1079.9-1083.5 – a noted buy zone in our previous report (http://www.icmarkets.com/blog/wednesday-11th-november-daily-technical-outlook-and-review-u-s-canadian-bank-holidays-today/).
With price now showing supportive pressure from the long-term daily swap (support) level at 1085.1, and weekly action trading mid-range between a Quasimodo support at 1074.6 and the swap supply at 1098.6-1121.7, where do we go from here? Well, other than the above said H4 support area and the aforementioned weekly Quasimodo support level, we would not really be comfortable buying this market.
To the upside, however, sits Monday’s high at 1095.6 (structures in between current price and this number is not really considered significant in our book due to it being positioned close to the above said high). Our team has absolutely no interest in attempting to fade 1095.6, as we remain drawn to the broken Quasimodo line seen above it at 1101.2. The reason for why is because this number is surrounded by not only a weekly swap (supply) area at 1098.6-1121.7, but also its partner swap supply on the daily timeframe at 1098.6-1108.6. Despite this level being supported by higher timeframe supplies, we would still recommend waiting for lower timeframe confirmation to present itself before shorting to avoid the possibility of being stopped on a fake above this level.
Levels to watch/live orders:
- Buys: 1079.9-1083.5 [Tentative – confirmation required] (Stop loss: dependent on where one confirms this area) 1074.6 [Tentative – confirmation required] (Stop loss: dependent on where one confirms this level).
- Sells: 1101.2 [Tentative – confirmation required] (Stop loss: dependent on where one confirms this level).