A note on lower timeframe confirming price action…
Waiting for lower timeframe confirmation is our main tool to confirm strength within higher timeframe zones, andhas really been the key to our trading success. It takes a little time to understand the subtle nuances, however, as each trade is never the same, but once you master the rhythm so to speak, you will be saved from countless unnecessary losing trades. The following is a list of what we look for:
- A break/retest of supply or demand dependent on which way you’re trading.
- A trendline break/retest.
- Buying/selling tails – essentially we look for a cluster of very obvious spikes off of lower timeframe support and resistance levels within the higher timeframe zone.
- Candlestick patterns. We tend to only stick with pin bars and engulfing bars as these have proven to be the most effective.
EUR/USD:
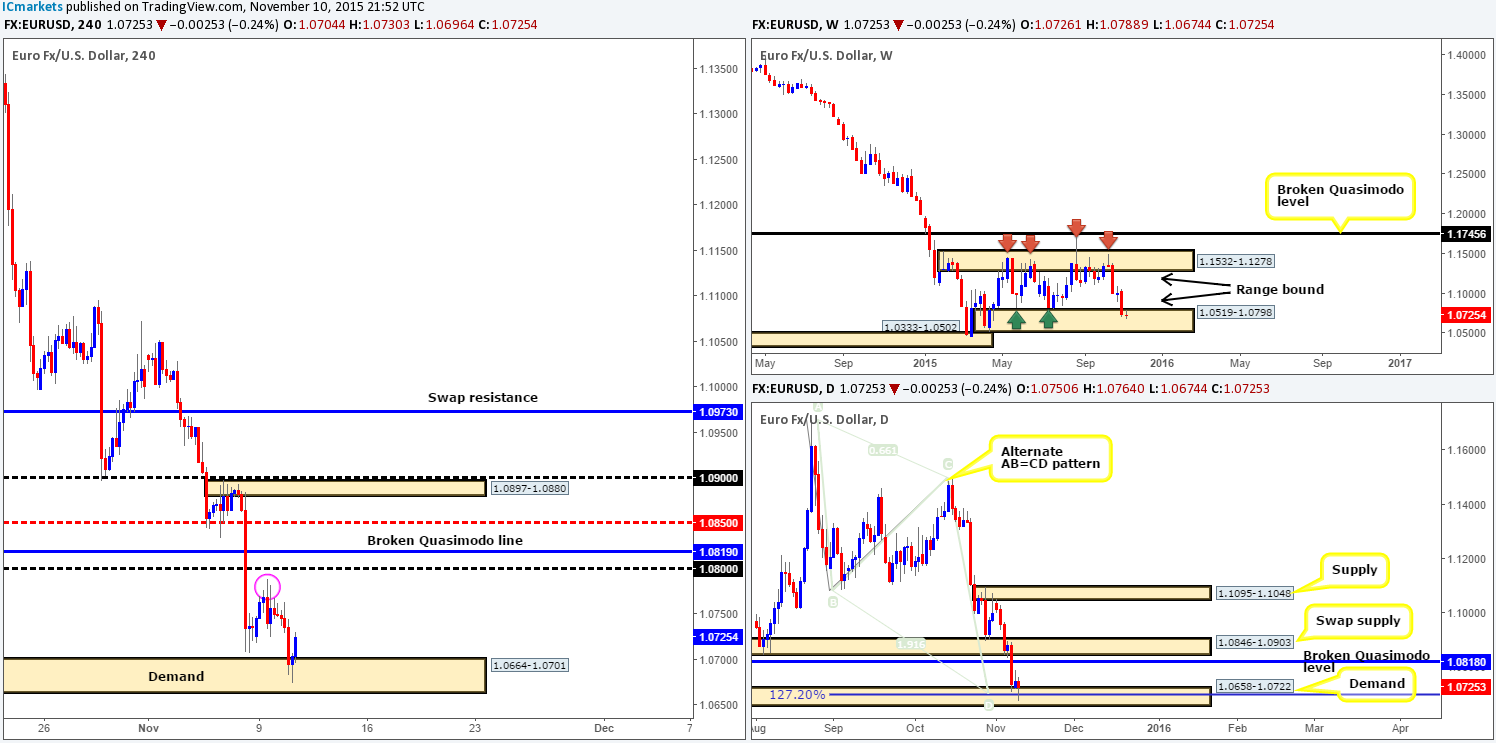
For those who read our previous report on the EUR (http://www.icmarkets.com/blog/tuesday-10th-november-daily-technical-outlook-and-review/), you may recall us mentioning that we were still looking for price to drive lower and break below Friday’s lows 1.0707 into demand at 1.0664-1.0701 to enter long. As shown on the H4 chart, price did exactly that. Relatively aggressive sellers entered the market around yesterday’s London open and pushed trade deep into the above said demand reaching lows of 1.0674 on the day.
Consequent to this, we managed to spot a nice-looking buy entry on the M15 chart. After price stabbed deep into an M15 supply at 1.0712-1.0701 and retraced back to its origin – demand at 1.0674-1.0684, we entered long and were filled at 1.06852 around 5pm GMT. 50% of our position is now locked in on the retest of psychological support 1.0700 (seen clearer on the M15) and our stop is now set to breakeven.
Given the fact that not only is price trading within a weekly range demand at 1.0519-1.0798, but is also responding nicely to daily demand at coming in at 1.0658-1.0722 (this daily area not only sits within the above said weekly range demand, but also coincides nicely with a bullish alternate AB=CD pattern at 1.0697), we’re confident higher prices are on the horizon. At this point, we now have our eye on Monday highs (pink circle) at 1.0788 to take further profits, followed closely by psychological resistance 1.0800.
Levels to watch/live orders:
- Buys: 1.06852 [LIVE] (Stop loss: breakeven).
- Sells:Flat (Stop loss: N/A).
GBP/USD:
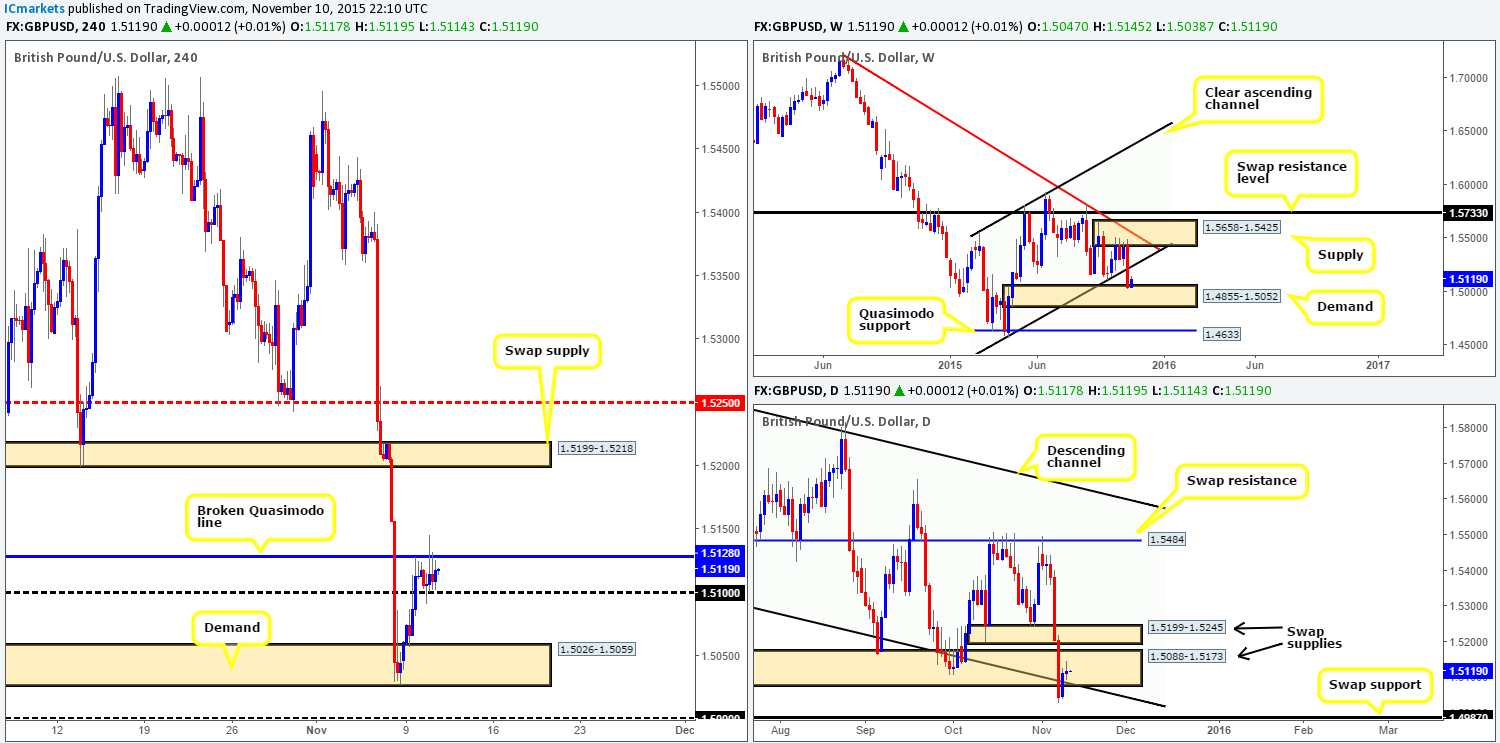
Following a solid correction from the H4 demand at 1.5026-1.5059 on Monday, yesterday’s action ended the day largely unchanged. Price peaked at a high of 1.5145 and recorded lows of 1.5091. With this, a clear-cut indecision candle was painted on the daily timeframe within the swap supply at 1.5088-1.5173, whilst the weekly demand at 1.4855-1.5052 is, for the time being, holding firm.
Due to the somewhat lackluster performance seen yesterday, much of the following will remain the same as our previous report… Given that there is, shall we say, a difference of opinion being seen between the weekly and daily timeframes at the moment (see above in bold), our approach to this market will be as follows…
Between the H4 broken Quasimodo line at 1.5128 and the 1.5100 figure – thiswill be a key area to watch today. We say this simply because a close above this barrier could indicate longs are possible on any confirmed retest of this area up to the swap supply at 1.5199-1.5218. On the other hand, should the sellers hold ground here (watch for confirmed sells), there is a possibility this market could drive back down to the aforementioned H4 demand area, and due to how deep price has driven into this zone already, maybe even the large psychological support below it at 1.5000. On that note, this number – coupled with the daily swap (support) barrier seen just below it at 1.4987, makes this one heck of a buy zone to keep a tab on this week.
Levels to watch/ live orders:
- Buys: Watch for offers to be consumed around 1.5128 and then look to trade any retest seen at this level (confirmation required).
- Sells: 1.5128/1.5100 [Tentative – confirmation required] (Stop loss: dependent on where one confirms this area).
AUD/USD:
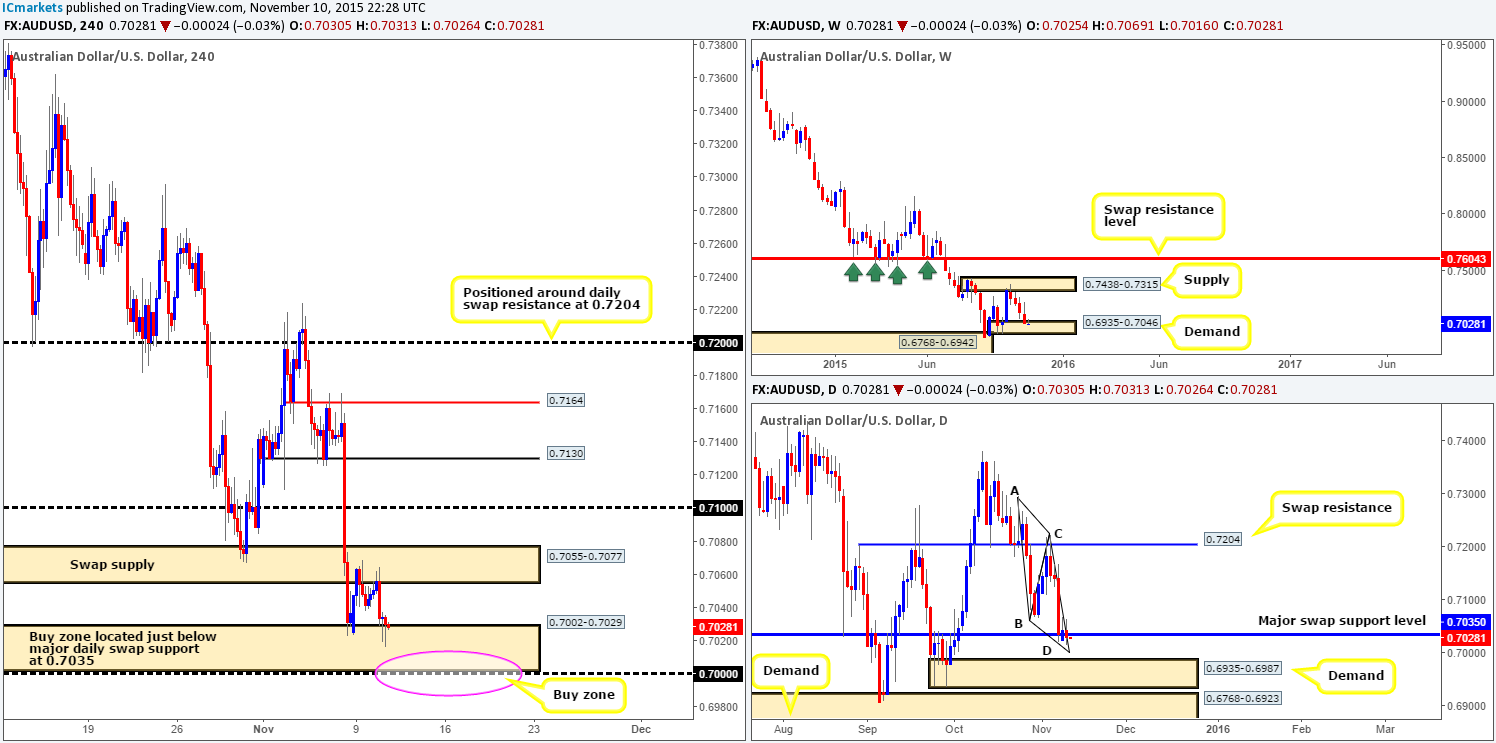
Mid-way through yesterday’s London trade, the AUD sold off against the U.S. dollar from the underside of a H4 swap (supply) area coming in at 0.7055-0.7077, and once again pierced into H4 demand at 0.7002-0.7029. Although price is currently trading around both a weekly demand at 0.6935-0.7046, and also a swap support level on the daily timeframe at 0.7035, we would still like to see a drive lower before we commit to longs. Here’s why…
The lower limits of the above said H4 demand represents not only a huge psychological support at 0.7000, it is also a bottom of an AB=CD bull pattern on the daily timeframe! Therefore, a very nice place to be looking to enter long from today should price reach this low. Nevertheless, due there being no defined base in which to place a stop-loss order around the 0.7000 region, we would only feel comfortable entering here with lower timeframe buying confirmation.
Levels to watch/ live orders:
- Buys:0.7000 region [Tentative – confirmation required] (Stop loss: dependent on where one confirms this level).
- Sells:Flat (Stop loss: N/A).
USD/JPY:
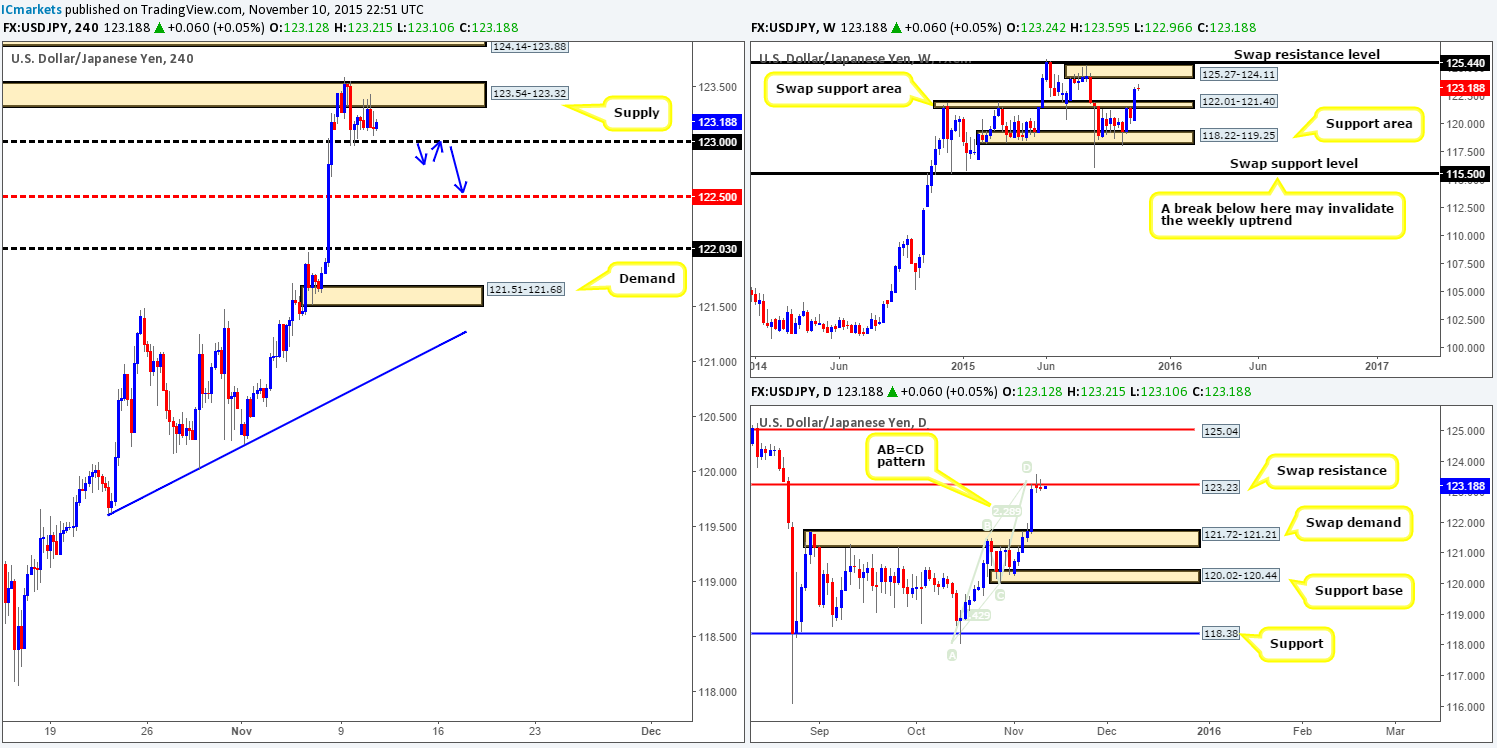
Starting from the top this morning, we can see that weekly action is currently loitering mid-range between a swap support area at 122.01-121.40, and a supply zone drawn from 125.27-124.11. Meanwhile, down on the daily timeframe, market action is currently being held lower by a swap resistance level at 123.33, which converges beautifully with an AB=CD bear top at 123.43.
Turning our attention to the H4 timeframe, however, price has clearly stagnated for the time being between supply coming in at 123.54-123.32 and psychological support 123.00. Ideally, seeing as price is presently holding firm at a daily resistance barrier (see above), we’d like to see this market close below 123.00 and retest it as resistance (blue arrows). Only then would we be confident to begin looking for a confirmed short into this market, targeting the mid-level support 122.50 first and foremost. A break to the upside, however, is a difficult one to judge, due to supply lurking just above at 124.14-123.88. Therefore, we’re favoring, and dare we say it: ‘hoping’, for a break lower today.
Levels to watch/ live orders:
- Buys: Flat (Stop loss: N/A).
- Sells: Watch for bids to be consumed around 123.00 and then look to trade any retest seen at this level (confirmation required).
USD/CAD: (Slightly revised)
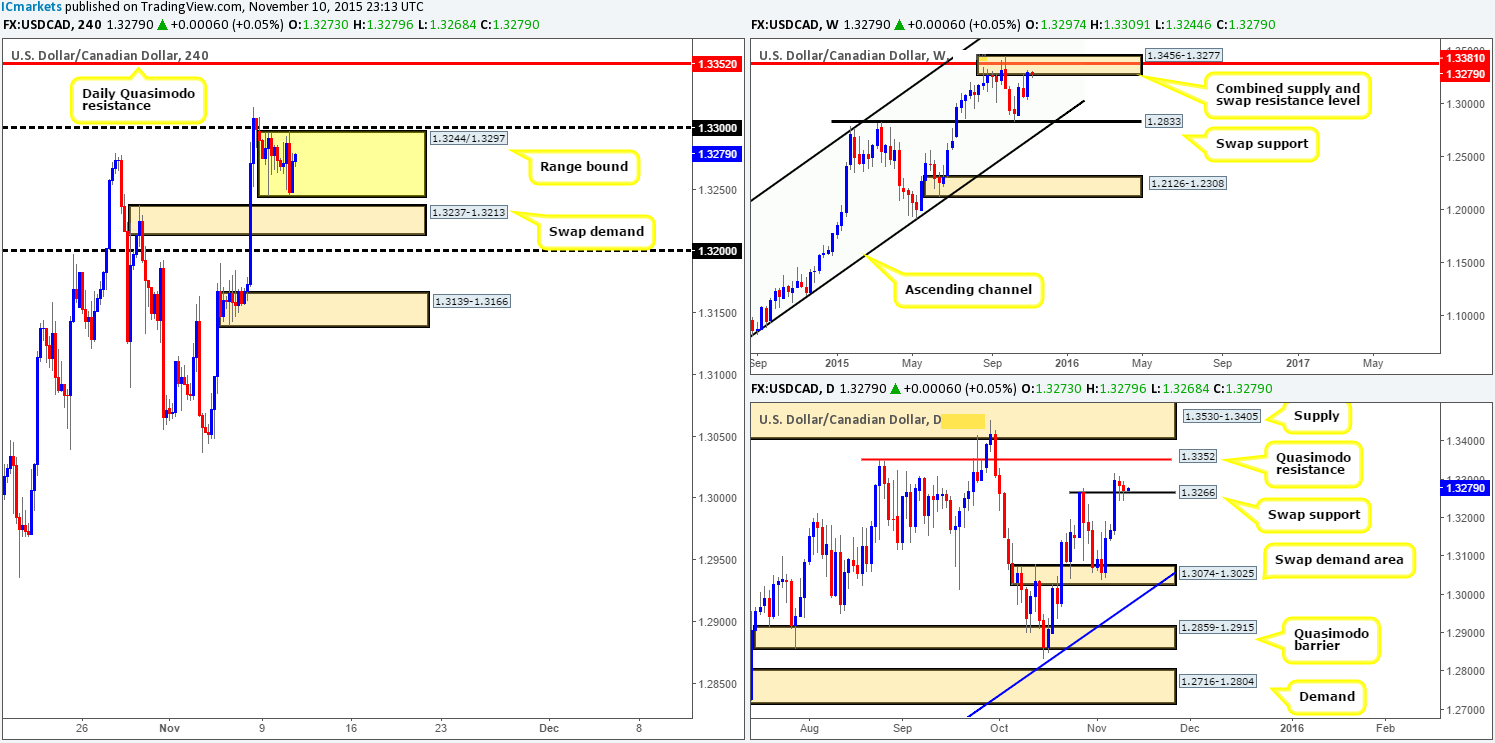
From the H4 timeframe, we can clearly see that the USD/CAD has now entered into a phase of consolidation between 1.3244/1.3297. Given this, where do we now stand in the bigger picture? Well, up on the weekly timeframe price remains flirting with the underside of a combined weekly supply and swap resistance area at 1.3456-1.3277/1.3381. Down into the pits of the daily timeframe, however, trade action appears to be holding relatively firm around a swap support hurdle drawn from 1.3266. As such, at least as far as we see, there is no direction on this pair for the time being –H4 is range bound, weekly sits at supply, while daily sits at support!
Beyond the current H4 range, nevertheless, sits a swap demand area just below at 1.3237-1.3213. To the upside, we see a daily Quasimodo resistance level at 1.3352. Ultimately, we are not interested in trading this pair right now. Be that as it may, should trade breakout north today and connect with the aforementioned daily Quasimodo resistance, we would begin looking for a lower timeframe setup to short here. The reason for why simply comes from this level sitting so neatly within the above said weekly combined supply and swap resistance zone.
Levels to watch/ live orders:
- Buys:Flat (stop loss: N/A).
- Sells:1.3352 [Tentative – confirmation required] (Stop loss: dependent on where one confirms this level).
USD/CHF:
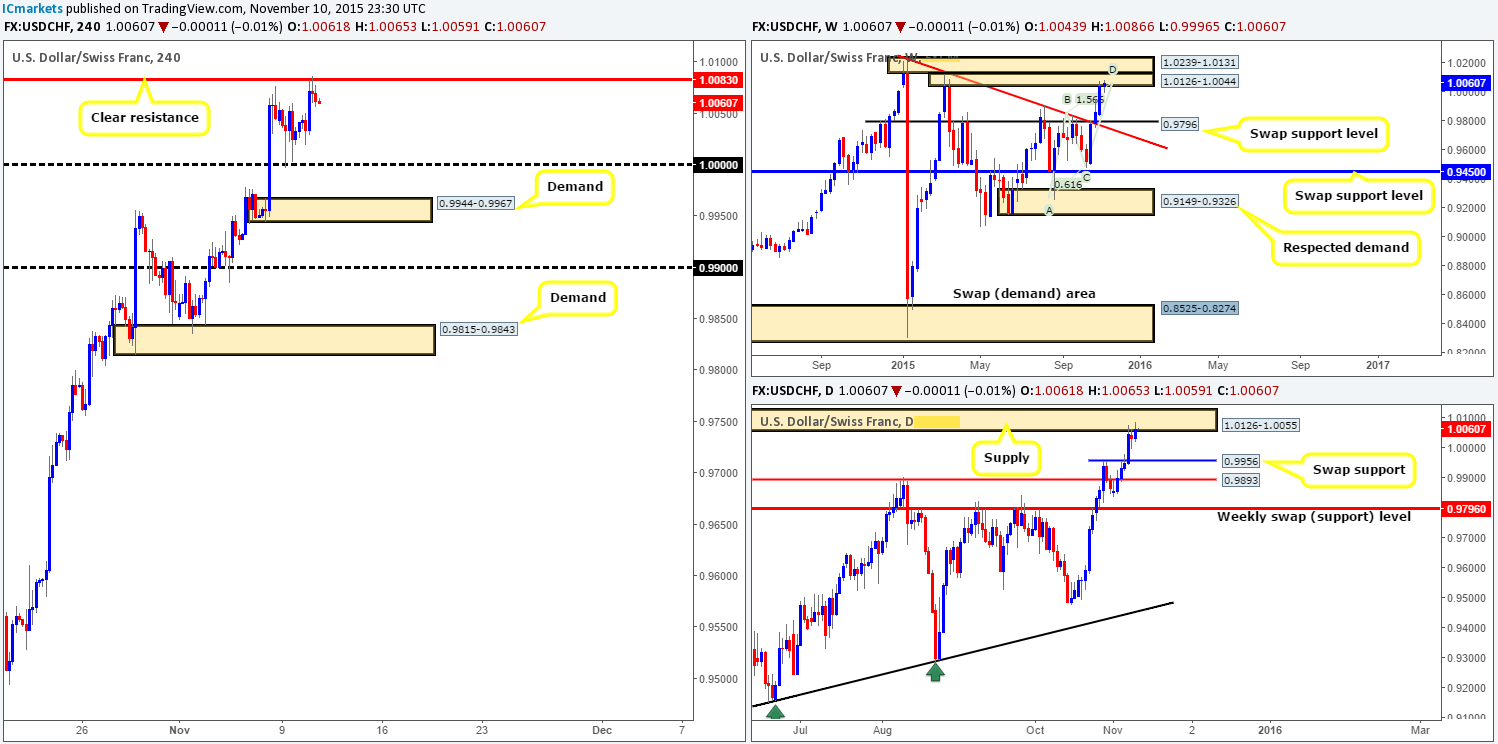
For anyone who read our previous report on this pair (http://www.icmarkets.com/blog/tuesday-10th-november-daily-technical-outlook-and-review/), you may remember us noting that we were looking for price to break above Friday’s high 1.0076 and attack the 4hr resistance level seen just above it at 1.0083. As can be seen from the chart, price did exactly that. For us, however, we passed on this trade completely as we were already long the EUR/USD. Taking a short on this pair and a long on the EUR/USD might not be the best path to take due to the negative correlation that exists.
We do hope some of our readers took advantage of this setup as it has potential for a nice sell-off given the higher timeframe picture. Weekly action is currently trading at the lower limits of a stacked supply formation coming in at 1.0126-1.0044 (upper zone is seen at 1.0239-1.0131). Additionally, we also see a nice-looking AB=CD Harmonic pattern completing around 1.0046 region. Similar to that of the weekly timeframe, daily action shows price now kissing the underside of supply drawn from 1.0126-1.0055 (ties in lovely with the weekly supply area mentioned above at 1.0126-1.0044). Assuming that we were short this pair, however, we’d now be eyeing parity as our immediate take-profit zone. Other than this, we see little opportunity on this pair right now.
Levels to watch/ live orders:
- Buys:Flat (Stop loss: N/A).
- Sells:Flat (Stop loss: N/A).
DOW 30:
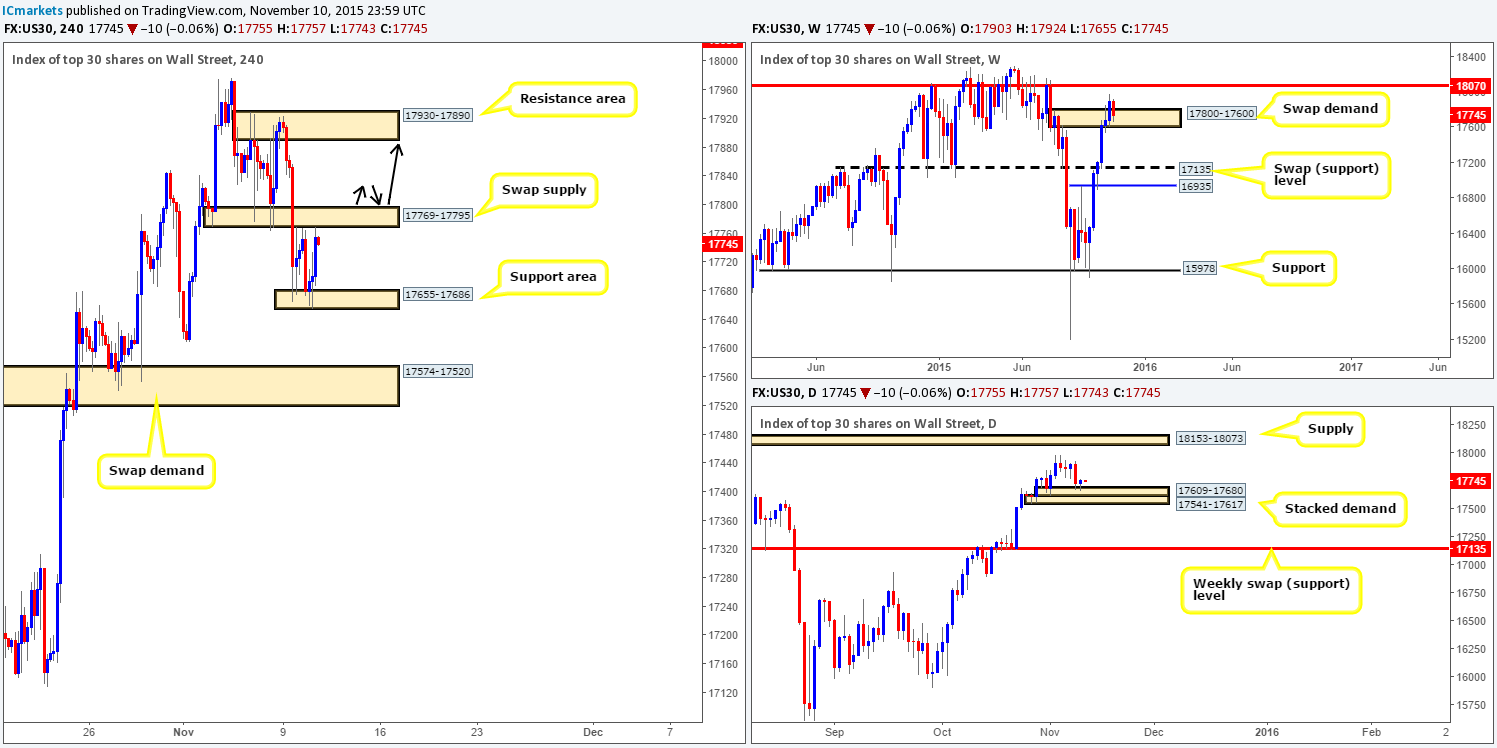
Beginning with the weekly timeframe this morning, current action shows price remains trading within the swap demand zone at 17800-17600. Meanwhile, down on the daily picture, the DOW printed a small, but relatively firm buying tail off the top-side of a stacked demand formation at 17541-17617/17609-17680 yesterday.
However, moving down into the H4 timeframe, we can clearly see that price has entered into a phase of consolidation between a support area coming in at 17655-17686, and a swap supply zone drawn from 17769-17795. Given where this market is positioned on the higher timeframe picture (see above) right now, we have no intention in selling this index even though price is currently flirting with the underside of the above said H4 range. Instead, what we’re looking for is a close above this consolidation. This will effectively do two things. Firstly, it potentially sets the stage for a continuation move north up to the resistance area coming in at 17930-17890. Secondly, supposing that the broken area is retested, we may get the opportunity to buy here in the event a lower timeframe setup is seen (check out the black arrows).
Levels to watch/ live orders:
- Buys:Watch for offers to be consumed around 17769-17795and then look to trade any retest seen at this area (confirmation required).
- Sells: Flat (Stop loss: N/A).
XAU/USD: (Gold)
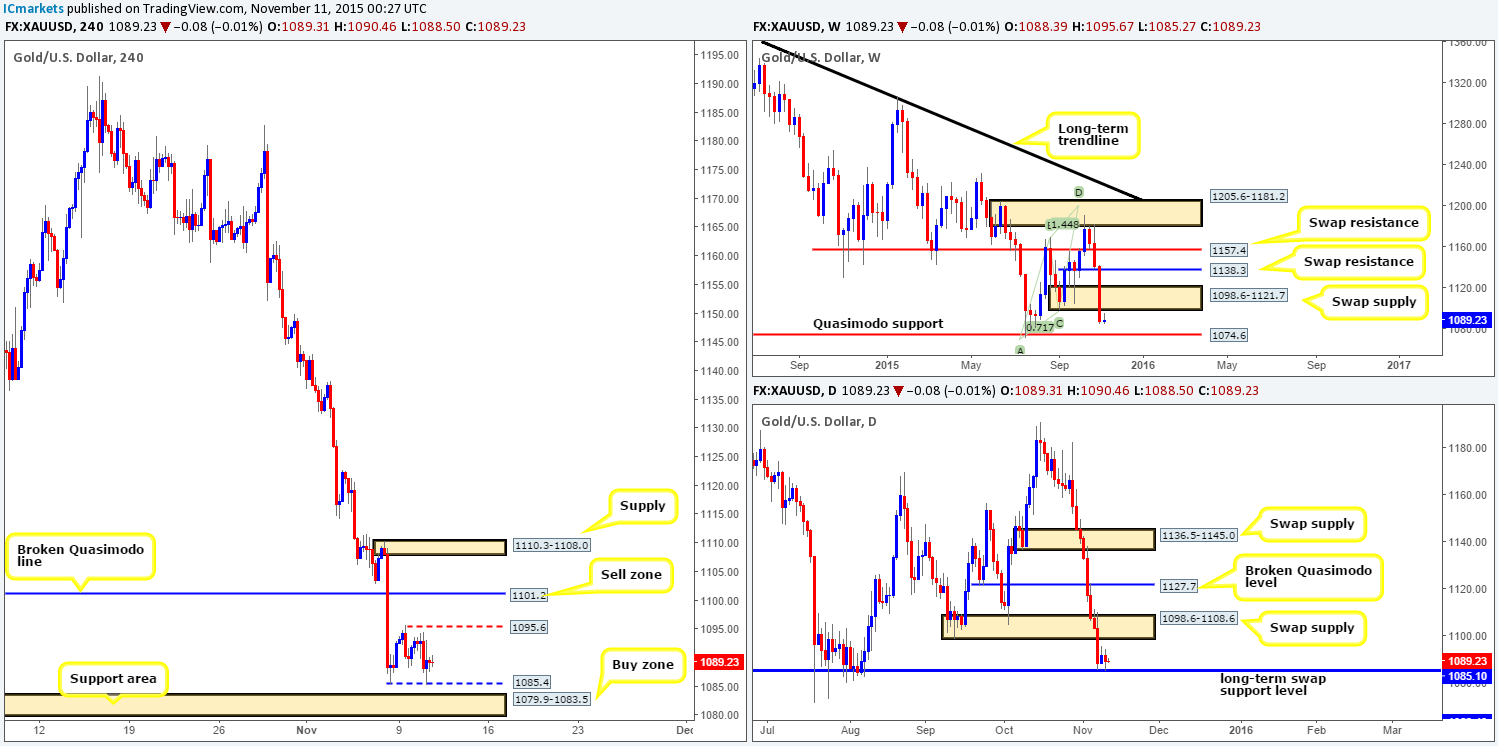
Much like Monday, yesterday’s action was not anything to get excited about. Mid-way through London trade Gold sold off, consequently forcing price to collide almost to-the-pip with Friday’s low 1085.4, which, as you can see, held firm into the close 1089.3.Due to the lack of movement seen on Gold recently, much of the following analysis will remain similar to the previous…
Directly below 1085.4 sits a nice-looking support area drawn from 1079.9-1083.5, which has to potential to bounce prices since it is also positioned just below the long-term swap support level on the daily timeframe at 1085.1. This is an area we have had our eye on for the past few days as a possible buy zone. However, be warned here traders, this area also has the potential to be faked, seeing as this zone sits not too far from a weekly Quasimodo level at 1074.6. With that, we believe the most logical way to approach this barrier is to wait for the lower timeframes (preferably on the 30/60 minute timeframes) to show some form of confirming price action before considering a long.
To the upside, nonetheless, sits Monday’s high at 1095.6. We have no interest in attempting to fade this level, as we remain drawn to the broken Quasimodo line seen above it at 1101.2. The reason for why is because this number is surrounded by not only a weekly swap (supply) area at 1098.6-1121.7, but also its partner swap supply on the daily timeframe at 1098.6-1108.6. Despite this level being supported by higher timeframe supplies, we would still recommend waiting for lower timeframe confirmation to present itself before shorting to avoid the possibility of being stopped on a fake above this level.
Levels to watch/live orders:
- Buys:1079.9-1083.5 [Tentative – confirmation required] (Stop loss: dependent on where one confirms this area).
- Sells: 1101.2 [Tentative – confirmation required] (Stop loss: dependent on where one confirms this level).


