
Key risk events today:
US Core PPI m/m and PPI m/m; EUR Main Refinancing Rate, Monetary Policy Statement and ECB Press Conference.
(Previous analysis as well as outside sources – italics).
EUR/USD:
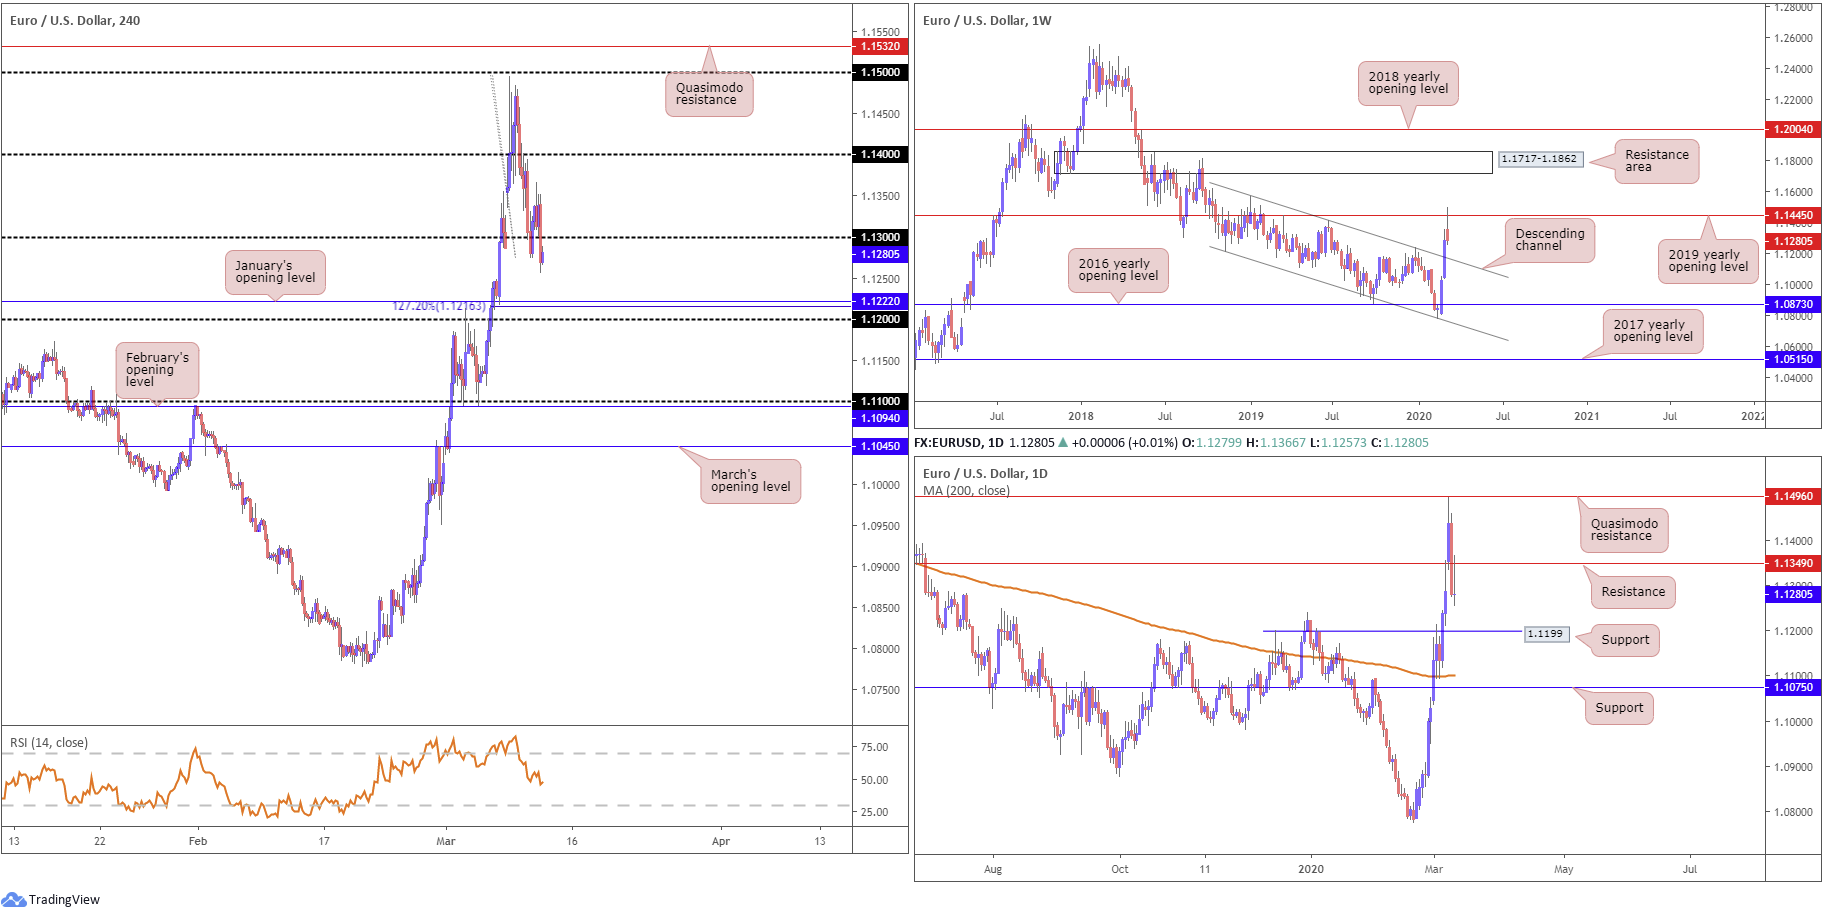
Europe’s shared currency coasted lower Wednesday, fading session peaks at 1.1366. As markets ready themselves for the European Central Bank, H4 price is seen languishing marginally south of 1.13, testing lows of 1.1257. US inflation data (CPI) announced modestly optimistic figures in February, though was largely ignored by market price.
With 1.13 labelled as potential resistance, January’s opening level at 1.1222 may welcome an approach on the H4 today, stalked closely by a 127.2% Fibonacci extension level at 1.1216 and the 1.12 handle. Indicator-based traders may also note the relative strength index (RSI) dipped its toes in waters beneath 50.00, indicating a bearish theme.
The 2019 yearly opening level from 1.1445 on the weekly timeframe – a noted port of resistance boasting incredibly strong history – entered view in recent trading, potentially setting the stage for an approach to a long-standing channel resistance-turned support, extended from the high 1.1569. The story on the daily timeframe had price chew through support at 1.1349 on Tuesday, with Wednesday engaging the level as resistance. Support is seen reasonably close by at 1.1199, a prior Quasimodo resistance, with a break likely pointing the finger to the 200-day SMA (orange – 1.1101).
Areas of consideration:
In light of the recent crossing below support at 1.1349 on the daily scale and weekly action fading major resistance, bearish themes south of 1.13 could be an option today on the H4. Conservative traders, of course, may wait and see if a retest at 1.13 occurs before committing, strengthening the odds of a favourable trade, targeting 1.1222 as an initial base.
GBP/USD:
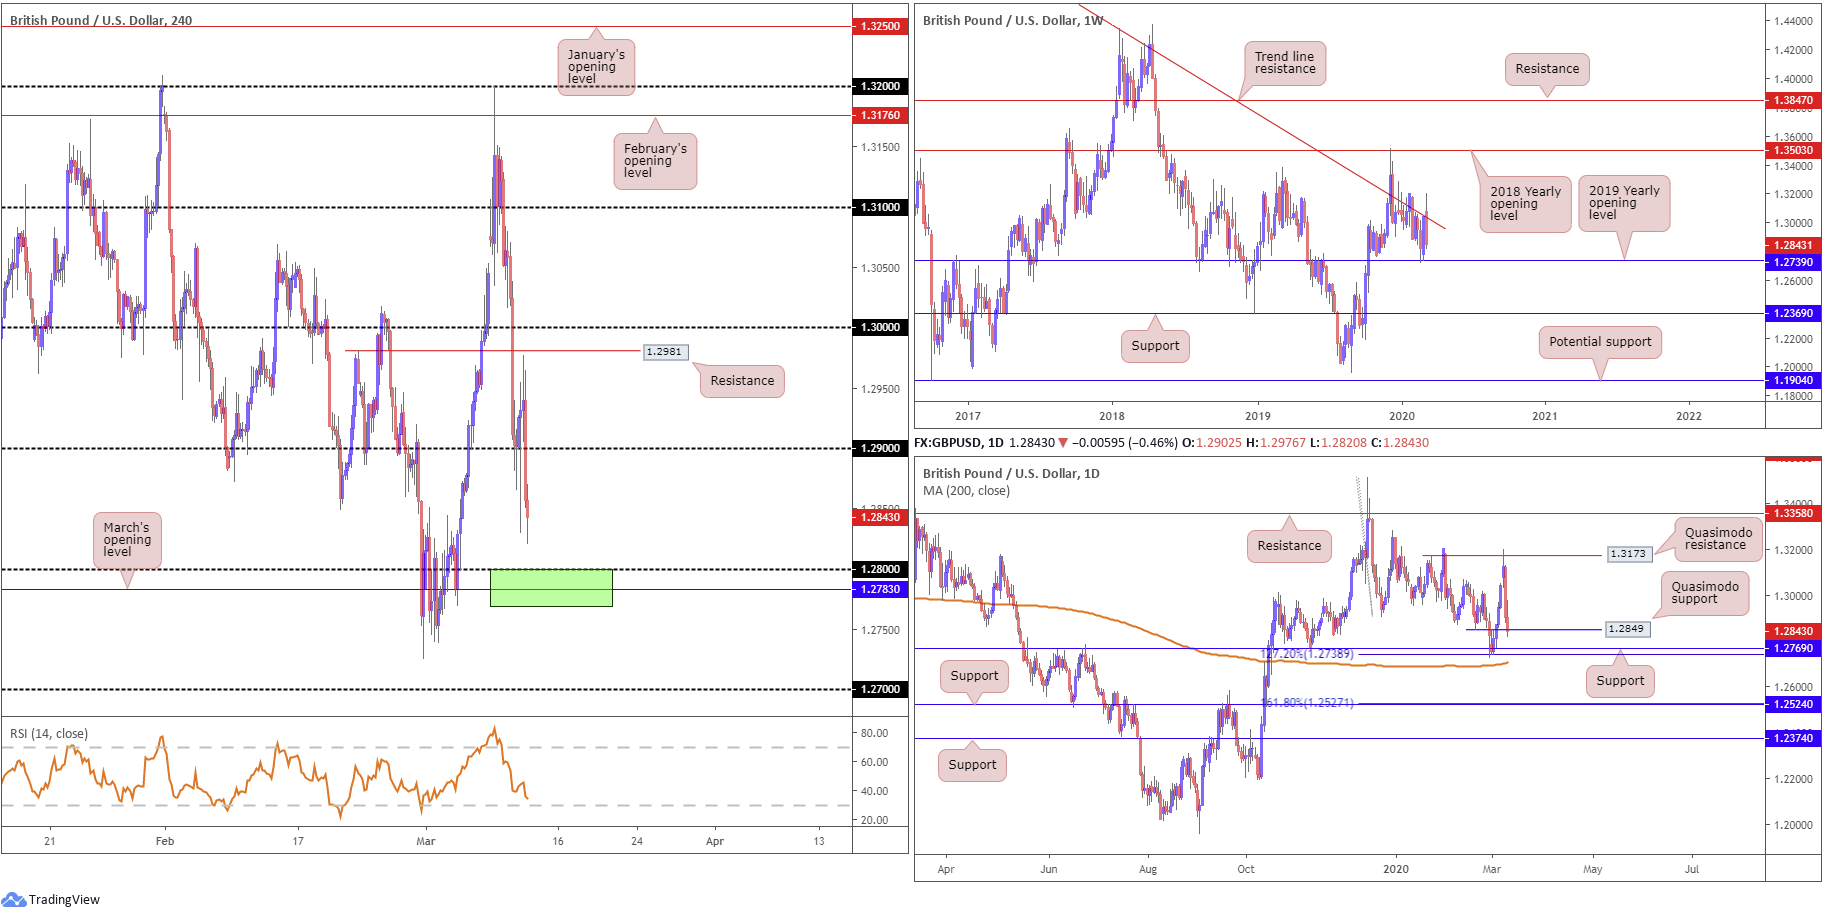
Wednesday observed a knee-jerk spike to lows of 1.2830 following the Bank of England (BoE) announcing a 50 bp rate cut ahead of the FTSE open. Though 1.29 survived the initial attack, UK budget proposals failed to provide any meaningful impetus. Leaving H4 resistance at 1.2981 unchallenged, a decisive move through 1.29 occurred, with the unit now poised to shake hands with 1.28, and March’s opening level at 1.2783. Recent selling also weighed on the relative strength index (RSI), seen closing in on oversold terrain.
Price action on the weekly timeframe saw long-standing trend line resistance, pencilled in from the high 1.5930, regain position this week. According to chart studies, the pair has scope to decline further, at least until crossing swords with the 2019 yearly opening level at 1.2739.
Daily Quasimodo support at 1.2849 failed to deliver much yesterday. Price is seen hovering south of the base, with eyes for support at 1.2769, a 127.2% Fibonacci extension at 1.2738 and the 200-day SMA (orange – 1.2703). Note this SMA is beginning to show signs of turning higher.
Areas of consideration:
Daily Quasimodo support at 1.2849 recently caving in shines the spotlight on the area marked in green on the H4 between 1.2769/1.28. Made up of daily support at 1.2769, March’s opening level at 1.2783 and the 1.28 handle, this base may entice buyers today. The caveat, however, is a potential move to weekly support at 1.2739, which aligns with the 127.2% Fibonacci extension at 1.2738 on the daily timeframe. Therefore, waiting for additional bullish candlestick confirmation to form out of 1.2769/1.28 before pulling the trigger may be an idea worth exploring.
AUD/USD:
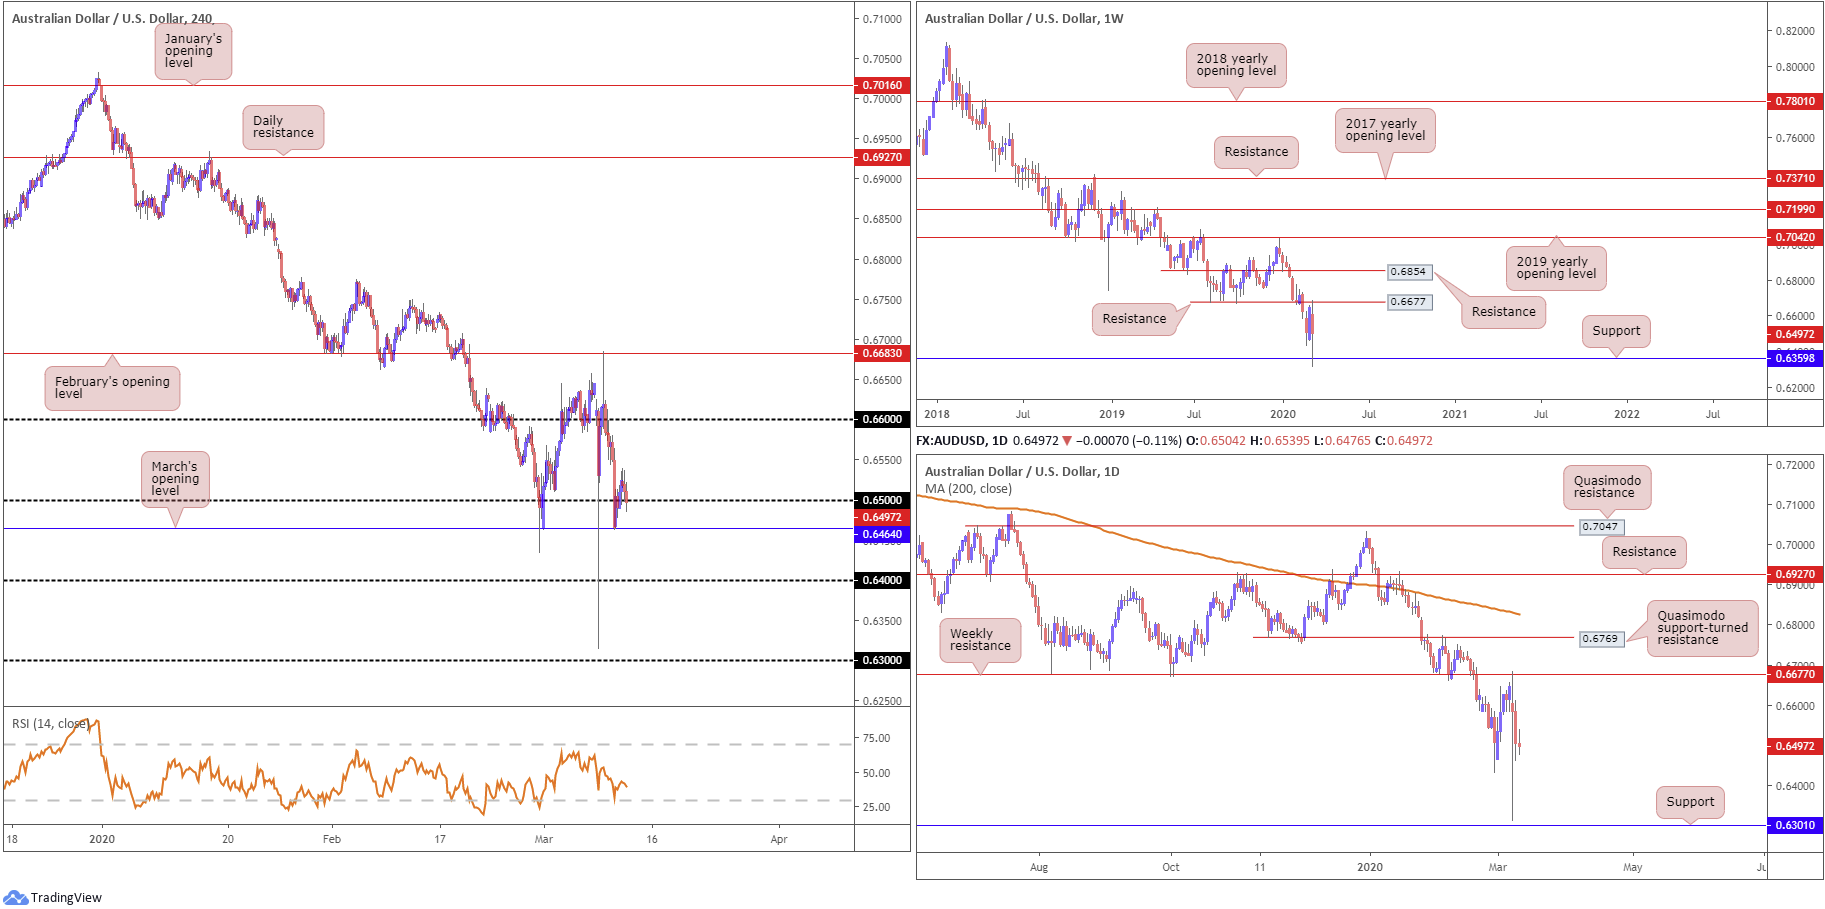
Despite ranging between 0.6539/0.6476, AUD/USD finished Wednesday pretty much unmoved, treading water a touch off Tuesday’s low 0.6462.
Technical headlines saw H4 recently knock on the door of 0.65, though is also nursing losses off March’s opening level at 0.6464. South of this band, room to explore lower ground to 0.64 is visible. This is largely due to both weekly and daily timeframes suggesting lower levels after fading weekly resistance parked at 0.6677. Weekly support at 0.6359 is seen as the next downside target on the higher timeframes.
It may also interest some traders to note the relative strength index (RSI) is seen loitering a few points ahead of oversold levels, after reaching a low of 27.00.
Areas of consideration:
According to the primary trend and higher-timeframe structure, the outlook is not bright for AUD/USD.
As a result, a H4 close below 0.6464 may be on the radar for some traders, with the possibility of an extension to 0.64 and maybe beyond. Breakout traders may feel the evidence provided justifies a sell on the breakout candle’s close; others, however, may seek a retest motion off 0.6464 before committing to a position. This, of course, is trader dependent.
USD/JPY:
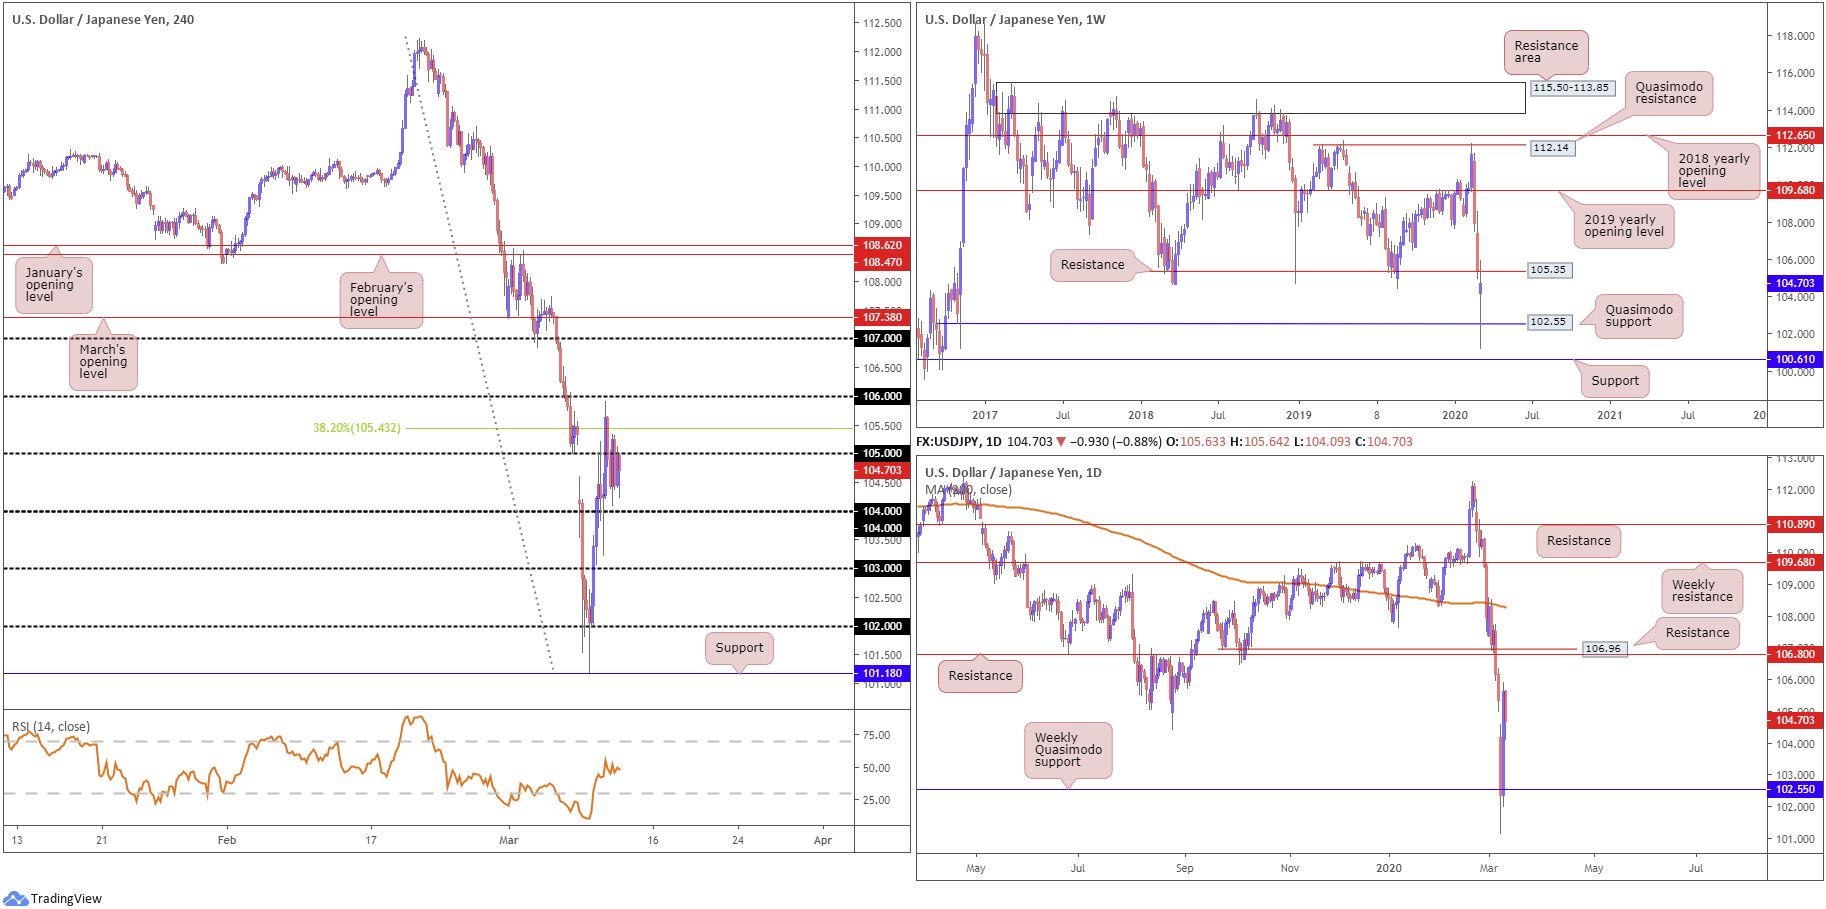
Although the US dollar index, or DXY, managed to reclaim lost ground Wednesday, USD/JPY remained under pressure as risk-off flows continued to dominate markets. Tuesday observed a number of big figures abandon ship, with price clocking highs at 105.91, a touch south of 106. The 38.2% Fibonacci retracement at 105.43 offers resistance, as the pair settled below 105. The relative strength index (RSI), for those who follow momentum oscillators, will note the value is seen fluctuating around the 50.00 value.
Movement on the weekly timeframe faded Quasimodo support at 102.55, with resistance at 105.35 containing upside. A breach realises minor swing lows potentially offering resistance, yet key resistance resides off the 2019 yearly opening level at 109.68.
A closer reading of price action on the daily timeframe shows price exhibits scope for moves higher, targeting resistance at 106.80 and 106.96, a Quasimodo support-turned resistance.
Areas of consideration:
Weekly price recently grasping familiar resistance at 105.35 will likely encourage increased selling. A H4 close below 104 may help further confirm seller intent off the weekly base, consequently shining the spotlight on 103 as the next downside target for shorts.
Upside, on the other hand, is complicated. Not only is 105 in the firing range, the 38.2% Fibonacci retracement at 105.43 offers resistance, while not forgetting weekly resistance 105.35.
USD/CAD:
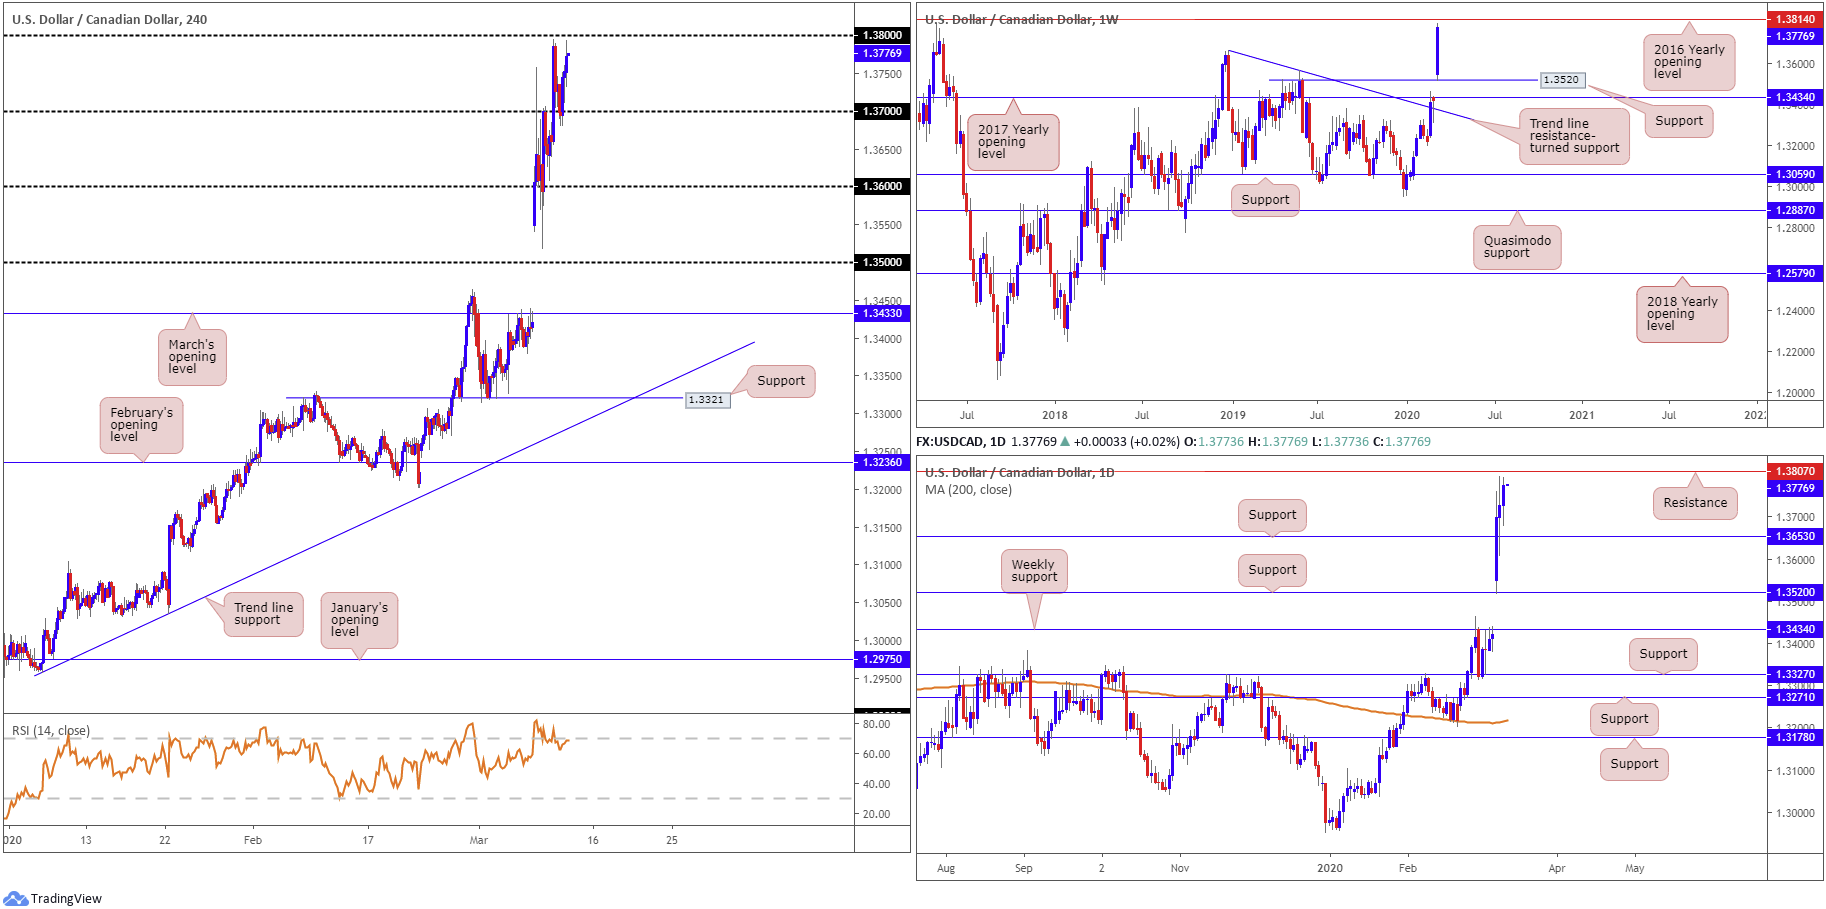
The US dollar firmed for a fifth successive session vs. the Canadian dollar Wednesday amid weaker oil prices and a modest uptick in the US dollar index. Although incapable of breaching Tuesday’s high 1.3796, 1.37 engaged as support on USD/CAD, with 1.38 now a tempting resistance.
The technical picture on the weekly timeframe has price eyeing the 2016 yearly opening level at 1.3814 after thrashing Quasimodo resistance at 1.3520, now a serving support. Support on the daily timeframe at 1.3653 remains in play, withstanding a notable downside attempt during Tuesday’s session. Resistance at 1.3807 is visible as the next upside target on this scale.
Areas of consideration:
Should we cross paths with 1.38, a fakeout above the level is likely, with weekly resistance at 1.3814 and daily resistance at 1.3807 calling for attention. Note buy-stop liquidity north of 1.38 will likely entice sellers, and pitch the candles south of 1.38.
Attempting a short from 1.3814/1.38, however, is considered countertrend (primary trend on the weekly timeframe seen north since September 2017). As such, a pullback, if any, might be shaky and unable to reconnect with 1.37.
USD/CHF:
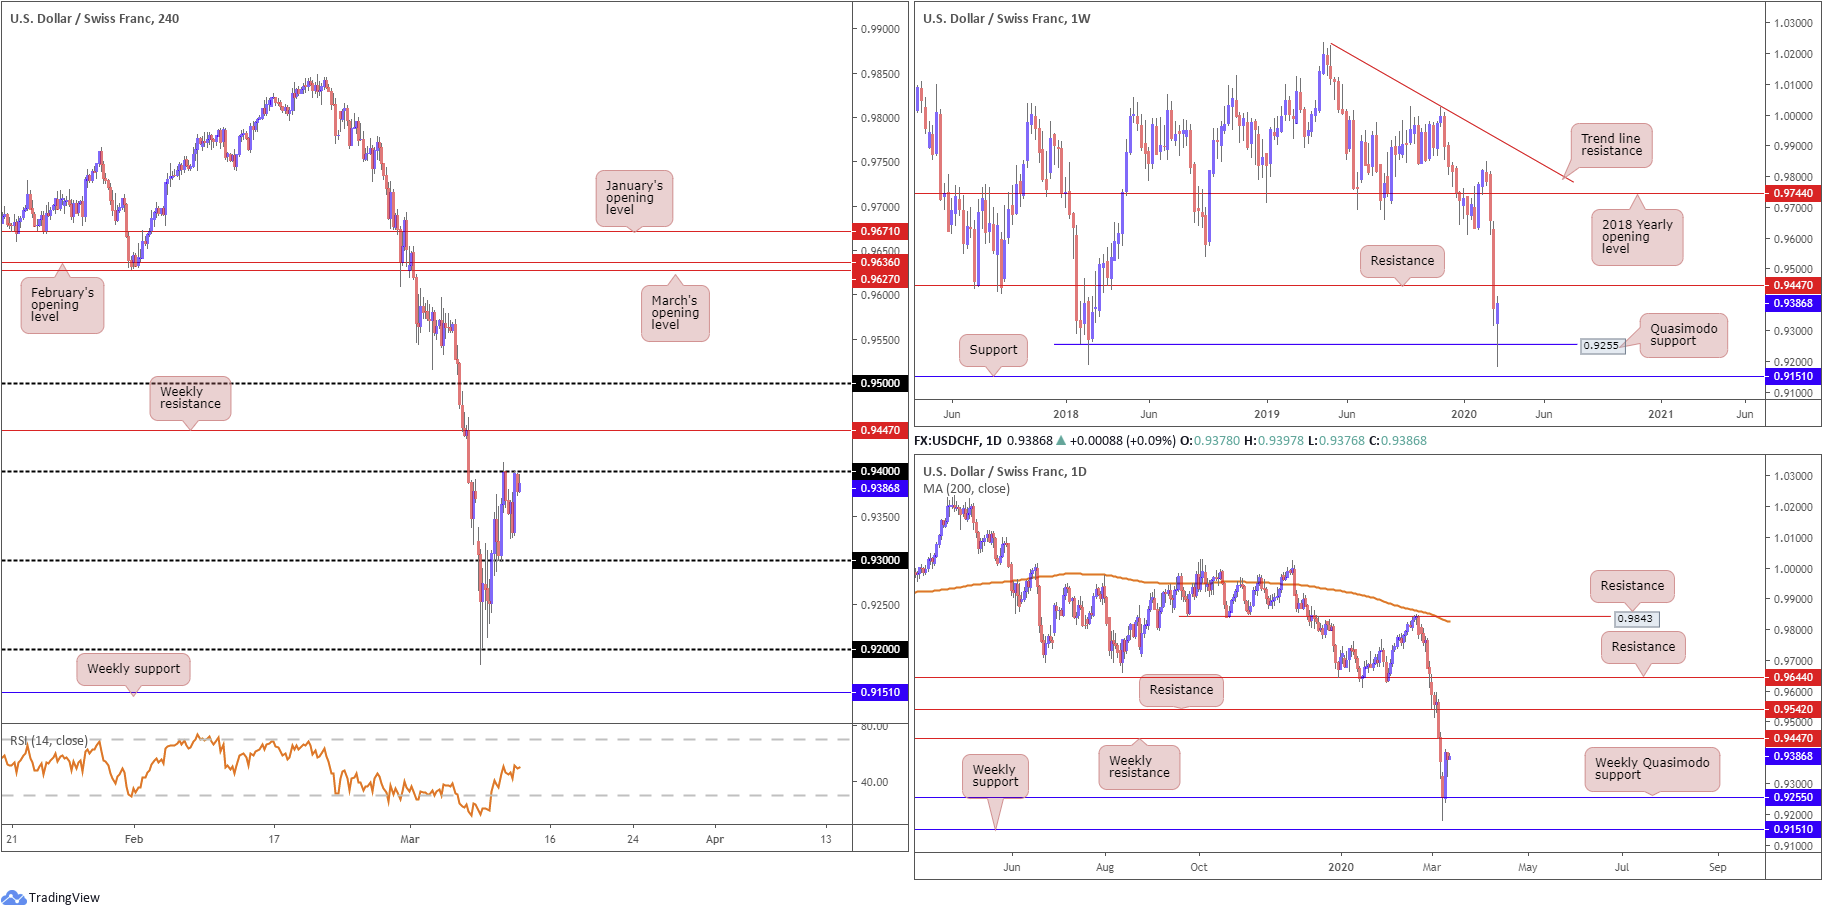
USD/CHF, although tipped to capitalise on recent gains based on higher-timeframe technical structure, scored modest losses Wednesday amid reviving safe-haven demand for the Swiss franc.
Quasimodo support on the weekly timeframe at 0.9255 recently capped downside, albeit after a brief spell to lows at 0.9182 (levels not seen since June 2015). Further recovery on this timeframe could extend as far north as resistance from 0.9447.
H4 action extended gains north of 0.92, running through 0.93 and retesting the latter as support Tuesday for an additional push to 0.94. This round number remained as resistance yesterday, with a break, as you can see, exposing the weekly resistance at 0.9447. Note the relative strength index (RSI) recently overthrew 50.00 after bottoming at 15.00 at the beginning of the week.
Areas of consideration:
A whipsaw through 0.94, tripping buy-stop liquidity, to weekly resistance at 0.9447, could be in the offing. While the recent recovery off weekly support likely attracted early buyers, upside lacks conviction until the weekly resistance mentioned above at 0.9447 is consumed. This level, therefore, may be an area fresh sellers join and current longs liquidate partial profits (essentially selling, too).
Conservative traders may want a H4 close back beneath 0.94 to form, after testing weekly resistance. Entry on the breakout candle is then an option, targeting 0.93 as the initial port of call.
Dow Jones Industrial Average:
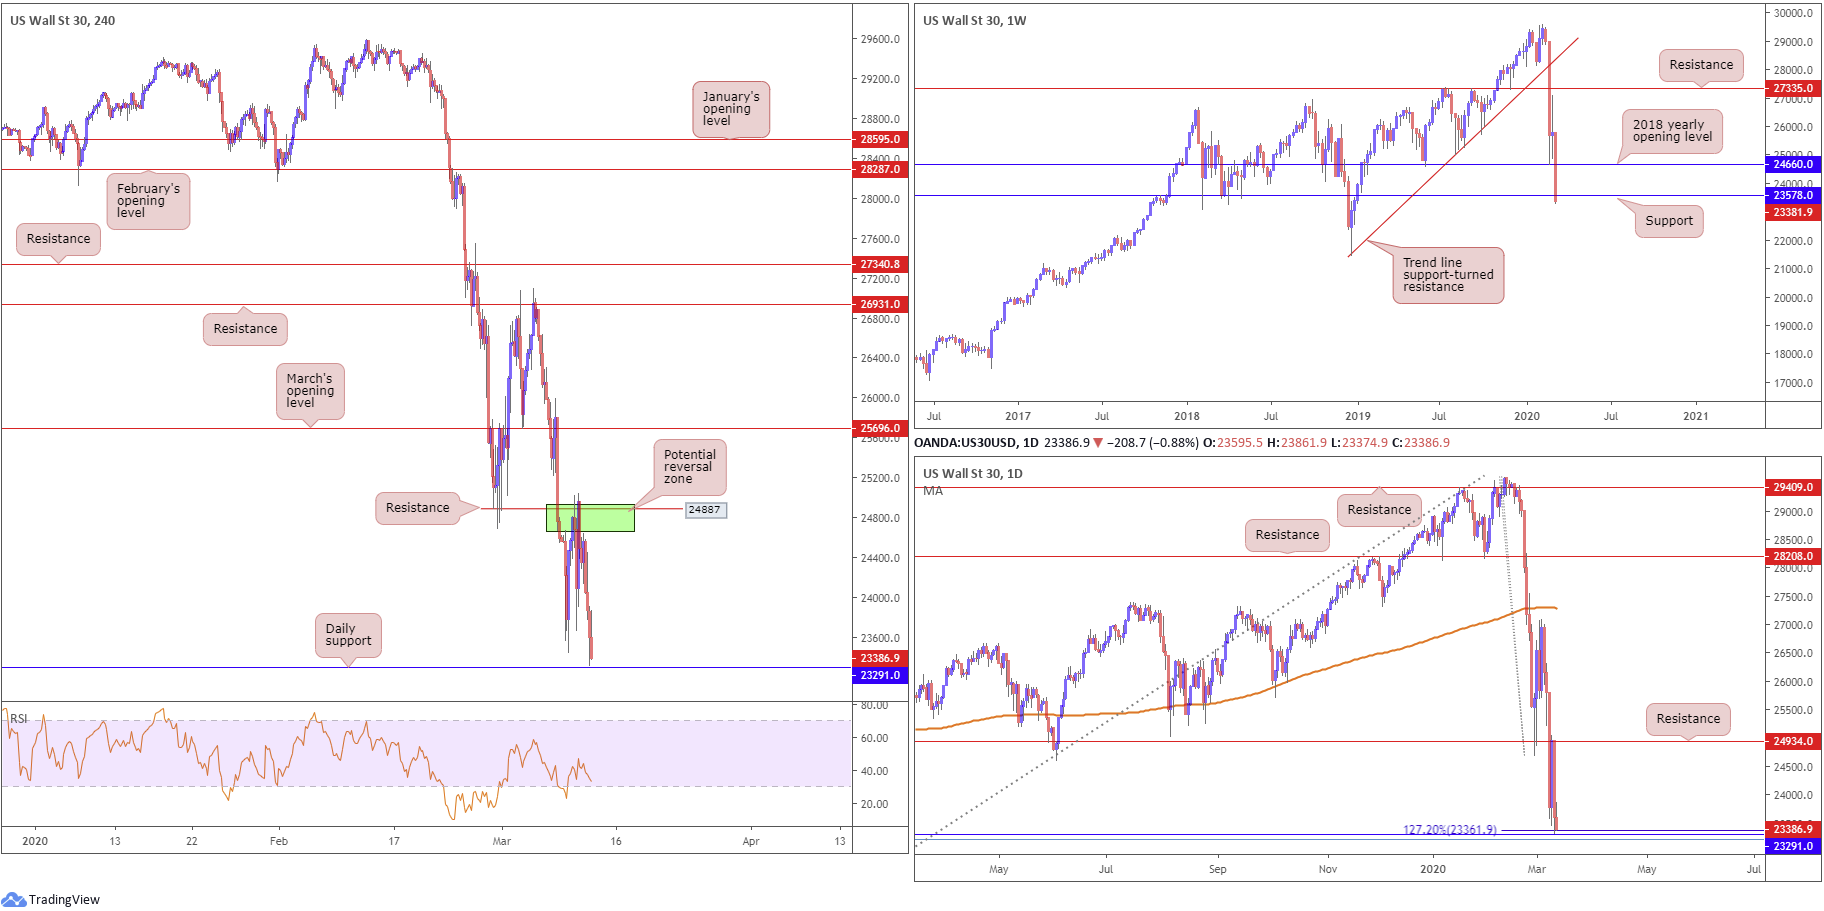
US equities plummeted Wednesday, with losses accelerating after the World Health Organization declared the coronavirus outbreak a pandemic. The Dow Jones Industrial Average erased 1464.94 points, or 5.86%; the S&P 500 also lost 140.85 points, or 4.89% and the tech-heavy Nasdaq 100 ended lower by 366.15 points, or 4.37%.
The Dow’s losses dragged it 20% below the record set last month and put the index in a bear market. Weekly price recently overthrew the 2018 yearly opening level at 24660 and also, in recent hours, support priced in at 23578. Daily price, on the other hand, hovers just north of support coming in at 23291, which boasts a 127.2% Fibonacci extension point at 23361 and a 78.6% Fibonacci retracement at 23205.
Across the page on the H4 timeframe, daily support mentioned above at 23291 represents a key fixture on this scale, with H4 resistance seen around 24887, a previous Quasimodo support level. Combined, this resistance level, along with daily resistance at 24934 and the 2018 yearly opening level at 24660 was a potential reversal area (green) to keep an eye on.
Areas of consideration:
Although weekly support at 23578 ceded ground in recent movement, daily support at 23291 is firmly on the radar right now. If a recovery takes shape today, 23291 appears an ideal location, given daily Fibonacci confluence.
XAU/USD (GOLD):
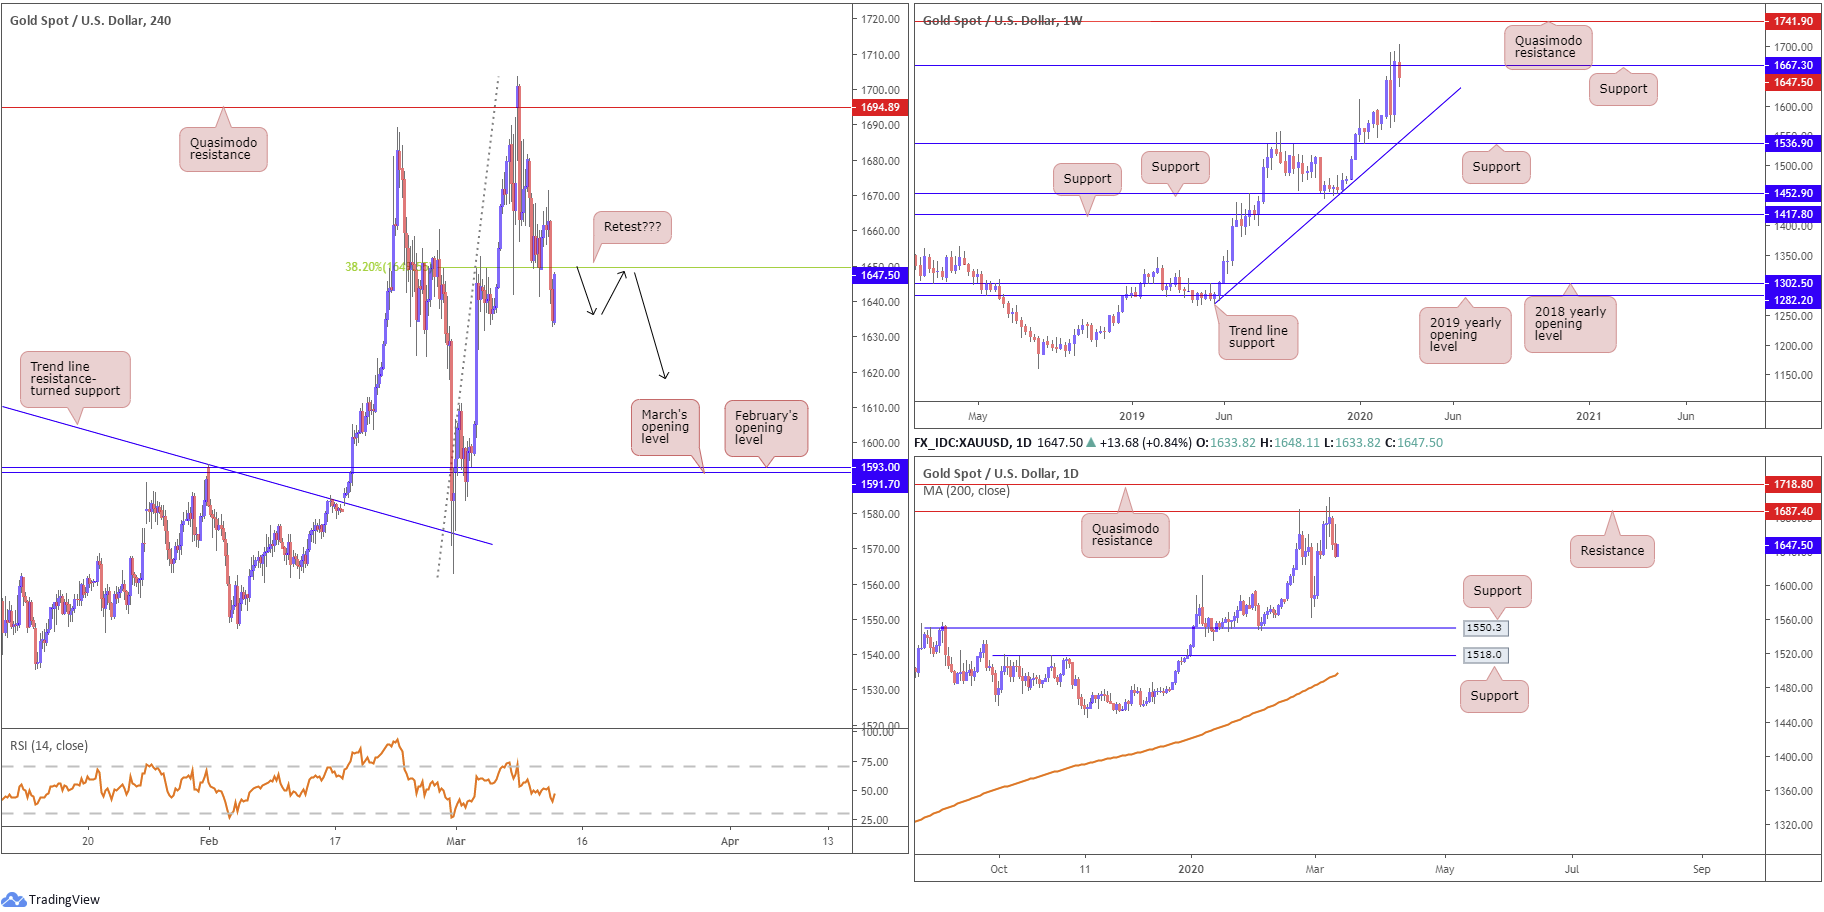
XAU/USD, in $ terms, extended its corrective slide Wednesday, weighed by the modest rebound in US Treasuries and the US dollar index.
Technically, H4 price has the unit languishing south of a familiar 38.2% Fibonacci retracement at 1649.9, after dipping from Quasimodo resistance at 1694.8. Recent moves could lead to an approach towards March and February’s opening levels at 1591.7 and 1593.0, respectively. With regards to the relative strength index (RSI) we’re seen trading slightly beneath 50.00 right now, suggesting the bears hold control.
Weekly price, after attempting to hold north of support at 1667.3, is seen dipping its toe in waters south of the said support, signifying we could be heading for trend line support, taken from the low 1269.6. Resistance on the daily timeframe at 1687.4 remains a dominant fixture on this timeframe. Continued downside from here has the 1563.1 February 28 low in sight, followed closely by support at 1550.3.
Areas of consideration:
Weekly support failing to offer much of a ‘floor’, as well as daily price navigating lower ground beneath resistance at 1687.4, may see further losses below 1649.9 (38.2% Fibonacci support) materialise on the H4 scale. A retest at 1649.9 will likely encourage sellers, particularly if the retest forms by way of a H4 bearish candlestick signal. Entry/risk parameters can then be set according to the candlestick’s structure, targeting 1590.0ish.
The accuracy, completeness and timeliness of the information contained on this site cannot be guaranteed. IC Markets does not warranty, guarantee or make any representations, or assume any liability regarding financial results based on the use of the information in the site.
News, views, opinions, recommendations and other information obtained from sources outside of www.icmarkets.com.au, used in this site are believed to be reliable, but we cannot guarantee their accuracy or completeness. All such information is subject to change at any time without notice. IC Markets assumes no responsibility for the content of any linked site.
The fact that such links may exist does not indicate approval or endorsement of any material contained on any linked site. IC Markets is not liable for any harm caused by the transmission, through accessing the services or information on this site, of a computer virus, or other computer code or programming device that might be used to access, delete, damage, disable, disrupt or otherwise impede in any manner, the operation of the site or of any user’s software, hardware, data or property.


