
Key risk events today:
BoE Financial Stability Report; ECB Monetary Policy Meeting Accounts; US CPI m/m and Core CPI m/m; RBA Assist Gov. Debelle Speaks; Fed Chair Powell Testifies; FOMC Member Quarles Speaks.
EUR/USD:
The broad US dollar index fell sharply Wednesday following the Semi-Annual Testimony statement from Federal Reserve chief Jerome Powell. Powell’s comments were interpreted as dovish – doing little to lean back on the notion the central bank will be cutting rates at the July meeting – consequently setting a clear risk-on tone in the markets.
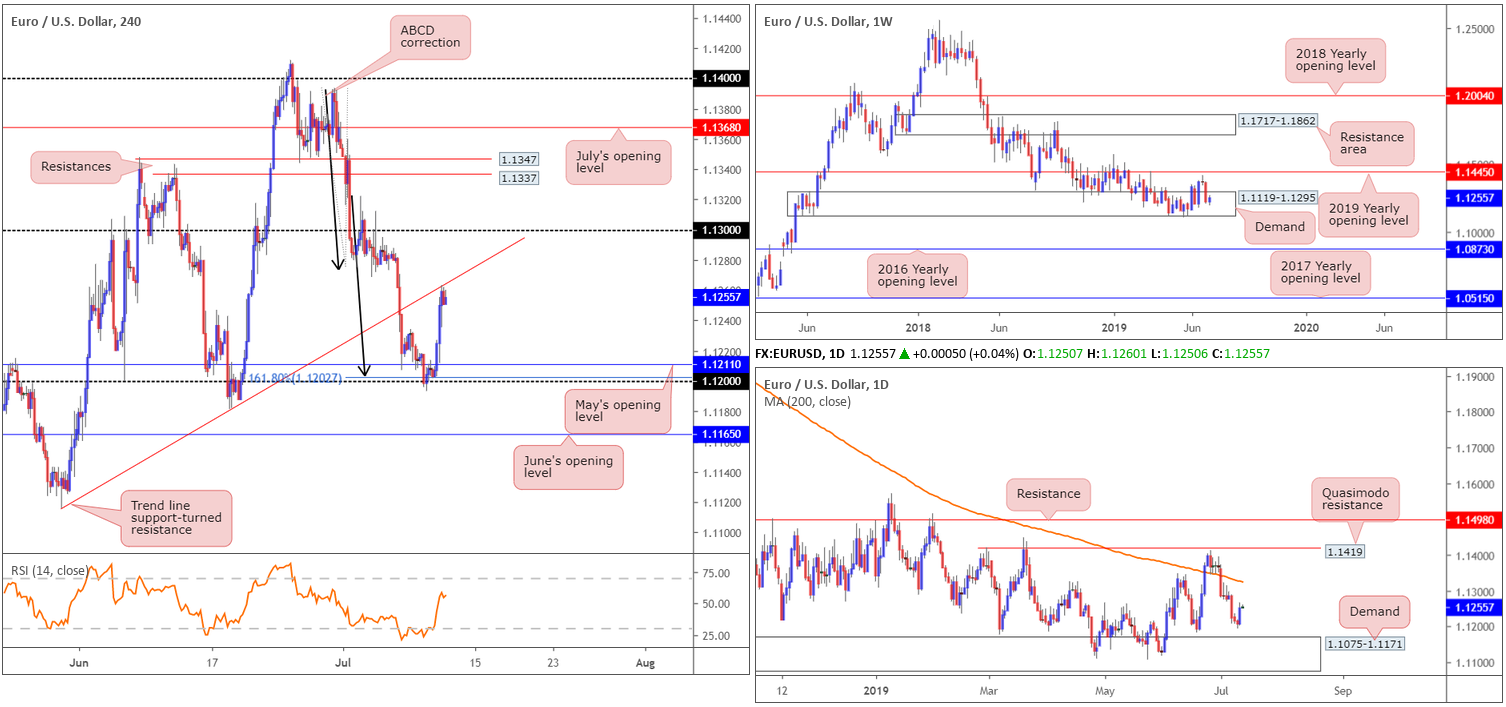
The EUR/USD climbed to a fresh weekly high of 1.1264, breaking a three-day bearish phase and adding 0.38%. For traders who read Wednesday’s briefing you may recall the research team highlighted 1.12 as a potential platform for longs:
The possibility of additional buying out of 1.12 is still present, though not until May’s opening level at 1.1211 is taken out. Traders still interested in 1.12 as support, therefore, are best to wait for a H4 close to form above 1.1211 (preferably along with a successful retest motion) before considering longs, targeting H4 trend line support-turned resistance extended from the low 1.1116. Just to be clear, 1.12 also boasted additional support by way of a 161.8% ABCD (black arrows) correction at 1.1202.
As is evident from the H4 chart this morning, price action overthrew May’s opening level at 1.1211, though fell short on the retest before rotating higher. Well done to any of our readers who managed to jump aboard this move as the unit shook hands with H4 trend line support-turned resistance extended from the low 1.1116 at the close.
With respect to the higher timeframes, buyers and sellers continue to battle for position within a long-standing demand area at 1.1119-1.1295. A break of this zone has the 2016 yearly opening level at 1.0873 (support) in sight, whereas to the upside we have the 2019 yearly opening level at 1.1445.
A closer reading of daily movement shows the pair meandering between notable demand at 1.1075-1.1171, formed on May 17, 2017 (note this area is glued to the underside of weekly demand mentioned above at 1.1119-1.1295), and the 200-day SMA (orange) around 1.1324.
Areas of consideration:
With limited higher-timeframe structure in motion, and the H4 timeframe responding from little more than a trend line support-turned resistance (1.1116), the market offers little in the way of confluence. Granted, a move lower may occur off the current trend line resistance, though a move higher towards the round number 1.13 is just as likely.
In the absence of clearer price action, opting to hit the sidelines is an option today – sometimes the best position is quite simply no position.
GBP/USD:
The British pound witnessed early gains Wednesday as UK GDP data for May surprised to the upside, before extending gains on dollar weakness following Powell’s Semi-Annual Testimony statement shortly after.
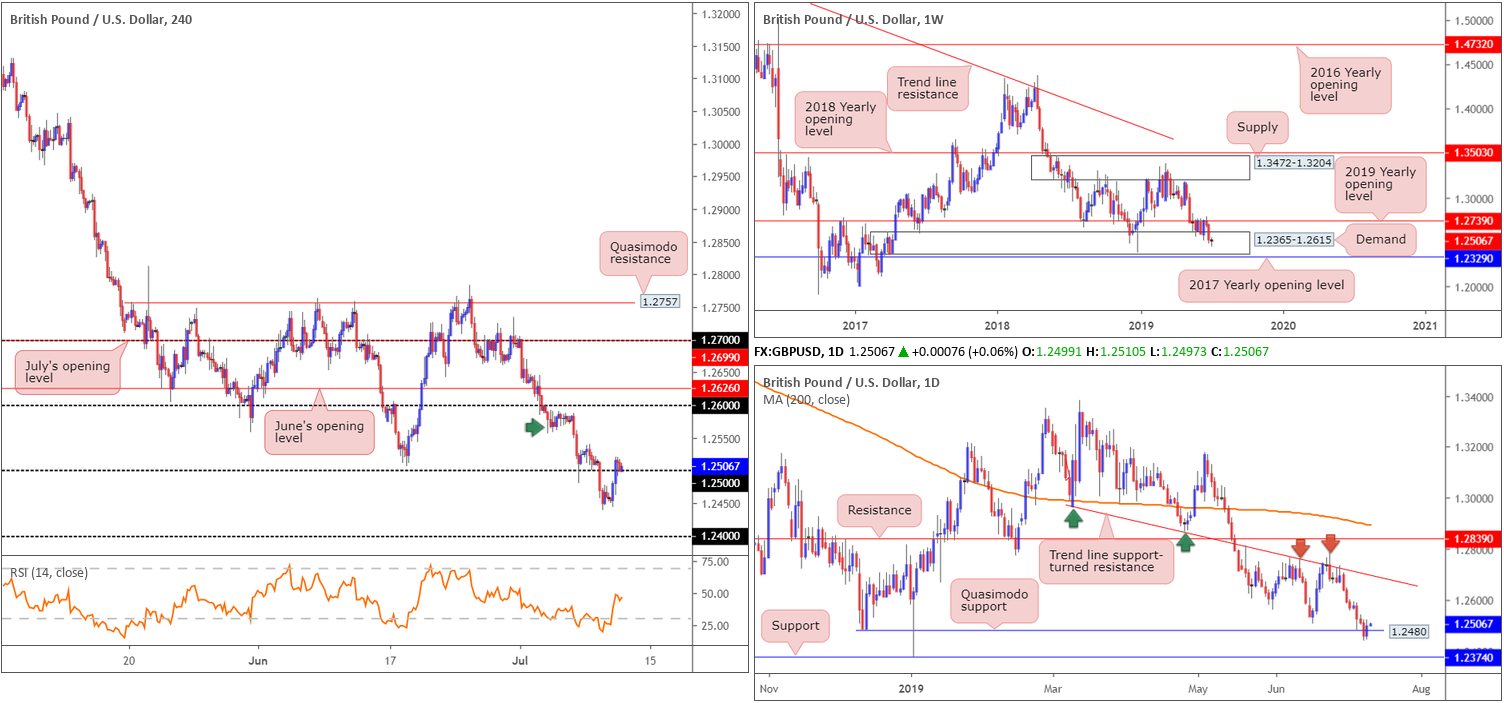
As evident from the H4 timeframe this morning, recent buying dethroned 1.25 to the upside and is, as we write, retesting the figure as support. Further buying from this region has supply (green arrow) in sight at 1.2591-1.2557, closely shadowed by the 1.26 handle and June’s opening level at 1.2626.
Quasimodo support on the daily timeframe at 1.2480 is holding ground for the time being, with the next obvious upside structure positioned at a trend line support-turned resistance extended from the low 1.2960. In the event sellers re-enter the fray, however, support at 1.2374 is likely next in the firing range. From the weekly timeframe, the unit remains within the parapets of long-standing demand at 1.2365-1.2615 after failing to overthrow resistance at 1.2739 by way of the 2019 yearly opening level.
Areas of consideration:
Seeing the daily Quasimodo support positioned just south of 1.25 at 1.2480 holding firm, and 1.25 holding ground for the time being on the H4 timeframe as well as weekly price engaging with demand at 1.2365-1.2615, a move higher could be in store today.
Ultimately, H4 price already produced a satisfactory bullish tail upon retesting 1.25, therefore, according to the overall technical picture, a long with a protective stop-loss order tucked beneath 1.2490 (the bullish candlestick’s lower shadow) could be considered. In regard to take-profit targets, H4 supply (green arrow) mentioned above at 1.2591-1.2557 is an option for an initial take-profit zone.
AUD/USD:
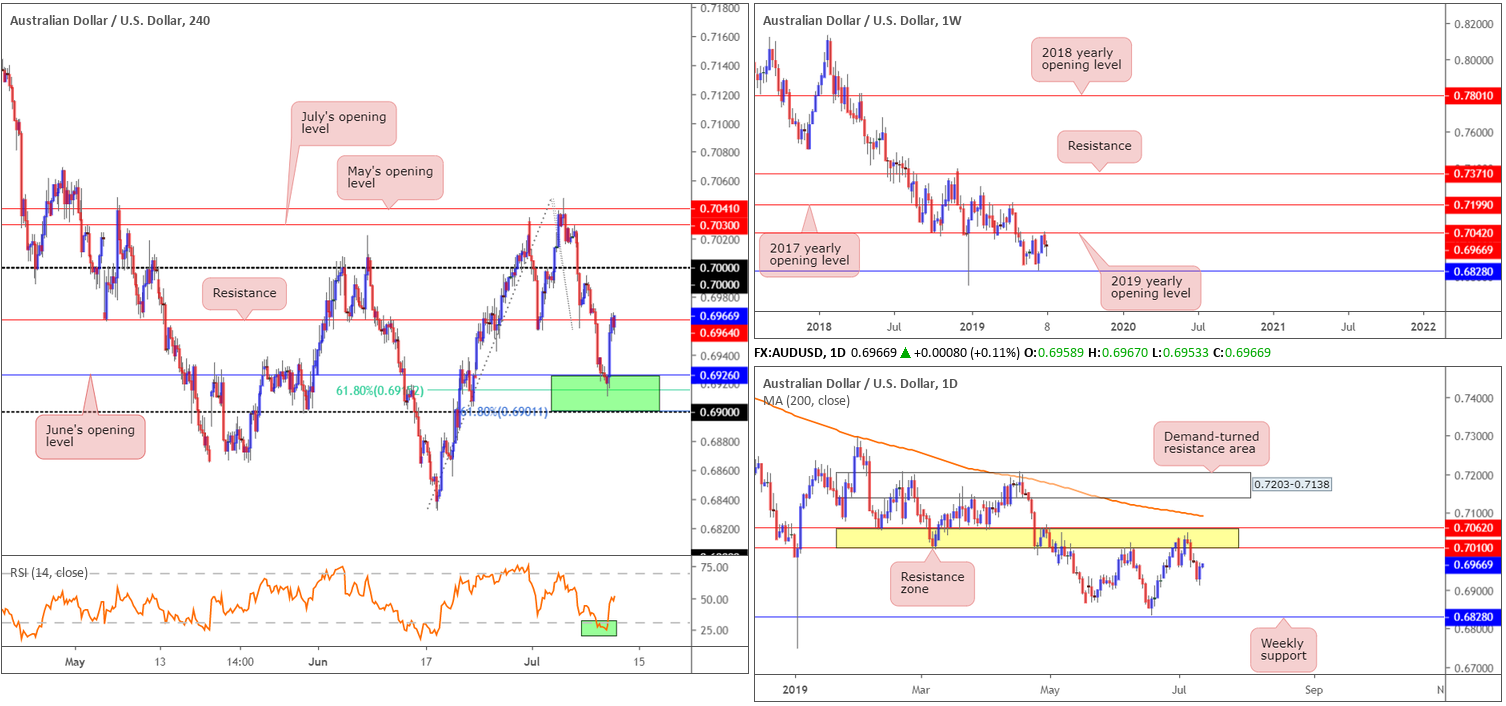
Broad-based USD weakness prompted aggressive short covering Wednesday out of 0.69/0.6926 on the H4 timeframe, hauling the candles towards resistance at 0.6964. The US dollar tumbled lower in response to the ‘dovish’ Semi-Annual Testimony statement from Federal Reserve chief Jerome Powell.
For traders who read Wednesday’s briefing you may recall the following piece:
With June’s opening level currently offering support on the H4 timeframe (0.6926), traders may also wish to acknowledge nearby support lurking at a 61.8% Fibonacci retracement value drawn from 0.6915. In addition to this, we also have the 0.69 handle close by which merges with a 161.8% Fibonacci ext. at 0.6901, as well as the RSI indicator testing oversold terrain.
However, the report also went on to say:
Deciphering how much ‘oomph’ 0.69/0.6926 holds is difficult, knowing both weekly and daily timeframes suggest further selling (see below for the higher-timeframe reading). In situations such as these, the safest route for buyers on the H4 timeframe is to wait and see how H4 action behaves. Should a bullish candlestick form within the said H4 green zone, this could be a sufficient signal for a short-term bounce to H4 resistance at 0.6964, though expecting much more than this is chancy, given higher-timeframe flow.
As you can see from the H4 timeframe this morning, a H4 hammer candlestick formation printed within the said H4 buy zone prior to the unit taking off north. Well done to any of our readers who managed to jump aboard this move.
In light of where the market stands on the higher timeframes, further downside is possible.
From the weekly timeframe, Monday’s weekly report had the following to say:
Breaking a two-week bullish phase, of which involved a strong full-bodied bullish candle, price action tested the 2019 yearly opening level at 0.7042 (resistance) and rotated lower last week. Technically speaking, a response from 0.7042 is not surprising, having seen it serve well as support on a number of occasions in the past. Continued selling from this point has support coming in at 0.6828 in sight.
In conjunction with weekly structure, daily flow also stresses a bearish tone at the moment:
A closer reading of price action on the daily timeframe reveals two layers of resistance at 0.7062/0.7010, collectively forming a robust resistance zone (yellow). Assuming sellers remain in the driving seat, the next downside target on the daily timeframe can also be seen around the weekly support mentioned above at 0.6828.
Areas of consideration:
Aside from the bounce out of the H4 support area at 0.69/0.6926, the research team feels upside will likely be limited going forward, with 0.70 set as the extreme. In the event 0.70 re-enters the fight, a sell from here could also be an option, given it is positioned just south (10 points) of the daily resistance area at 0.7062-0.7010.
Like all round numbers, though, fakeouts are common viewing. For that reason, waiting for additional confirmation to form before pulling the trigger is an idea. This could be anything from a bearish candlestick pattern, an MA crossover or even drilling down to the lower timeframes and attempting to enter based on local structure.
USD/JPY:
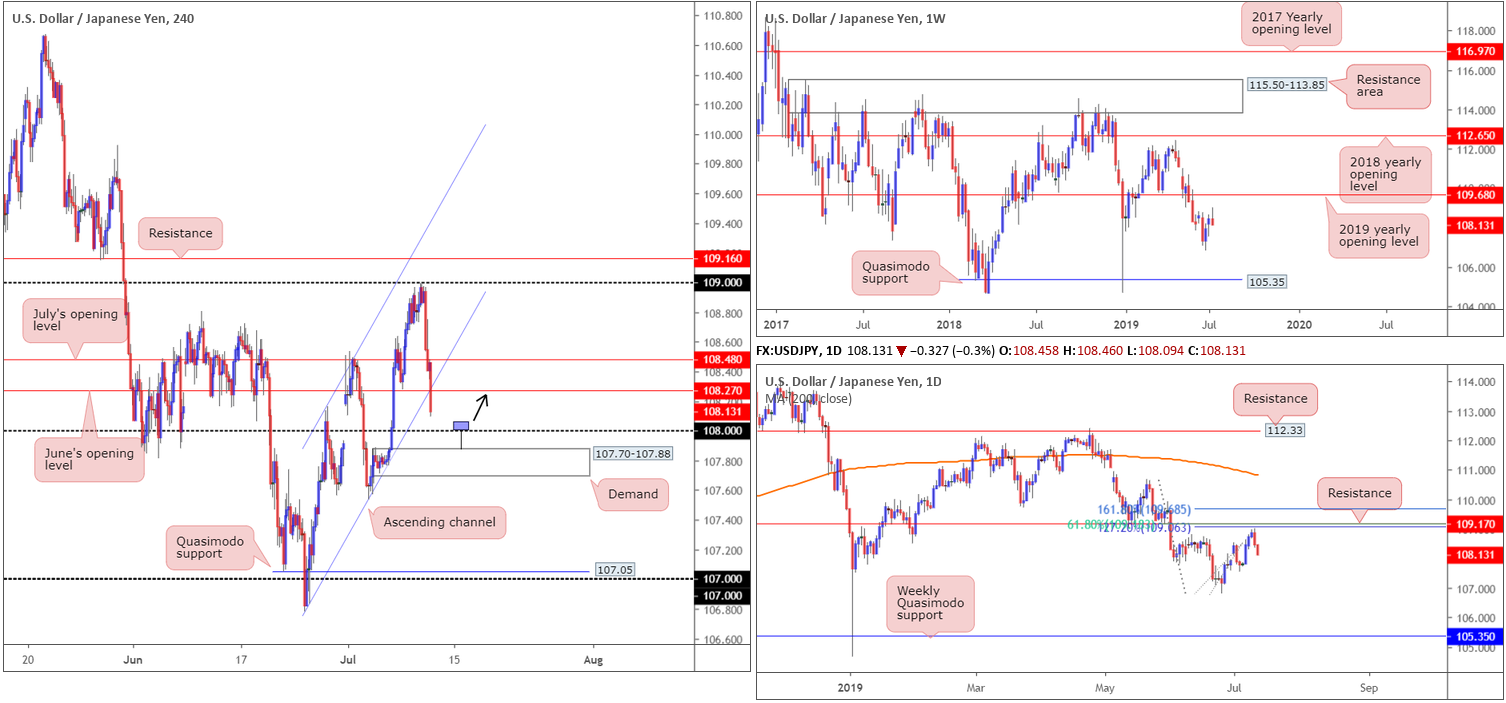
Leaving 109 on the H4 timeframe unchallenged, the USD/JPY fell sharply in response to the ‘dovish’ Semi-Annual Testimony statement from Federal Reserve chief Jerome Powell. In addition to this, as we head into Asia Pac hours, further selling is being seen which engulfed channel support extended from the low 106.78 and exposed 108 as the next viable ‘floor’ on this timeframe, closely followed by demand at 107.70-107.88.
It was unfortunate 109 never entered the mix as Wednesday’s briefing highlighted the 109.16/109 region as a possible sell zone (aligned closely with resistance at 109.16 and a nearby channel resistance taken from the high 108.13). Also supporting the H4 sell zone was daily structure at 109.68/109.06 (comprised of resistance around 109.17, an ABCD bearish pattern [black arrows] at 109.30, the 127.2% Fibonacci ext. at 109.06 and a 61.8% Fibonacci retracement value at 109.18).
Areas of consideration:
Having seen the H4 candles park just north of 108 this morning, and taking into account a fresh H4 demand is positioned just beneath the level at 107.70-107.88, this has ‘fakeout’ written all over it. In other words, a possible run through sell stops beneath 108 to the said demand could take shape before pushing higher. An ideal scenario would be for the H4 candles to chalk up a hammer formation that pierces through 108 and taps the top edge of the current demand (see H4 chart for a visual representation). This, by and of itself, is a reasonably strong buy signal, targeting June’s opening level at 108.27.
USD/CAD:
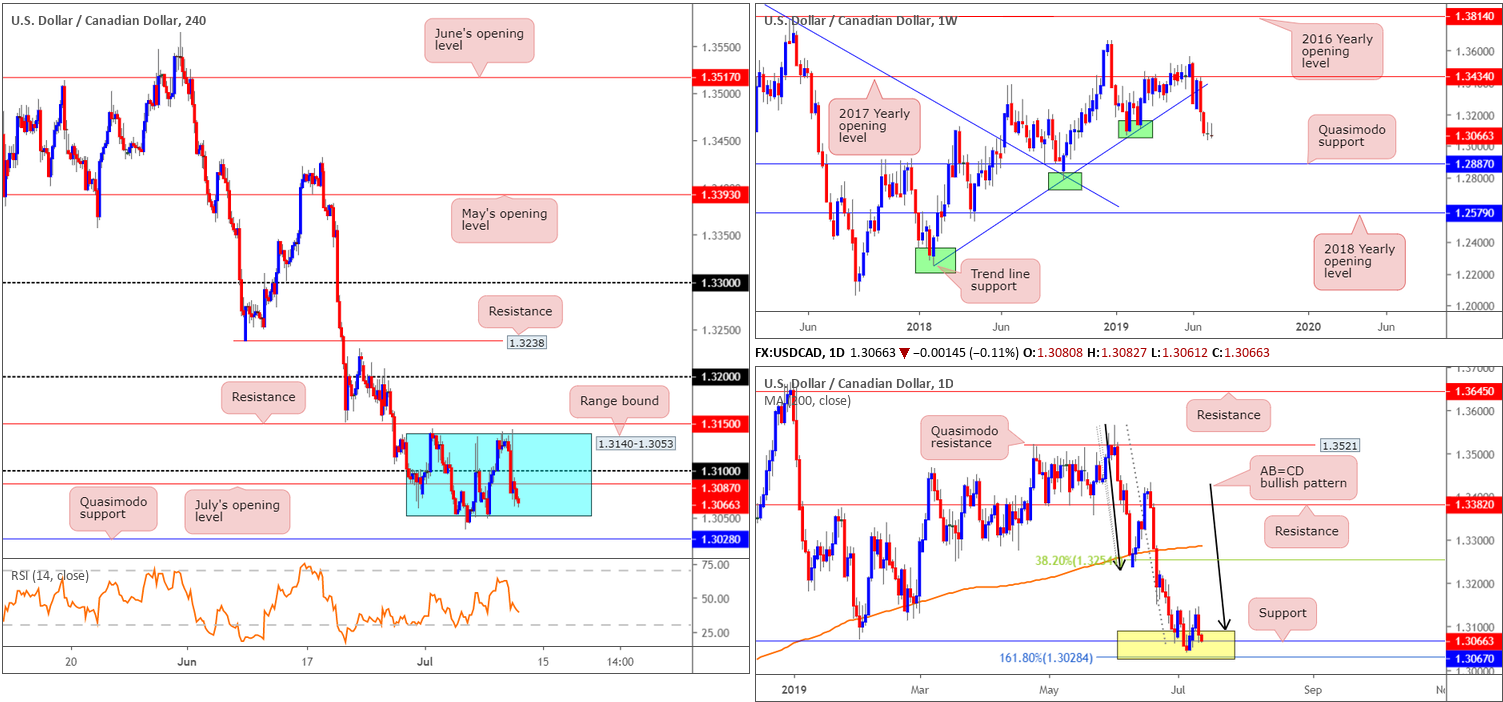
Since the beginning of the month, the H4 candles have been busy carving out a consolidation zone between 1.3140-1.3053, which incorporates the 1.31 handle and also July’s opening level at 1.3087. Thanks to Powell’s dovish testimony yesterday, the USD/CAD is seen trading nearer the lower edge of this range this morning. It might also be worth noting the Quasimodo support at 1.3028, in the event we push lower today.
Higher-timeframe analysis on the weekly timeframe shows further selling is potentially on the cards. limited support is evident until reaching as far south as a Quasimodo formation at 1.2887. Daily action, on the other hand, remains trading within the walls of a support area coming in at 1.3028/1.3089 (yellow). Comprised of an AB=CD (black arrows) formation at 1.3089, a support at 1.3067 and a 161.8% Fibonacci extension at 1.3028 (forms part of the AB=CD structure), this zone has held price action higher since late June. It’s essentially bolstering the lower edge of the noted H4 range.
Areas of consideration:
In essence, weekly price suggests lower levels could be seen, while daily structure emphasises support. This – coupled with H4 price ranging at the moment – makes for a difficult market to trade.
Something that may be worth keeping an eye on, however, is the H4 Quasimodo support at 1.3028 since it aligns perfectly with the daily 161.8% Fibonacci ext. point. A run to this H4 level could trigger sell stops beneath the current H4 range and drive higher. Waiting for a H4 bullish candlestick pattern to form (entry and risk can be determined according to this structure) prior to pulling the trigger may be worth considering, given weekly price.
USD/CHF:
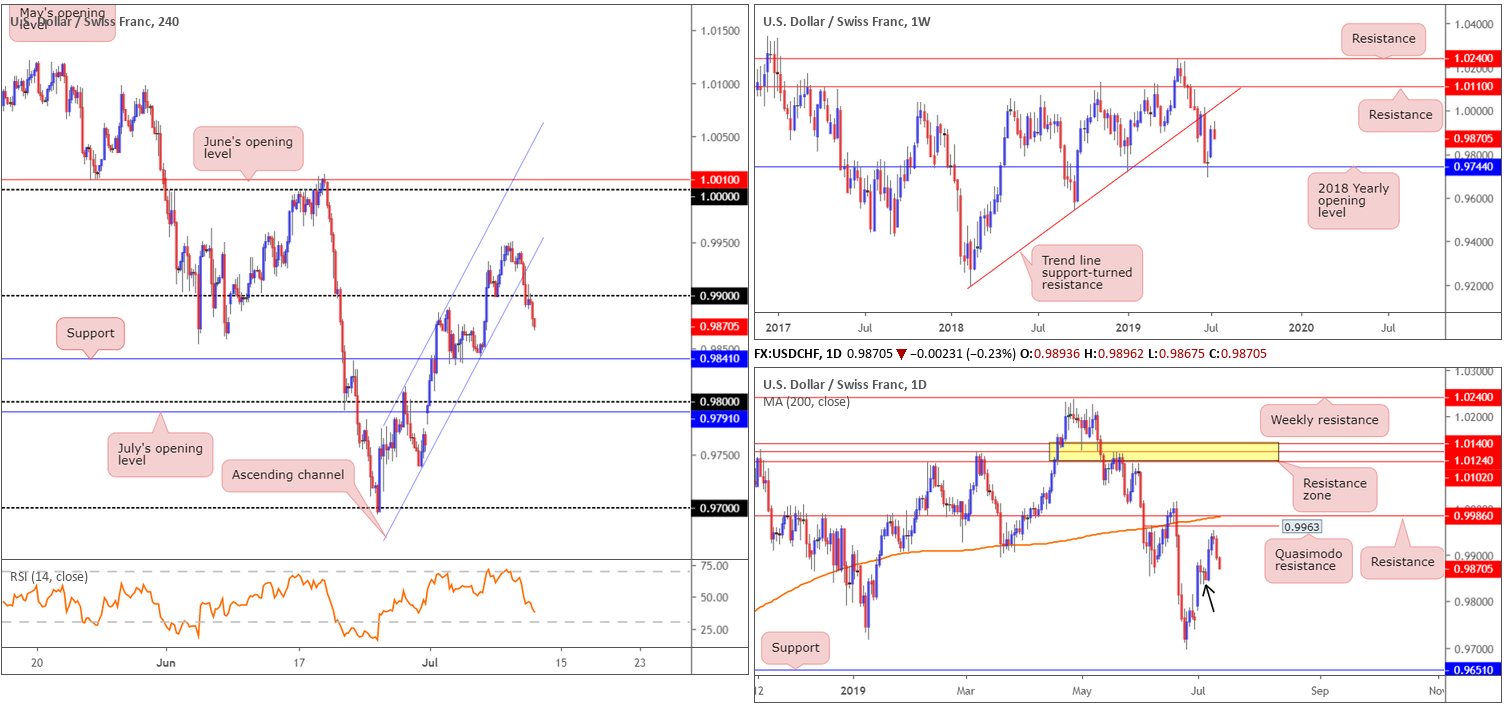
Triggered by a sharp decline of the US dollar following dovish comments from Fed’s Chief Powell, the USD/CHF engulfed H4 channel support (taken from the low 0.9738), and reclaimed 0.99 to the downside. Further selling has been seen this morning, consequently drawing the H4 candles closer to support at 0.9841. Beyond the said support, we have 0.98 in view, closely trailed by July’s opening level at 0.9791.
The higher timeframes are not offering much in terms of structure this morning. Daily price, however, is seen nearing a demand zone (black arrow) at 0.9835-0.9876, though may give way considering the area produced little to the upside from its base. In other words, the daily demand broke little structure to the left of price.
Weekly price, as you can see, turned lower ahead of trend line support-turned resistance extended from the low 0.9187.
Areas of consideration:
H4 support at 0.9841, seeing how well it served as support in the past, could hold price action higher today if tested. Note this level is situated within the lower limits of the daily demand area highlighted above at .9835-0.9876. Trading 0.9841 without additional confirmation is a chancy move. The possibility of the level giving way and heading to 0.98 is certainly present. Therefore, trading long from 0.9841 is best with additional confirmation, such as a hammer formation, for example. Not only will this serve to identify buyer intent, it’ll also help provide entry and risk levels to work with, targeting 0.99 as the initial upside take-profit base.
Dow Jones Industrial Average:
US equities concluded higher Wednesday as investors welcomed fresh signals suggesting the Federal Reserve is ready to cut interest rates for the first time in a decade. Powell’s Semi-Annual Testimony statement was interpreted as dovish – doing little to lean back on the notion the central bank will be cutting rates at the July meeting – consequently setting a clear risk-on tone in the markets. The Dow Jones Industrial Average added 0.29%, while the S&P 500 added 0.45% alongside the tech-heavy Nasdaq 100 rallying 0.98%.
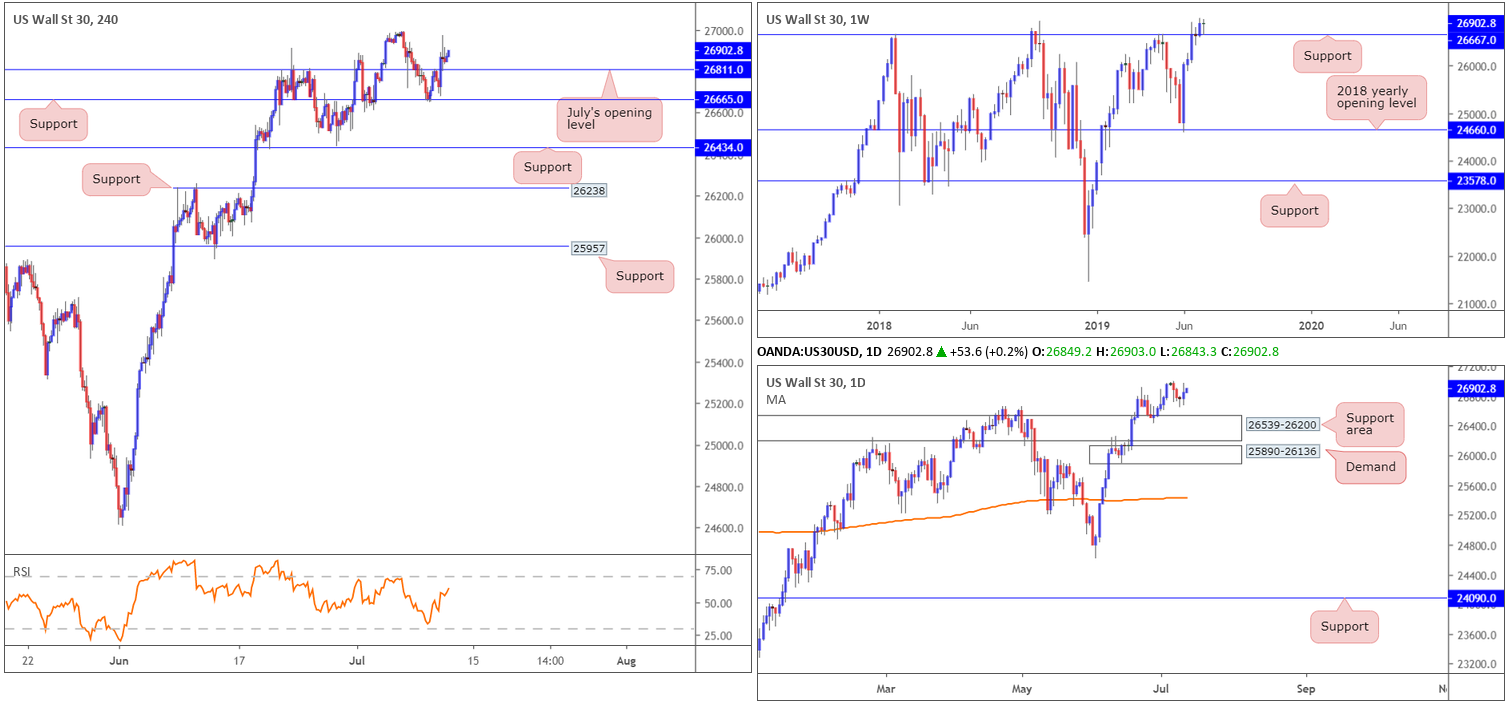
From a technical standpoint, weekly flow remains buoyed by support at 26667. Continued buying from this angle could witness the index approach fresh all-time highs this week. Supporting the current weekly support is daily price recently chalking up a hammer candlestick formation and following through with additional buying. The concern on this timeframe, however, remains with price action showing room to press lower towards a support area at 26539-26200.
Examining the market’s action on the H4 timeframe, we can see the unit rebounded from support at 26665 Tuesday, and engulfed July’s opening level at 26811 Wednesday. As is evident from H4 movement, 26811 was also retested as support. With little now seen in the way of an attempt at fresh record highs, it is likely the index may push for fresh highs today, using 26811 as the platform.
Areas of consideration:
With the index strongly entrenched within an uptrend at present, buying this market off 26811 on the H4 timeframe is certainly a possibility, targeting fresh record highs. Ultimately, it’d be good to observe another retest of 26811 to enter long from, only this time print more of a notable bullish candlestick signal (entry and risk can then be determined according to this structure).
XAU/USD (GOLD):
Following Fed Chairman Powell’s dovish testimony Wednesday, the US dollar fell sharply and provided fresh impetus to gold.
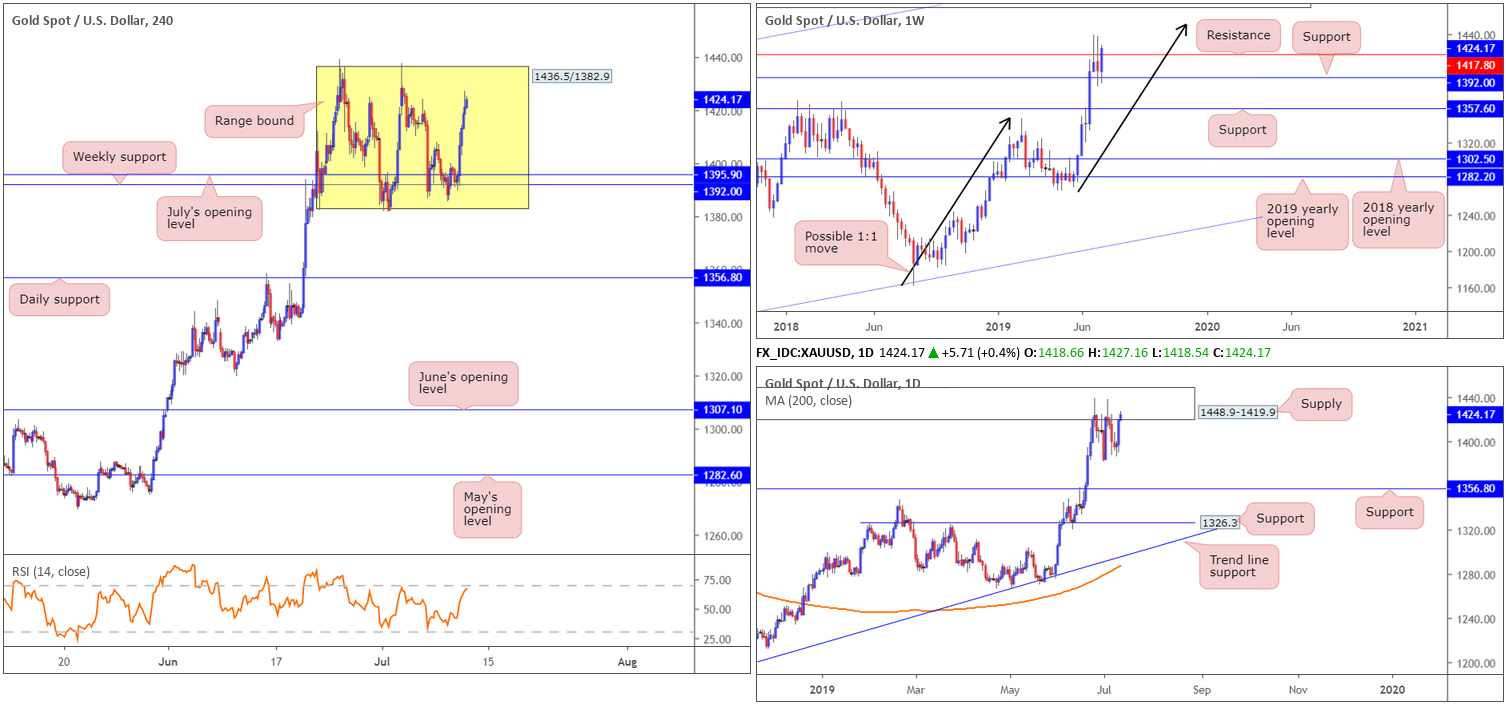
As can be seen from the H4 timeframe this morning, the price of gold rallied from the lower edge of its range between 1436.5/1382.9, bolstered by weekly support at 1392.0 and July’s opening level on the H4 timeframe at 1395.9. The move higher has yet to shake hands with the upper edge of the H4 range, though did cross above weekly resistance at 1417.8. According to the weekly timeframe, this exposes potential resistance in the form of a 1:1 correction (black arrows) at 1452.1. Contrary to this, however, daily movement reconnected with the underside of supply at 1448.9-1419.9. Note this area also happens to be positioned just above the said weekly resistance at 1417.8.
Areas of consideration:
Sellers may make an appearance around the top edge of the H4 range today (1436.5), with additional resistance coming in by way of daily supply at 1448.9-1419.9. The drawback to selling this, aside from the strong uptrend in play at the moment, is weekly price establishing ground above weekly resistance at 1417.8.
On account of the above, selling the upper limit of H4 range is chancy, though if supported with additional bearish candlestick confirmation (entry and risk can be set according to this structure), this may be sufficient to attract sellers into the market and at least retest July’s opening level at 1395.9.
A breakout above the H4 range, on the other hand, is considered a bullish indicator, suggesting we may be heading for the 1:1 correction point on the weekly timeframe at 1452.1. While this does not leave much room to trade long, shorter-term intraday trades could still be an option here.
The accuracy, completeness and timeliness of the information contained on this site cannot be guaranteed. IC Markets does not warranty, guarantee or make any representations, or assume any liability with regard to financial results based on the use of the information in the site.
News, views, opinions, recommendations and other information obtained from sources outside of www.icmarkets.com.au, used in this site are believed to be reliable, but we cannot guarantee their accuracy or completeness. All such information is subject to change at any time without notice. IC Markets assumes no responsibility for the content of any linked site.
The fact that such links may exist does not indicate approval or endorsement of any material contained on any linked site. IC Markets is not liable for any harm caused by the transmission, through accessing the services or information on this site, of a computer virus, or other computer code or programming device that might be used to access, delete, damage, disable, disrupt or otherwise impede in any manner, the operation of the site or of any user’s software, hardware, data or property.


