
EUR/USD:
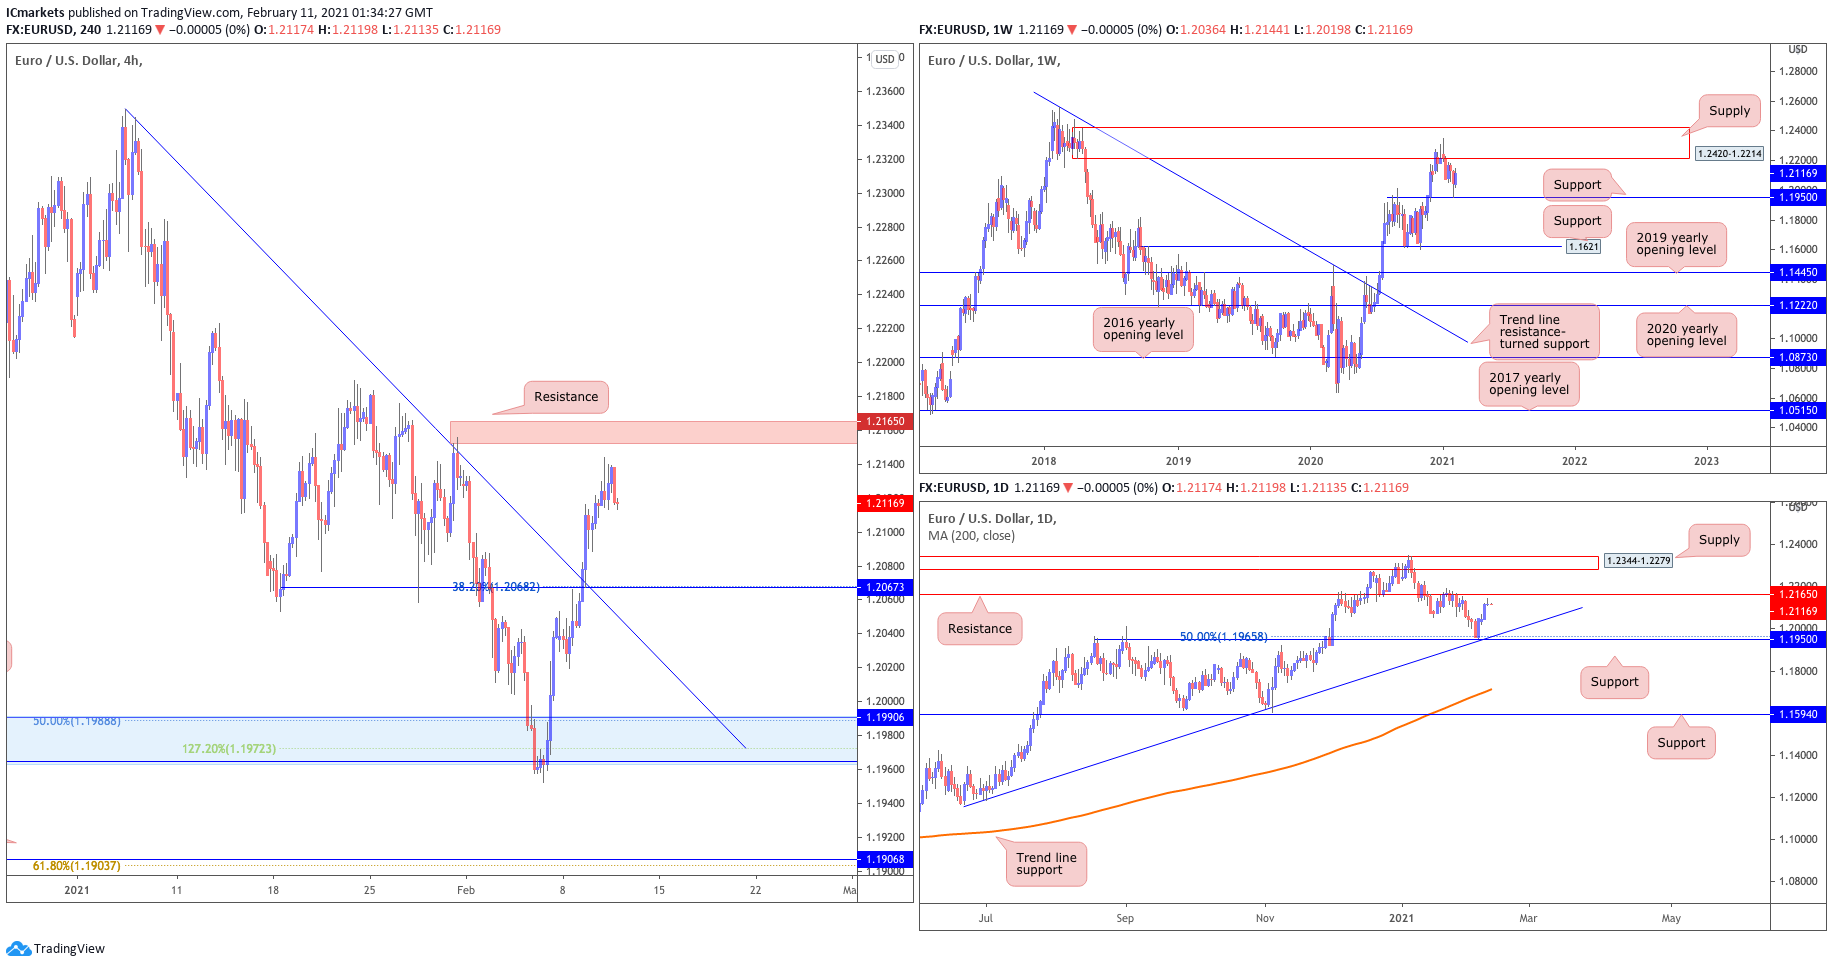
Looking at the weekly chart, we can see that prices are still in an uptrend and are holding above the key support level at 1.19500 which can be found on the weekly and daily time frame. This level also coincides with our 50% fibonacci retracement and ascending trend line on the daily time frame. That said, we do caution the limited upside, with prices approaching our daily resistance level at 1.21650.
On the H4 timeframe, prices are facing downside pressure from our resistance level at 1.21650 which is also a graphical resistance area. This would be an interesting level for sellers and recent price action around that area suggests it is a strong area of supply flowing, where we could see a further push down to our support area at 1.20673.
Areas of consideration:
- 20673 support area found on H4 time frame
- 21650 resistance level found on H4 and daily frame frame
GBP/USD:
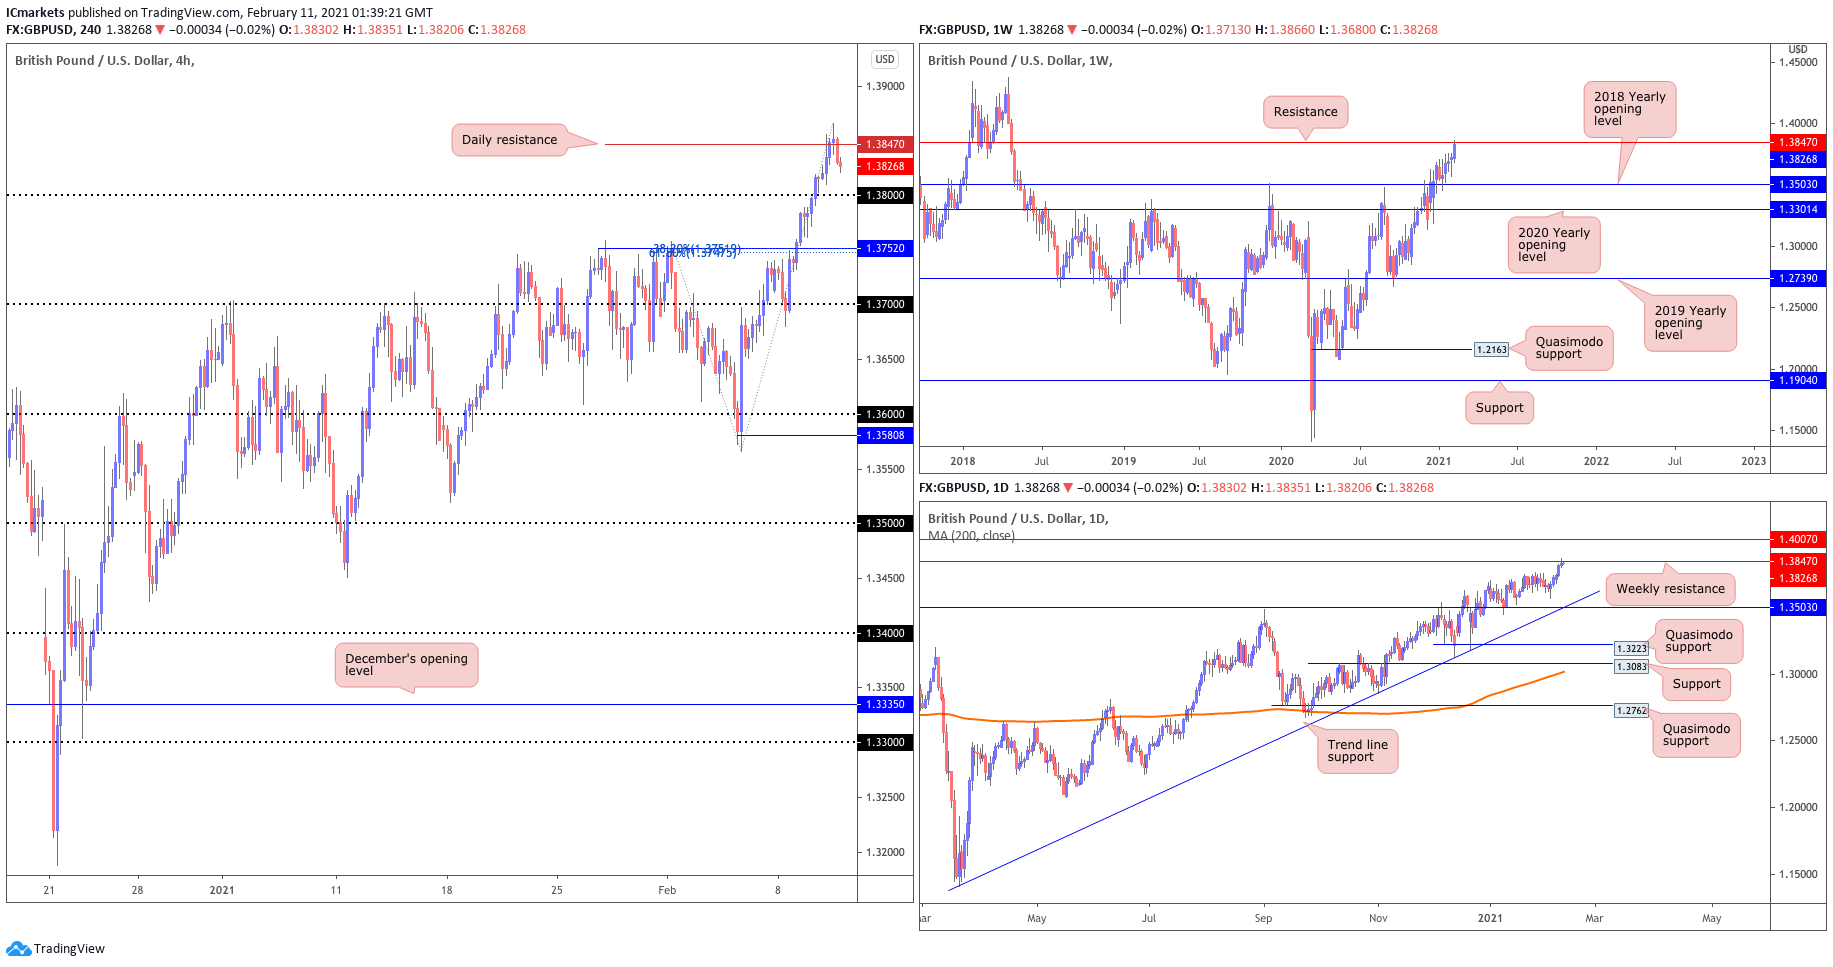
Looking at the weekly chart, we can see that prices are trading between our weekly support at 1.35030 and weekly resistance at 1.38470. On the daily time frame, prices are approaching resistance at 1.38470 and we are seeing limited downside before prices reach our weekly and daily support at 1.35030, in line with our daily ascending trend line.
On the H4 timeframe, we are seeing limited downside in prices, with prices testing our short term resistance at the 1.38470, which can also be found on the daily and weekly time frame. This level coincides with the graphical resistance area on the weekly time frame. This would be an interesting level for sellers and recent price action around that area suggests it is a strong area of supply flowing in where we could see a potential reversal below this level. We could see a potential reversal in price to our 1.37520 support area on H4 timeframe, in line with our 38.2% fibonacci retracement and 61.8% fibonacci extension.
Areas of consideration:
- 38470 resistance area resistance area found on H4 and Daily timeframe
- 37520 support area on H4 timeframe
AUD/USD:
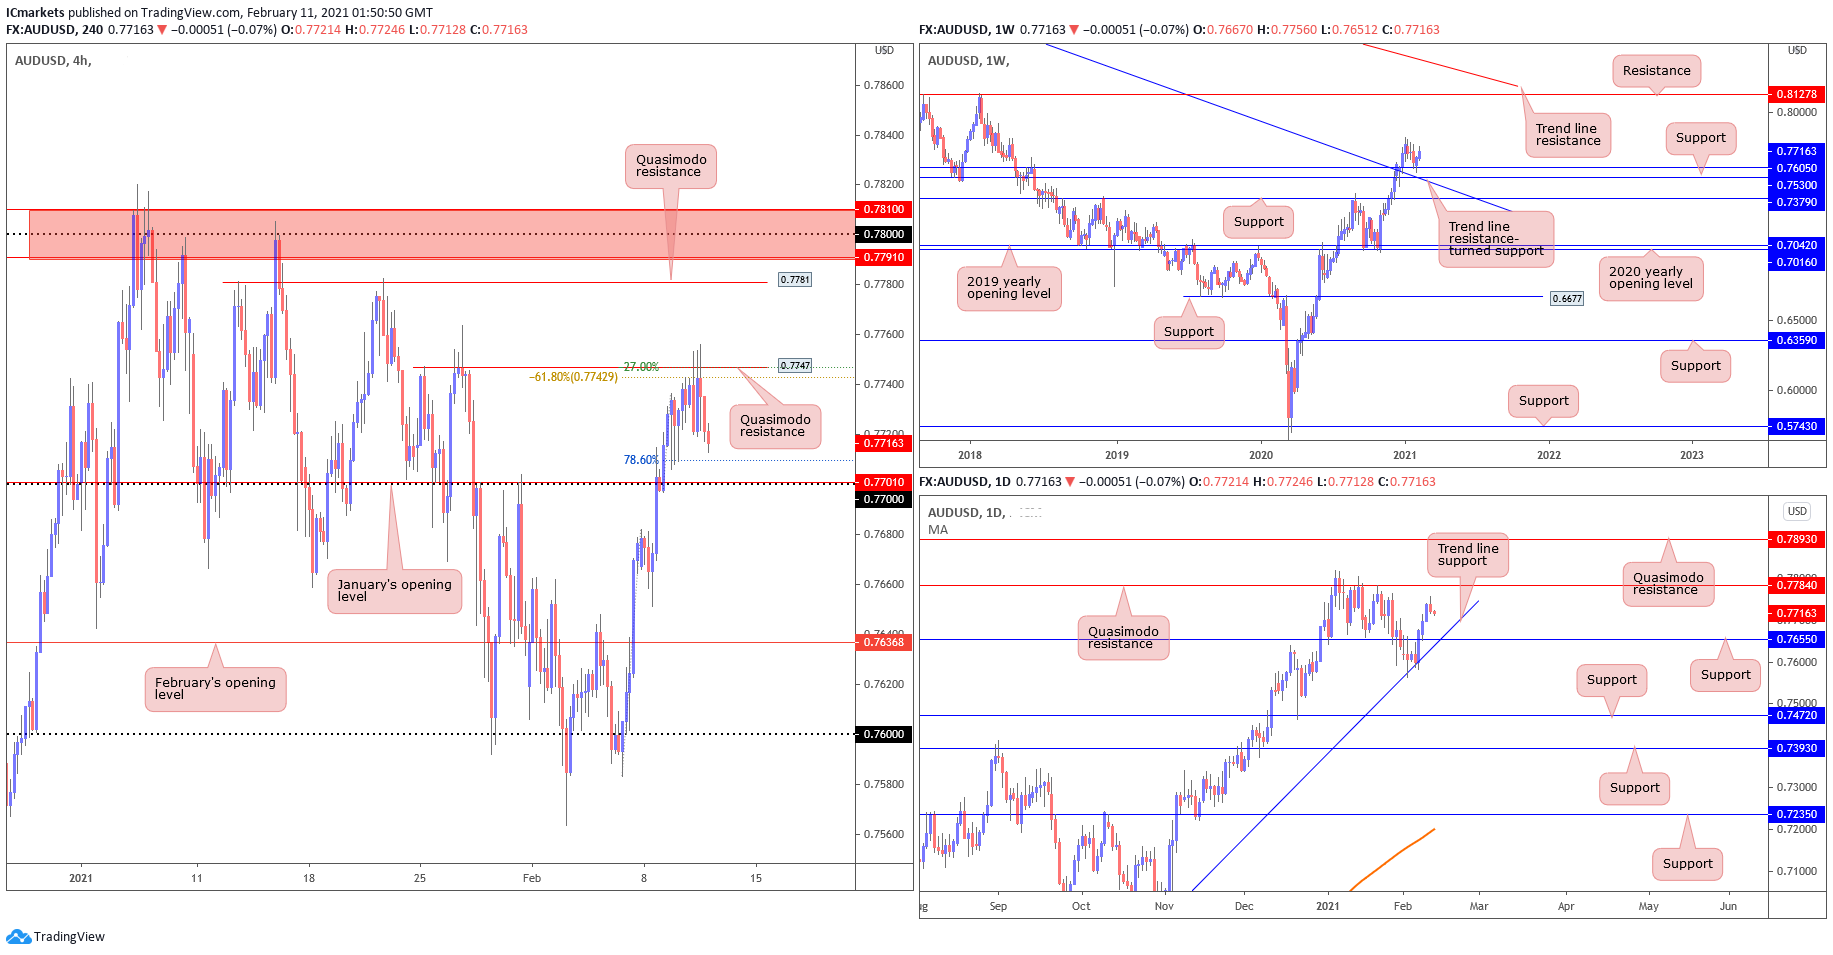
From the weekly timeframe, price continued its move up North above the Trendline resistance-turned support taken from the high 1.1080, as well as above the support level of 0.7605, a previous Quasimodo resistance. This bullish momentum has been established since March (2020).
On the Daily, price have moved away from the Trend line support, approaching the previous high at 0.7784 as well as a previous Quasimodo resistance. And the view on H4, sellers have pushed price away from the previous Quasimodo resistance at 0.7747 and -61.8% retracement that has been tapped on. Price has since then made a significant pull back. On H4, we could see price approaching the 78.6% retracement level at 0.7708, a bounce up north from here towards the next Quasimodo resistance at 0.7781 may be possible.
Areas of consideration:
- H4 approaching 78.6% retracement level of support
- Daily and Weekly still showing bullish momentum.
USD/JPY
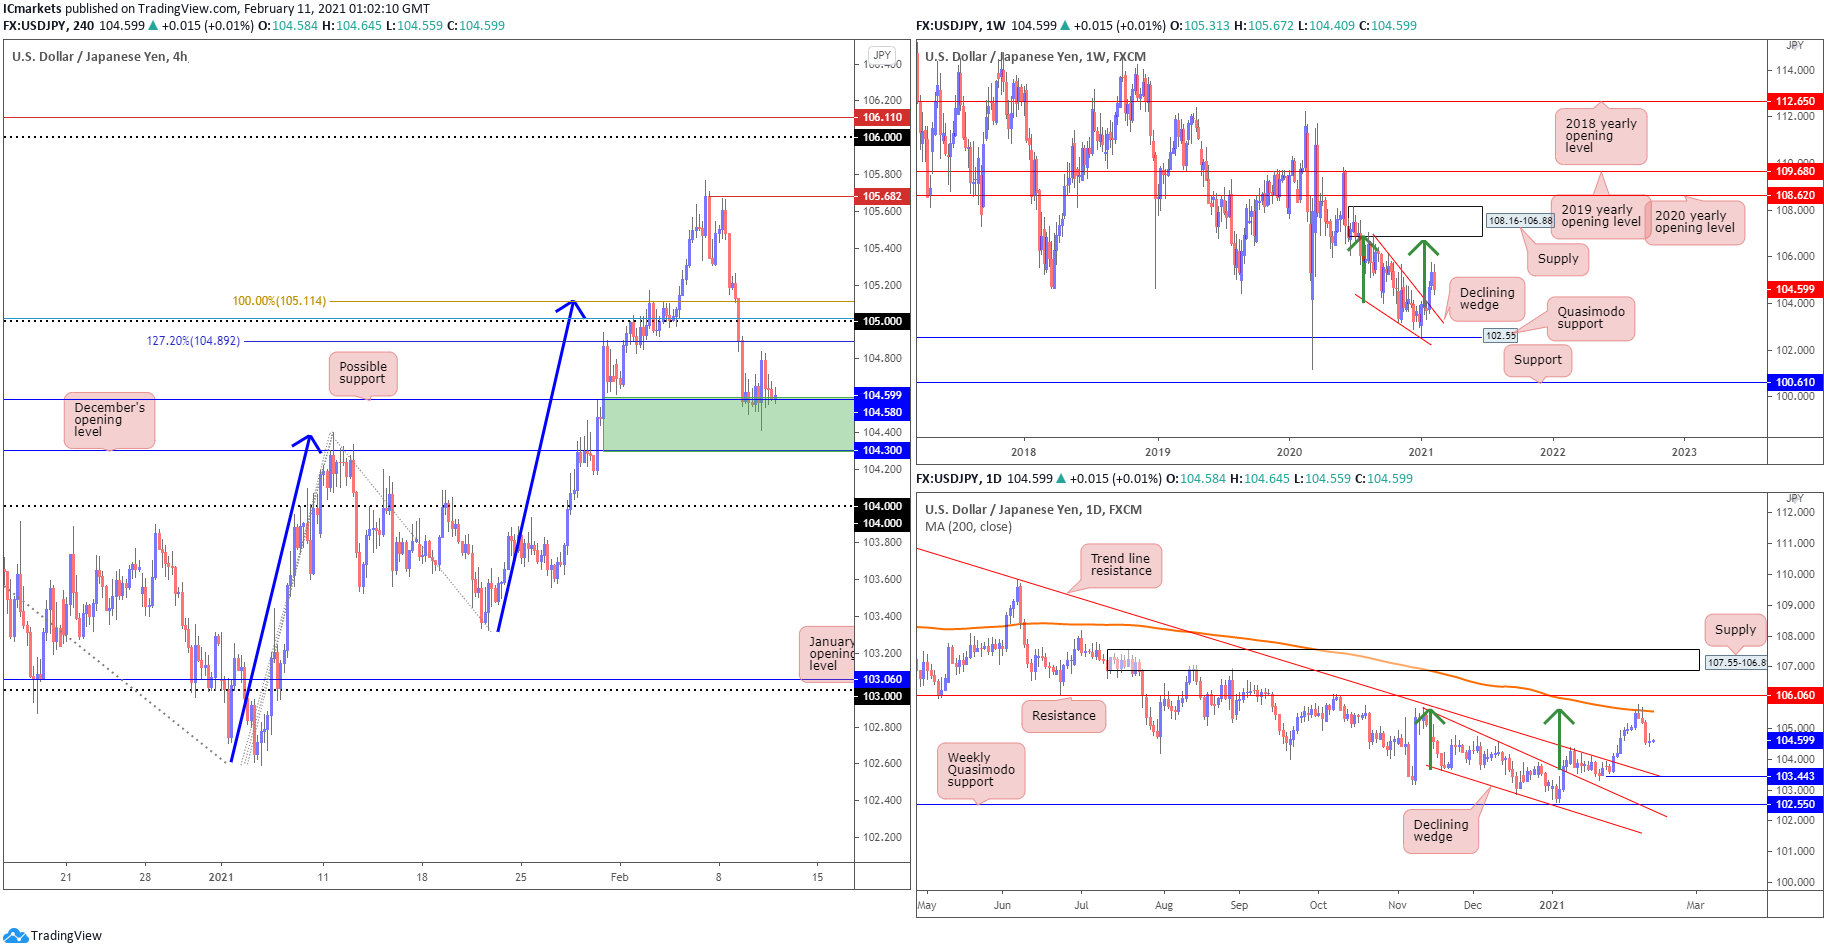
The US dollar reversed on Wednesday further after breaking the support at 104.89 , with H4 retesting 104.58 support where the horizontal overlap is . We could see sellers step in further if price breaks below 104.58.
Against the backdrop of the H4 timeframe, price is pulling back after recent breakout above the weekly declining wedge (106.94/104.18). On the daily chart, price dropped after tapping the MA200 and is pulling back to the declining wedge where it previously broke out. The daily timeframes displaying room to reach 103.443 underpins the possibility of further selling materialising south of 104.58(H4). However, before that on the H4 chart, we couldn’t ignore the support at 104.58 where the horizontal pullback support is.
Areas of consideration:
- 44 resistance on the Daily timeframe
- 58 support on H4 timeframe, in line with horizontal overlap support
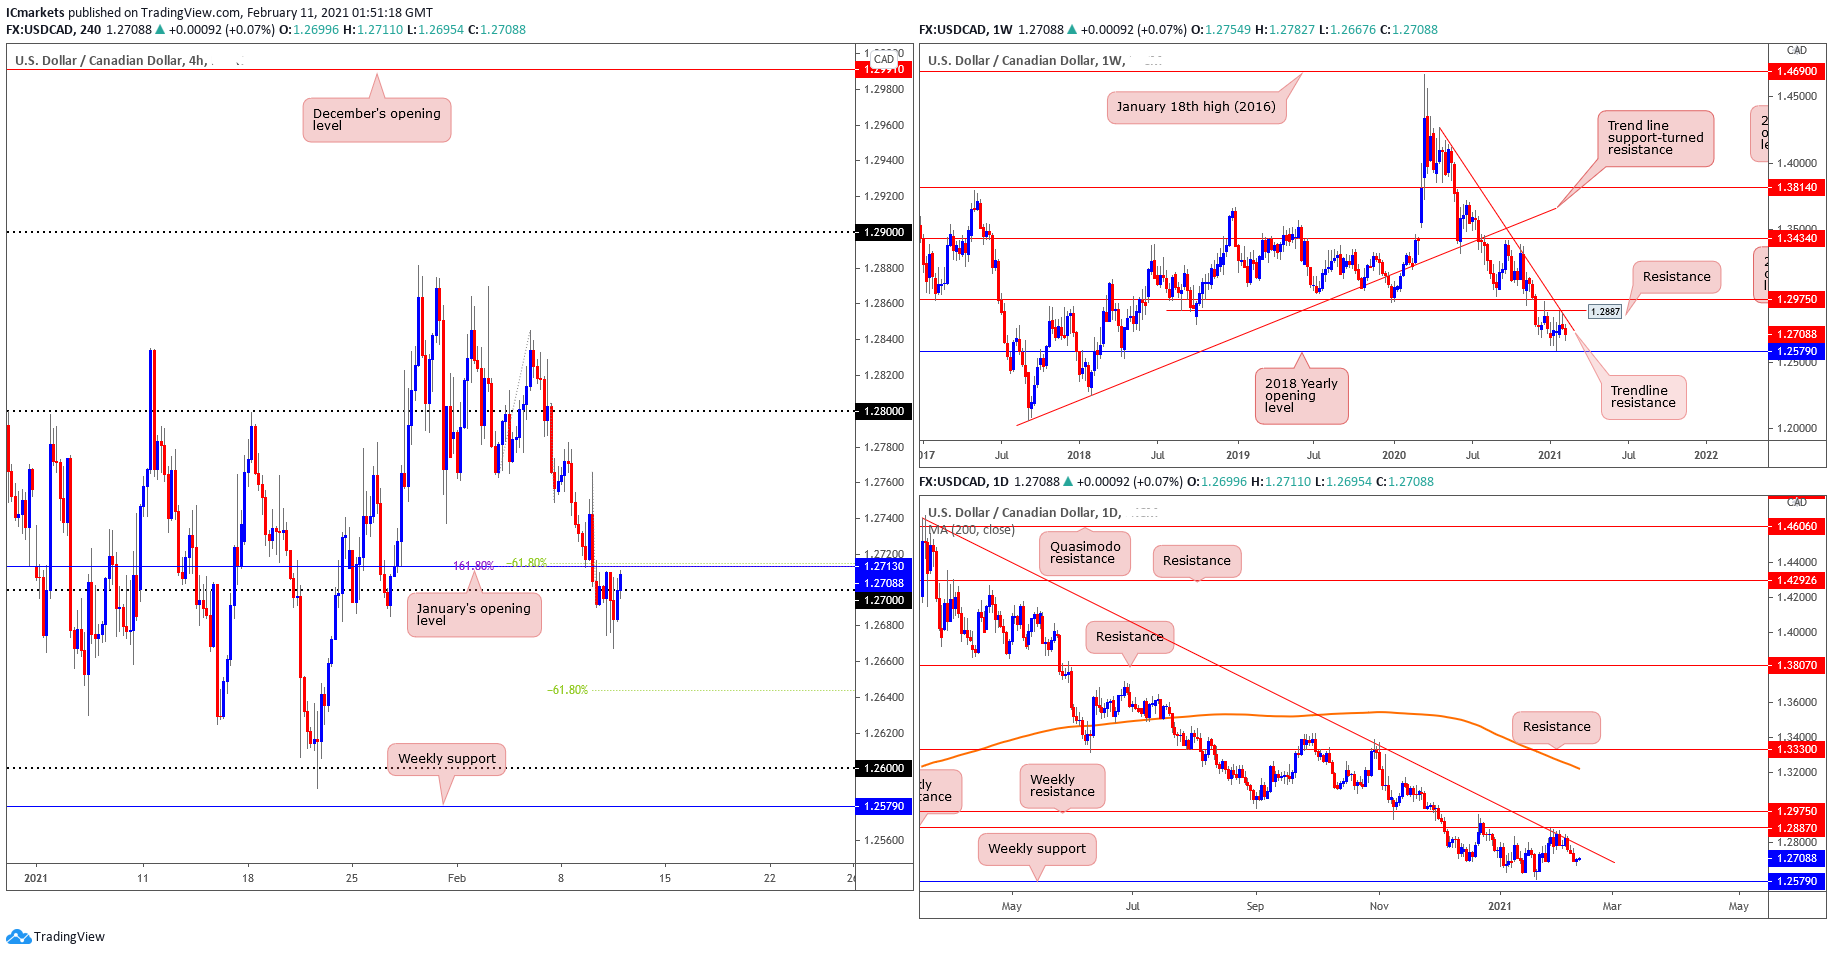
USD/CAD:
Looking at the weekly chart, price have respected the descending trendline drawn from 13 April (2020) high, which is also the 1.2887 resistance level (a previous Quasimodo support level). It is important to note that the long-term picture has pointed the direction down (trend) since March (2020). On the daily time frame, price has been making a sideway consolidation between the Weekly resistance level at 1.2887 and Weekly support level at 1.2579. However, price has recently reversed from the descending trendline drawn from 18 March (2020) high, and is showing more bearish pressure.
H4 has broken pass January opening level at 1.2713, in line with 161.8% and -61.8% fibonacci retracement, and even shown retest of the area before returning back into the major level of 1.27 and our last call of 1.2713, a bearish breakout from the major level may be a potential port of call towards the next -61.8% retracement level near 1.264.
Areas of consideration:
- On H4, Support-turned resistance at 1.2713 where January opening, 161.8% retracement and -61.8% retracement are in confluence.
- Next support level on H4 at -61.8% near 1.264 level.
- Weekly and Daily analysis shows bearish pressure.
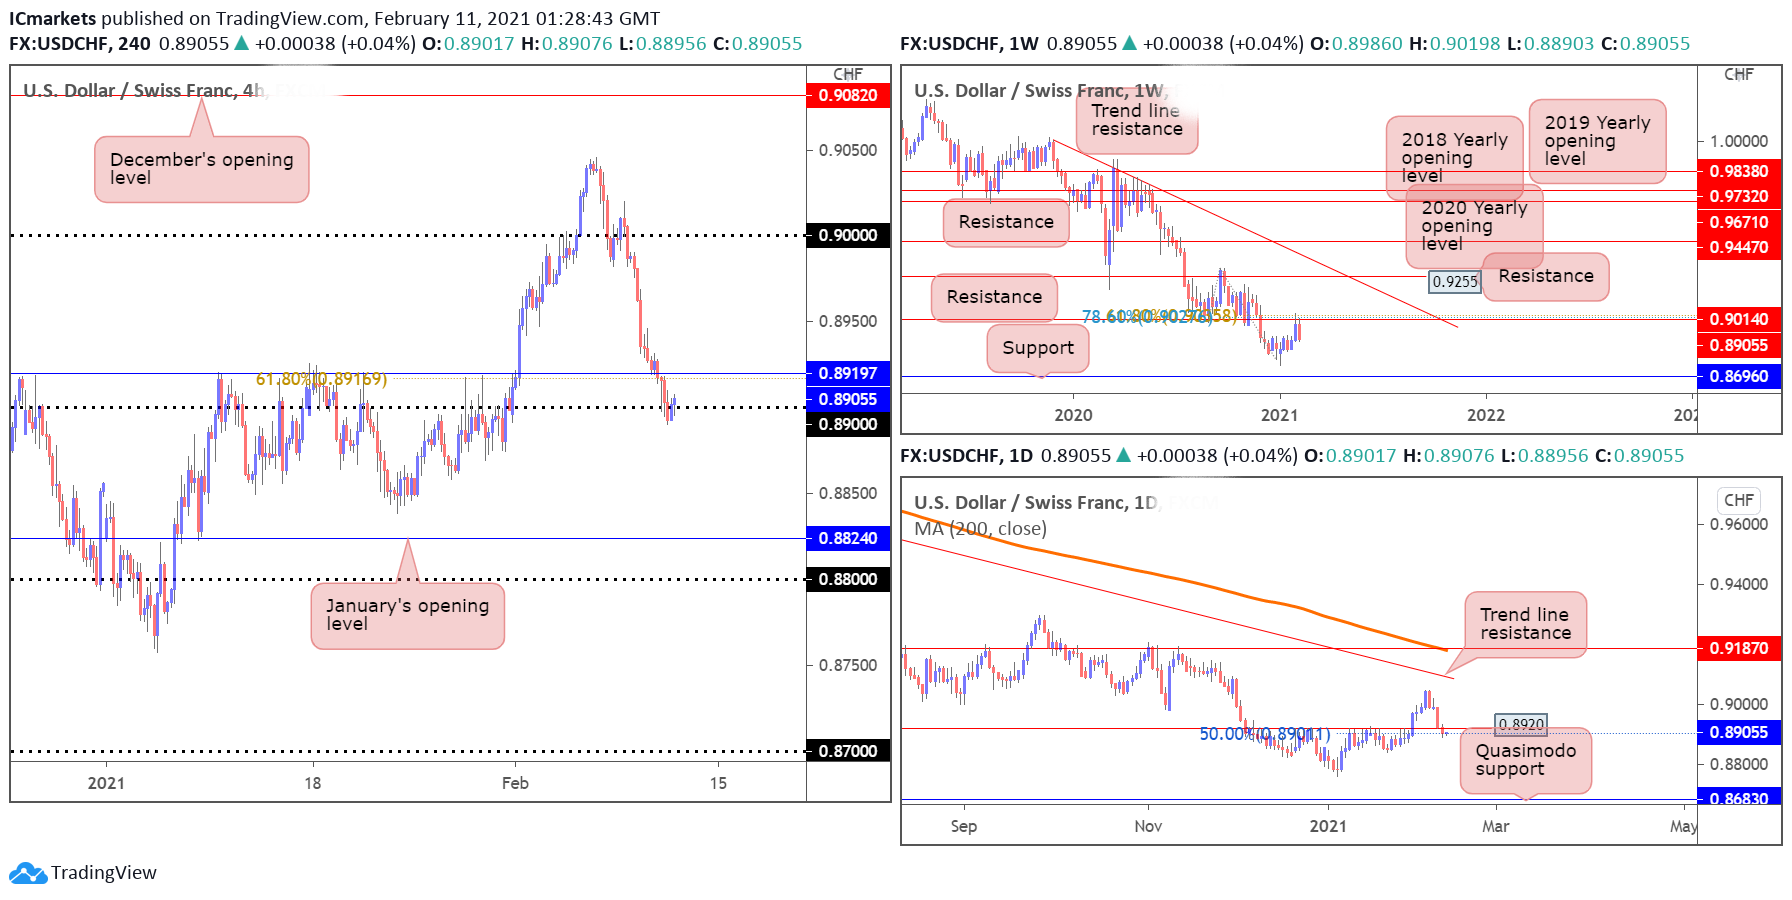
USD/CHF:
The weekly timeframe shows that USD/CHF is indeed facing major resistance at the 0.90140 level which is an area of Fibonacci confluence, in line with both the 61.8% Fibonacci retracement and 78.6% Fibonacci extension, thus establishing it as a strong resistance level that price is unable to break above. We expect a further push down from this level towards our support level at the 0.86960 level as price continues to face bearish pressure.
On the daily timeframe, price is testing the 0.8920 level which is in line with our 50% Fibonacci retracement level as well. We expect a bearish breakout below this support level, which would provide the momentum for the continuation of the bearish move down south, with the 0.86830 level as a possible downside target. It is worth noting that price is still holding below both the descending trendline and moving average resistance, showing bearish pressure in line with our bearish bias.
Looking to the H4 timeframe, we see that price has successfully broken below the 0.89197 level, which we have previously established as a strong horizontal pullback support level in line with our 61.8% Fibonacci retracement. Price is testing the 0.8900 level where we currently see a small bounce. In this bearish scenario, we expect to see a break below the 0.8900 level and a further move down south to the 0.88240 level which is January’s opening level.
Areas of consideration:
- USD/CHF continues to show bearish pressure.
- Price managed to break below the 0.89197 level, which is a strong support level.
- 86830 daily level would be the next downside target should price make a further bearish move down.
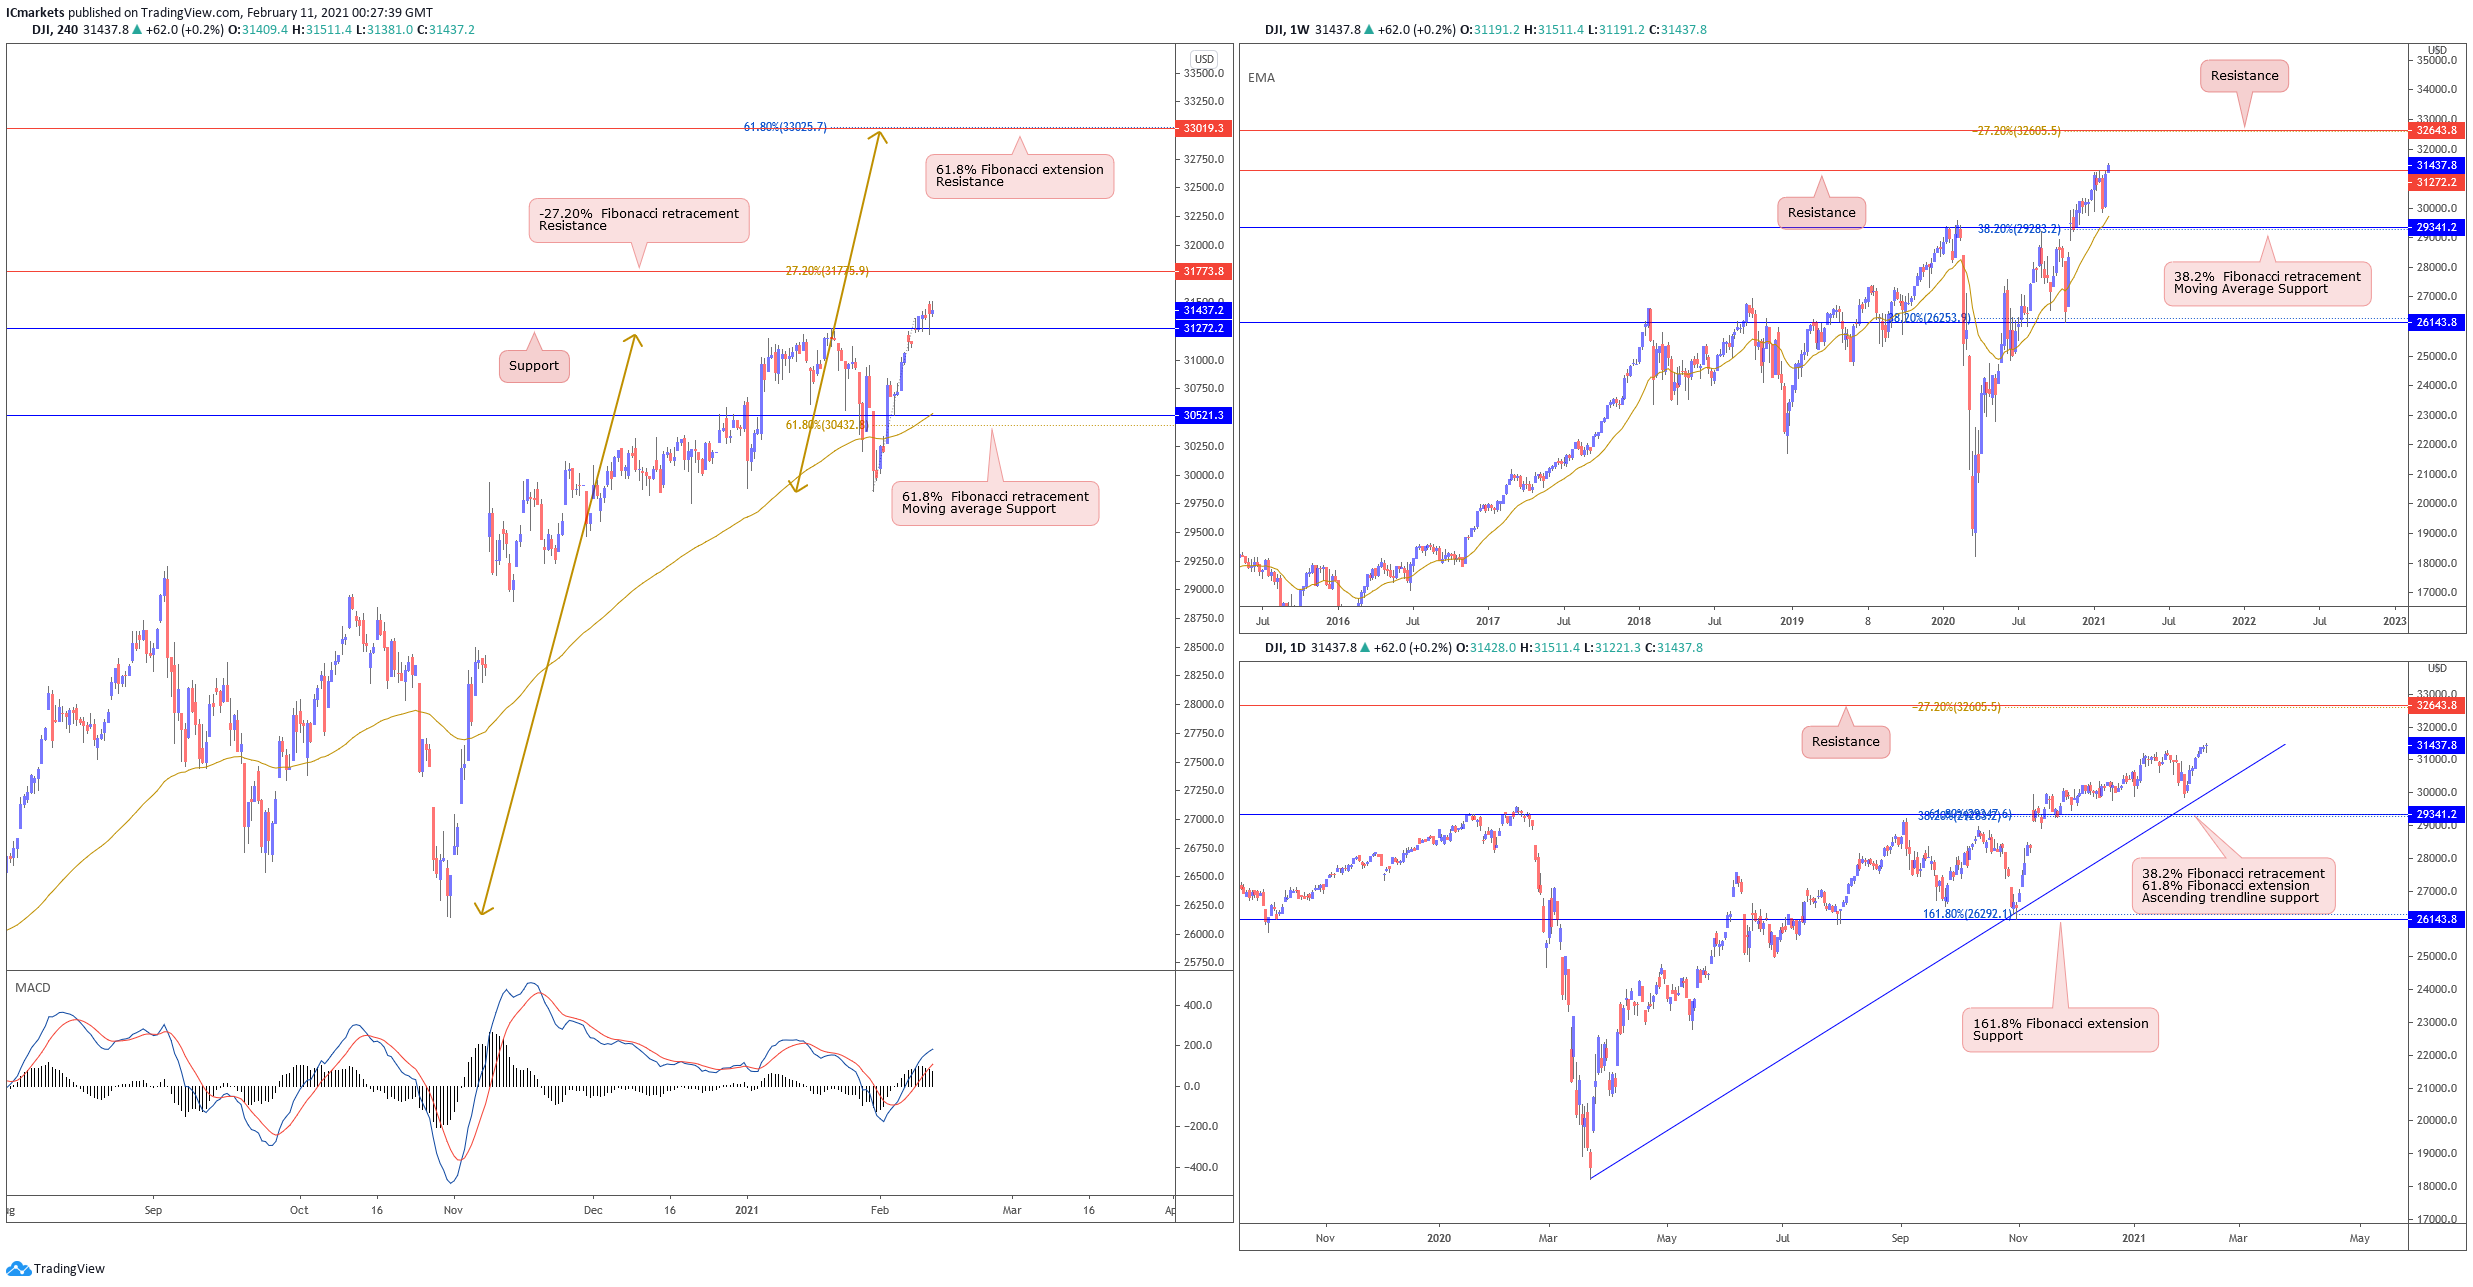
Dow Jones Industrial Average:
On the weekly, price is still testing the 31272 level. A weekly close above this level should see price pushing even higher towards the next resistance at 32643. Otherwise, failure to hold above 31272 could mean that this is a fake out and probably pull back towards 29341 support. With no change for the Daily, price continues to hold very strongly above ascending trendline support. Traders should be careful when deciding to trade any short term pullbacks as the bullish momentum on the longer term is very strong.
On the H4, price drifted higher whilst still holding above 31272 support level. With technical indicators showing room for further bullish upside, 31272 is the level where we may possibly see buyers pile in and add to their longs with a possible resistance target at 31773.8. Otherwise, failure to hold above 31272 could see price swing back and come back to the 61.8% Fibonacci retracement level and moving average support at 30521.
Areas of consideration:
- 31272 key support to watch
- Bullish momentum on both the weekly and H4 chart is very strong.
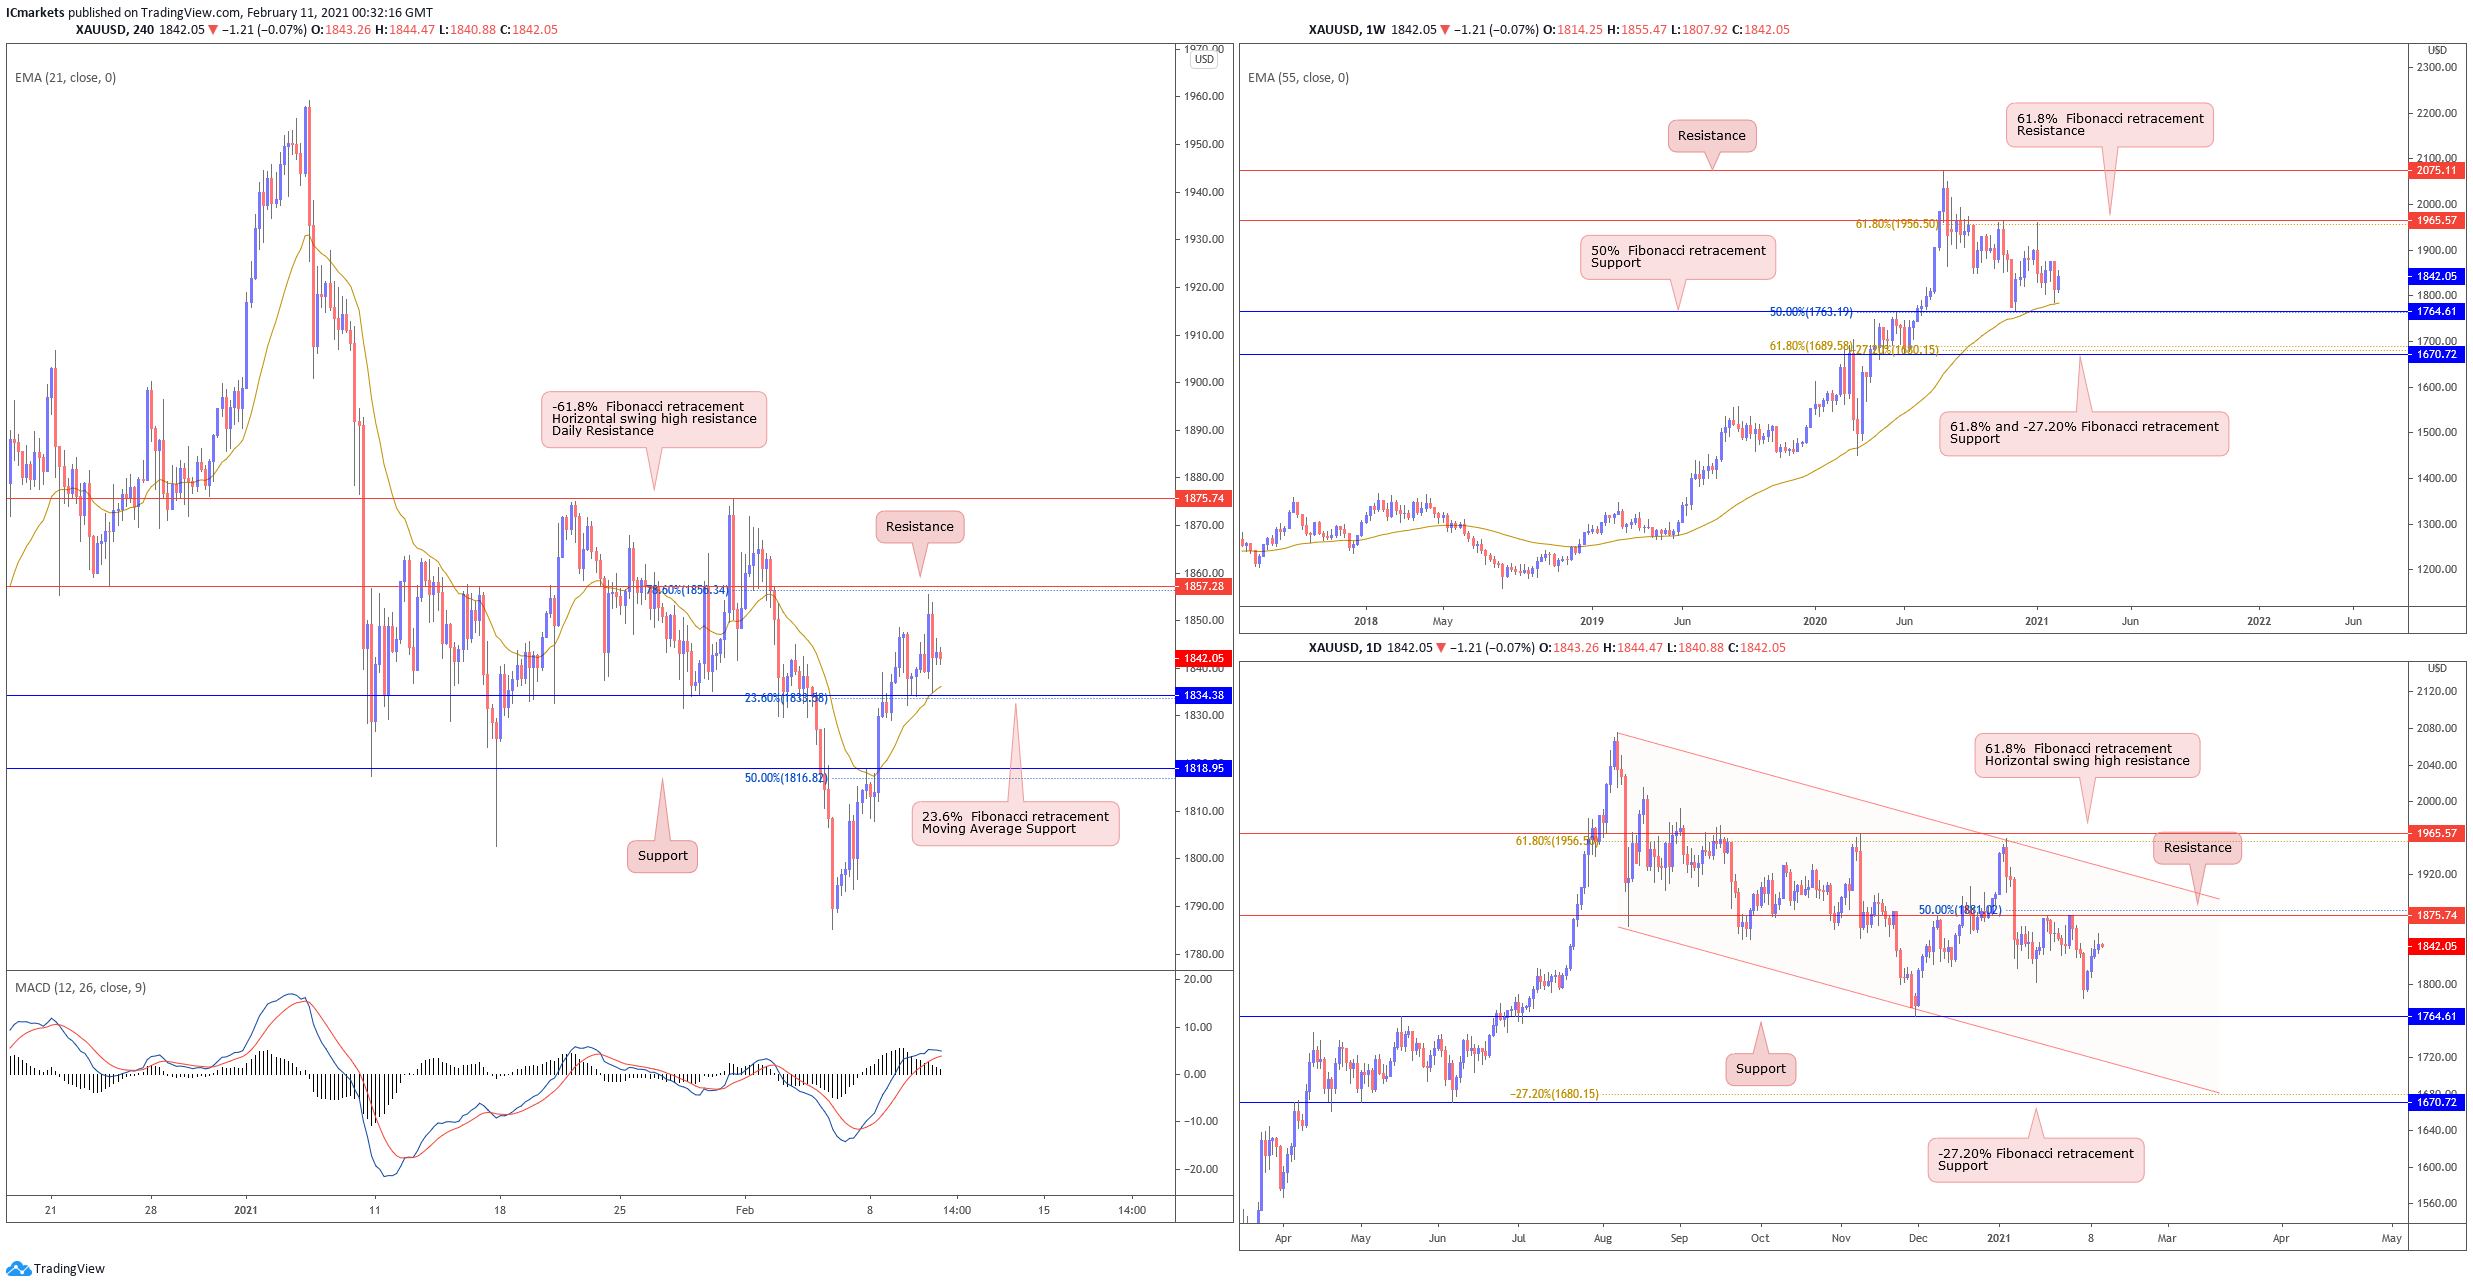
XAU/USD (GOLD):
On the weekly timeframe, gold is still holding above long term moving average support. With price now close to support at 1764, traders can expect price to show a small bounce reaction above this level. On the daily chart, price came shy of 1764 support and drifted higher. Over the course of this week, we should see price ranging between 1875 resistance and 1764 support.
On the 4H timeframe, price holding above moving average. A short term intraday bounce above 1834 support could be possible. MACD indicator is above 0 as well, showing room for further bullish upside. Otherwise, failure to hold above 1834 support could see price swing the other way towards next support at 1818.
Areas of consideration:
- 1834 support is a strong intraday support to watch
- Technical indicators such as moving average and MACD showing room for further bullish momentum
The accuracy, completeness and timeliness of the information contained on this site cannot be guaranteed. IC Markets does not warranty, guarantee or make any representations, or assume any liability regarding financial results based on the use of the information in the site.
News, views, opinions, recommendations and other information obtained from sources outside of www.icmarkets.com.au, used in this site are believed to be reliable, but we cannot guarantee their accuracy or completeness. All such information is subject to change at any time without notice. IC Markets assumes no responsibility for the content of any linked site.
The fact that such links may exist does not indicate approval or endorsement of any material contained on any linked site. IC Markets is not liable for any harm caused by the transmission, through accessing the services or information on this site, of a computer virus, or other computer code or programming device that might be used to access, delete, damage, disable, disrupt or otherwise impede in any manner, the operation of the site or of any user’s software, hardware, data or property.


