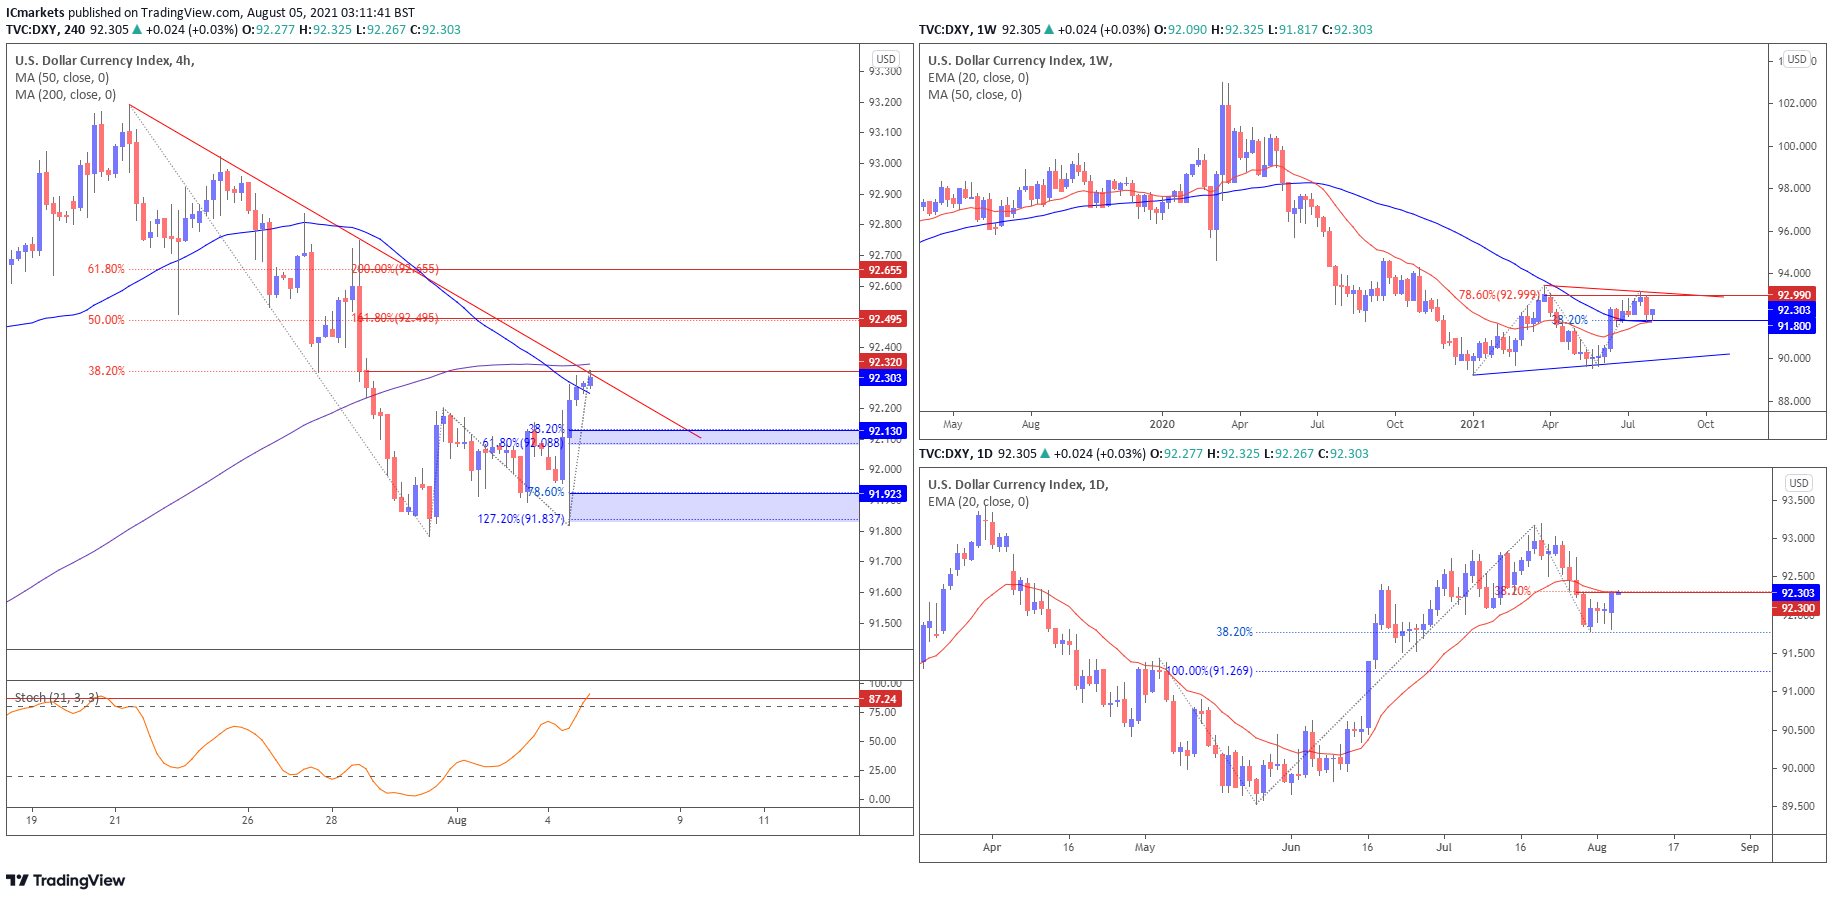
DXY:
Looking at the weekly chart we can see that price found support at 91.80, in-line with 38.2% Fibonacci retracement. On the daily chart, price is at major resistance at 92.30, in-line with 38.2% Fibonacci retracement and 20EMA. We could potentially see price action facing bearish pressure at this level today.
On the H4 timeframe price is at major resistance at 92.32, in-line with 38.2% Fibonacci retracement, 50MA, 200MA and descending trendline resistance. We could potentially see the price drop to 92.13, in-line with 38.2% Fibonacci retracement, 61.8% Fibonacci extension and horizontal overlap support. Stochastic is also at resistance where previous drops occurred. The next support could potentially be at 91.923, in-line with 78.6% Fibonacci retracement and 100% Fibonacci extension.
If the price bounces above current level, it could potentially swing towards 92.495, in-line with 50% Fibonacci retracement and 161.8% Fibonacci extension. The next resistance could be at 92.655, in-line with 61.8% Fibonacci retracement and 200% Fibonacci extension.
Areas of consideration:
- H4 time frame, support level at 13 and 91.923
- H4 time frame, resistance level at 495 and 92.655
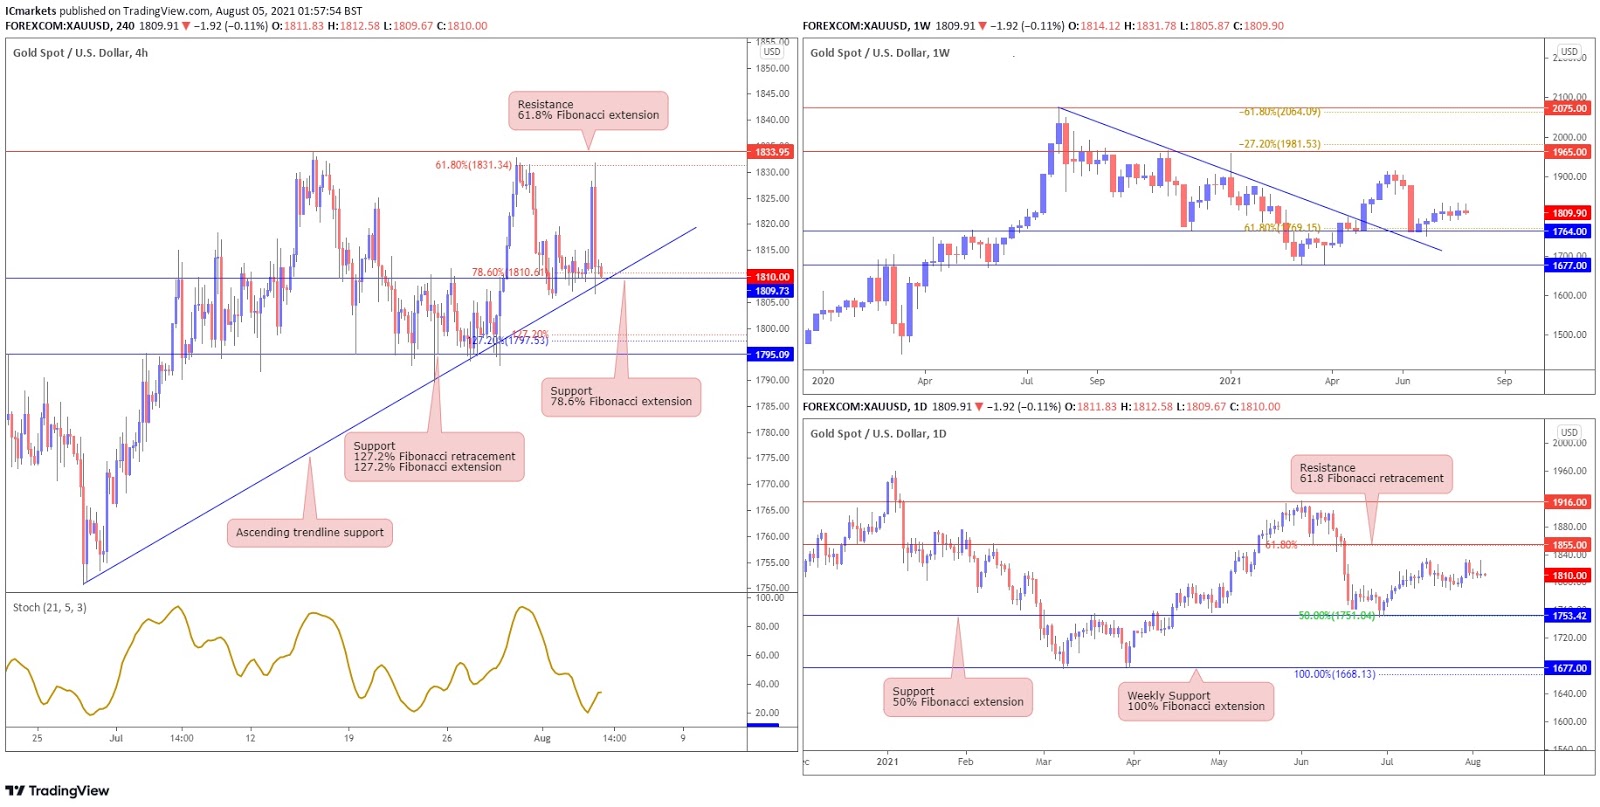
XAU/USD (GOLD):
On the weekly timeframe, price bounced and continues to hold above key trendline pullback support at 1764. On the daily, price is now trading sideways, holding between 1855 resistance and 1753.42 horizontal overlap resistance. With no clear levels for entry that provides a good risk to reward ratio, we prefer to keep a neutral stance for now. Breaking above resistance at 1855 will see price push higher towards 1916 resistance. Otherwise, a break below 1764 support will see price drop lower towards 1677 support instead.
On the H4, price dropped lower and is coming back to test the 1809.73 support zone. With stochastic bouncing off hidden support and prices holding above ascending trendline support, a short term bounce towards graphical swing high at 1833.95 resistance could be possible. However, failure to hold above the 1809.73 support zone will see the price drop lower towards the horizontal overlap support zone at 1793.72 support.
Areas of consideration:
- 73 H4 support level is key level to watch
- 95 H4 resistance level
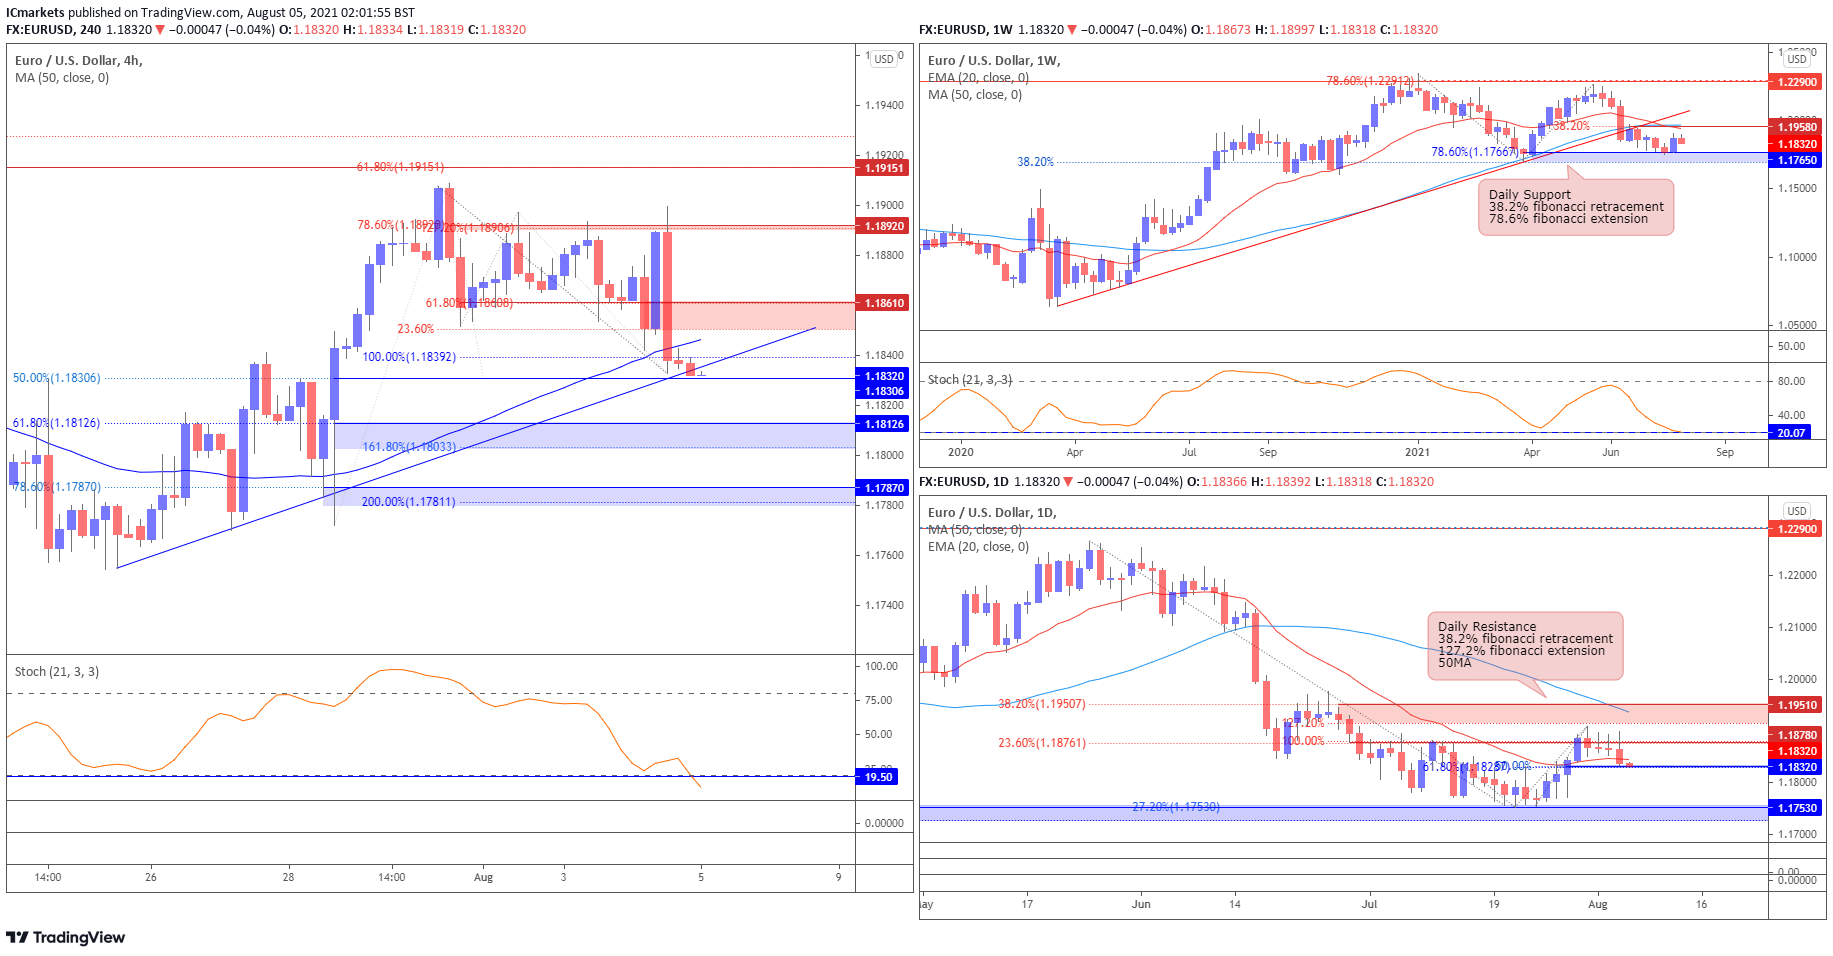
EUR/USD:
Looking at the weekly chart we can see that price bounced from support at 1.17650, in-line with 38.2% Fibonacci retracement and 78.6% Fibonacci extension. Price could potentially swing towards resistance at 1.19580, 38.2% Fibonacci retracement, 20EMA and 50MA. Stochastic is also at support where previous bounces occurred. On the daily chart, price faced bearish pressure at 1.18780 and pulled back to 1.18320, in-line with 50% Fibonacci retracement and 61.8% Fibonacci extension.
On the H4 timeframe, prices swung towards resistance at 1.18920 thereafter facing bearish pressure to support at 1.18378, in-line with 50% Fibonacci retracement, 100% Fibonacci extension and ascending trendline support. Price is at a major support level where there could potentially be a bounce to first resistance at 1.18610, in-line with 23.6% Fibonacci retracement and 61.8% Fibonacci extension. Stochastic is at the support level where previous bounces occurred. The next resistance could potentially be at 1.18920, in-line with 78.6% Fibonacci retracement, 127.2% Fibonacci extension.
If price drops from here, it could potentially swing towards support at 1.18126, in-line with 61.8% Fibonacci retracement and 161.8% Fibonacci extension. The next support could potentially be at 1.17870, in-line with 78.6% Fibonacci retracement and 200% Fibonacci extension.
Areas of consideration:
- H4 time frame, support level at 1.18126 and 1.17870
- H4 time frame, resistance level at 1.18610 and 1.18920
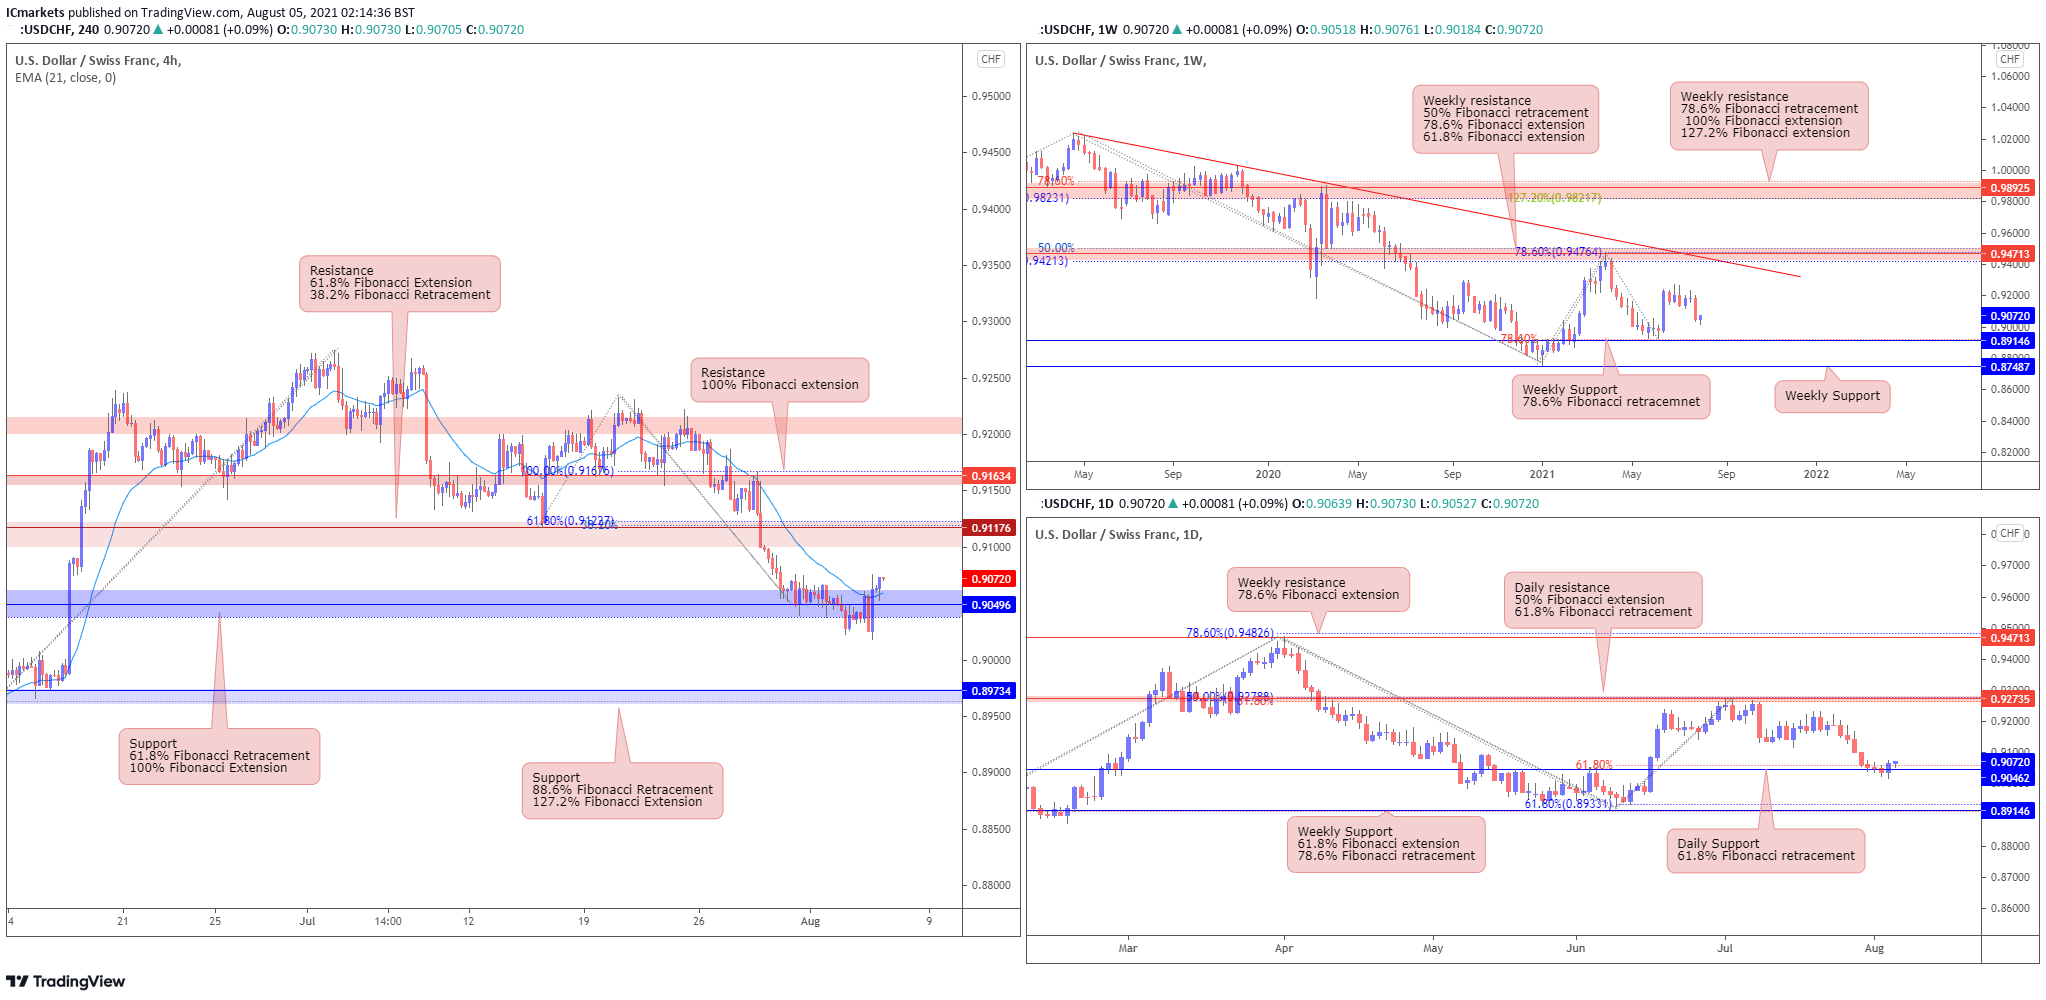
USD/CHF:
USD/CHF has shown a strong bounce from the weekly 0.89146 support, in line with 78.6% Fibonacci retracement, and price is now holding below the descending trendline resistance. The daily chart shows that price is now approaching and likely to bounce up from the daily support in line with the horizontal overlap support and the 61.8% Fibonacci retracement level.
On the H4 chart, it appears that price has just bounced up from the horizontal swing low support which is in line with the 61.8% Fibonacci retracement and 100% FIbonacci extension. We can expect price to rise up to the potential pullback resistance in line with the 61.8% FIbonacci extension and the 38.2% FIbonacci retracement . Our bullish bias is further supported by how price is holding above the EMA.
Areas of consideration:
- Price could test this level a few more times before rising to the 1st resistance at 0.91176
- Price could break the support at 0.90496 and push down further to take support at 0.89734.
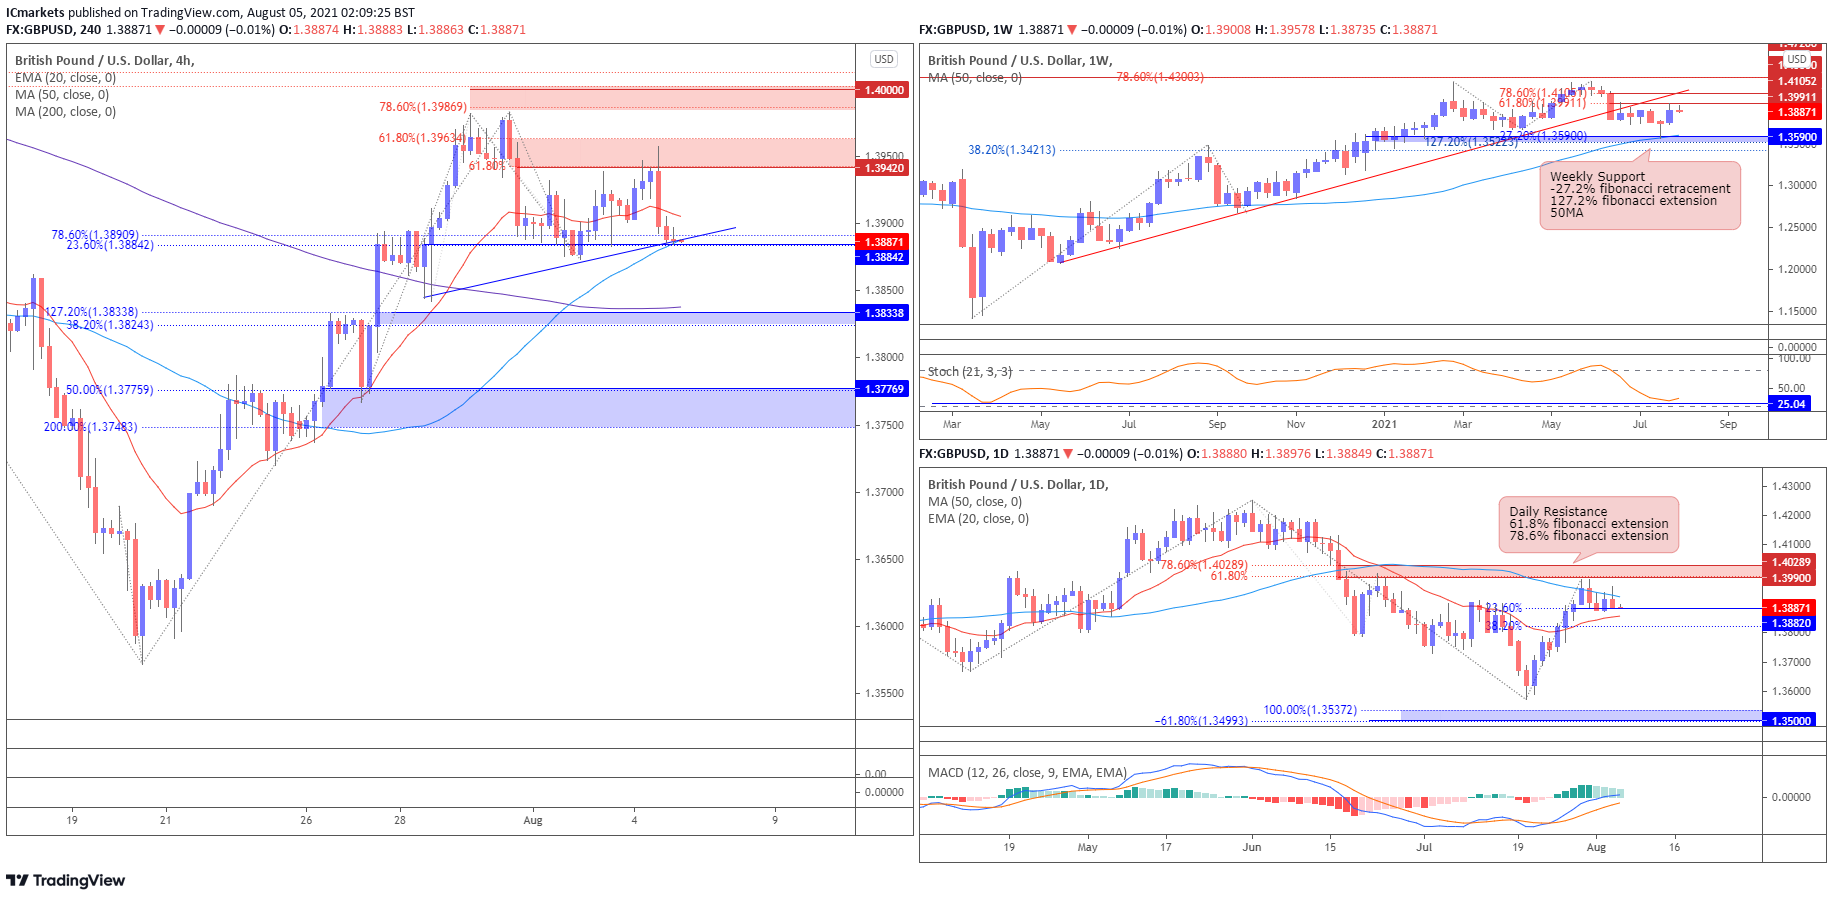
GBP/USD:
Looking at the weekly chart, prices bounced towards resistance at 1.39911, in-line with 61.8% Fibonacci retracement. We could potentially see the price bounce back to retest resistance at 1.41052, in-line with 78.6% Fibonacci retracement and ascending trendline support-turned-resistance. Stochastic is also at the support level where previous bounces occurred. On the daily time frame, price pulled back to support 1.38820, in-line with 23.6% Fibonacci retracement. We could potentially see the price rebound to 1.39900, in-line with 61.8% Fibonacci retracement and 78.6% Fibonacci extension. MACD is also indicating bullish momentum for further upside potential.
On the H4 timeframe, price is at major support at 1.38842, in-line with 23.6% Fibonacci retracement, 78.6% Fibonacci extension and ascending trendline support. We could potentially see the price bounce towards resistance at 1.39420, in-line with 61.8% Fibonacci retracement and 61.8% Fibonacci extension. The next resistance could potentially be at 1.40000, in-line with 78.6%, 127.2% Fibonacci extension and psychological resistance.
If the price drops, it could potentially swing towards support at 1.38338, in-line with 38.2% Fibonacci retracement, 127.2% Fibonacci extension and 200MA. The next support could potentially be at 1.37769, in-line with 50% Fibonacci retracement, 200% Fibonacci extension and horizontal overlap support.
Areas of consideration:
- H4 time frame, 38338 and 1.37769 support level
- H4 time frame, 1.39420 and 1.40000 resistance level
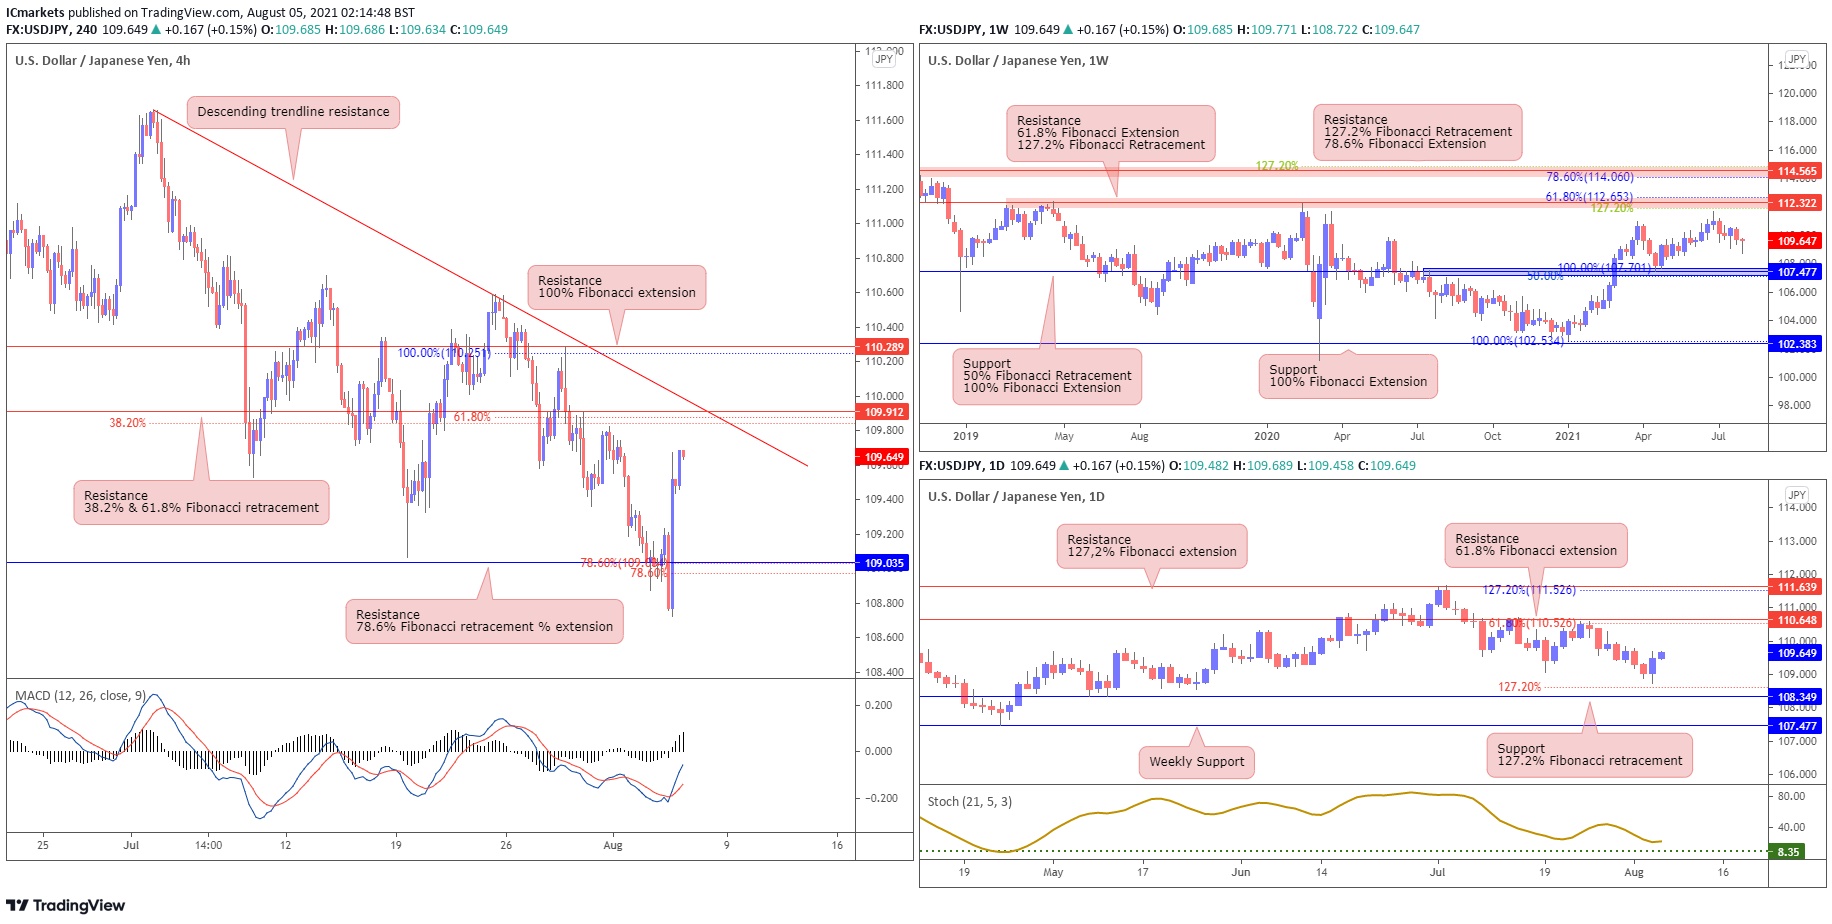
USD/JPY
From the weekly timeframe, prices are pushing down towards the horizontal swing low support of 107.477, where we might see a bounce from this level and price may rally to the resistance of 11.322. In the case that price continues falling, prices may take support at horizontal swing low support of 102.383. On the daily timeframe, prices are bouncing off horizontal swing low support of 108.394, and are likely to rally to resistance at 110.648.
On the H4 timeframe, prices are reacting below the descending trendline resistance and are approaching the Fibonacci confluence area of 109.912. Prices are expected to fall to the horizontal swing low of 109.035. Alternatively, prices may rally to a horizontal swing high of 110.289. Indicator showing bearish bias.
Areas of consideration:
- 912 resistance level on the H4 timeframe
- 035 support level on the H4 timeframe
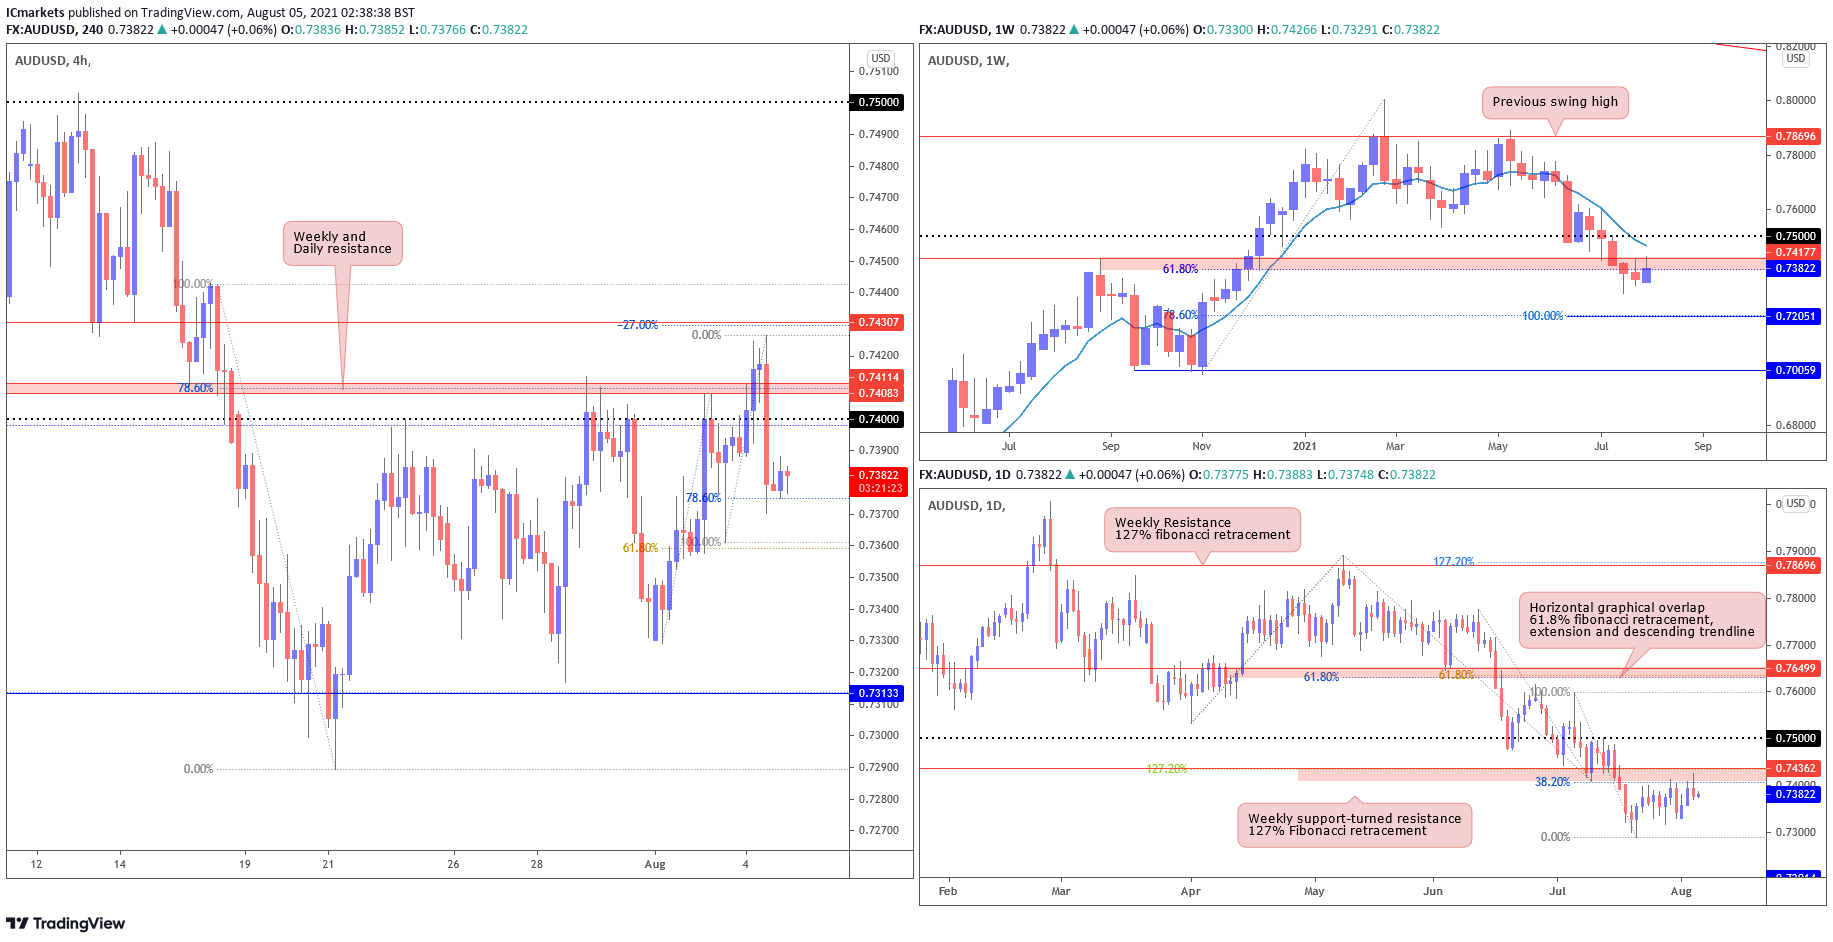
AUD/USD:
Looking at the weekly chart, price has broken beneath the 0.74177 support-turned-resistance level in line with 61.8% fibonacci retracement, where we saw price retesting this area before price pushes down further. This is supported by price trending under the moving average. On the Daily timeframe, we are seeing a similar picture where price is testing the Weekly resistance in line with 127.2% and 38.2% fibonacci retracement level.
Lastly, on the H4 timeframe, price had an intra-day break above the Weekly and Daily resistance, before dropping 56 pips and finding support at 78.6% fibonacci retracement. From here we may find price pushing up towards 0.74307 in line with -27% fibonacci retracement.
Areas of consideration:
- H4 time frame showing short-term bullish momentum.
- Daily and Weekly showing bearish momentum.
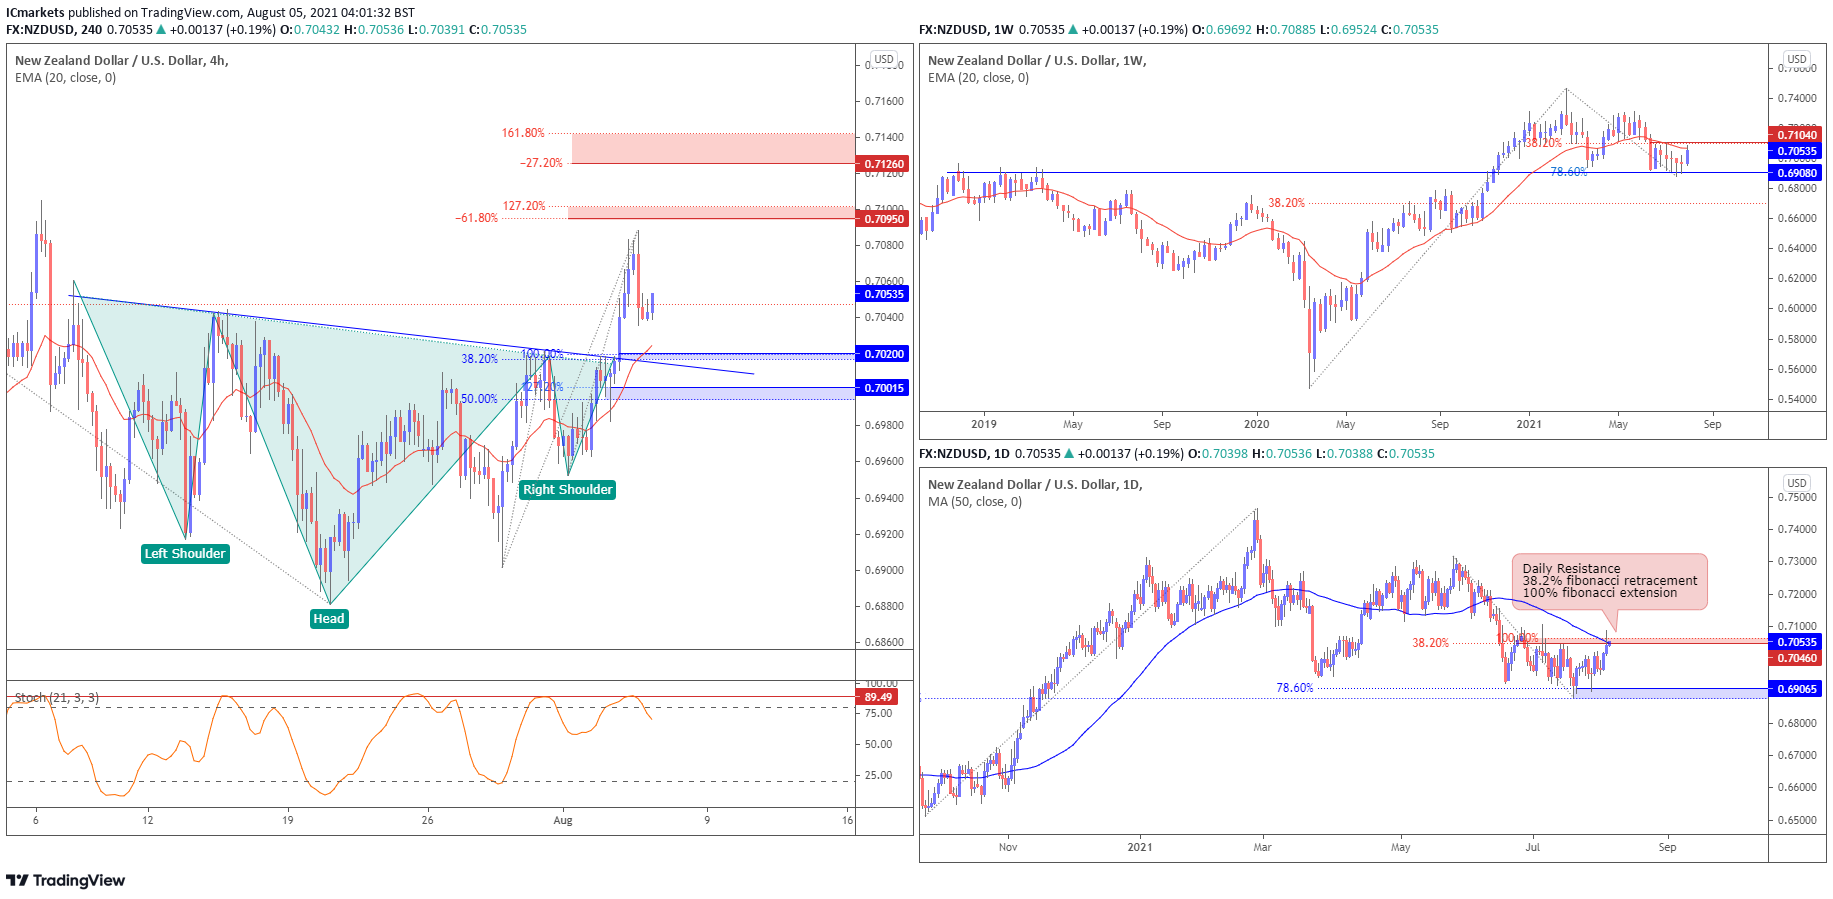
NZD/USD:
Looking at the weekly chart we could see that price bounced from support 0.69080, in-line with 78.6% Fibonacci extension and previous horizontal overlap support. On the daily chart, price is at major resistance at 0.7046, in-line with 38.2% Fibonacci retracement and 100% Fibonacci extension. We could potentially see price action facing bearish pressure at this level today.
On the H4 timeframe price broke out of the inverse head and shoulder pattern. We could potentially see price action retrace back to first support at 0.70200, in-line with 38.2% Fibonacci retracement , 100% Fibonacci extension and 20EMA before continuing higher. Stochastic is also at resistance level where previous drops occurred, in-line with our short-term pull-back. The next support will be at 0.70015, in-line with 50% Fibonacci retracement and 127.2% Fibonacci extension.
If the price bounces higher, it could potentially swing towards resistance at 0.70950, in-line with -61.8% Fibonacci retracement and 127.2% Fibonacci extension. The next support could potentially be at 0.71260, in-line with -27.2% Fibonacci retracement and 161.8% Fibonacci extension.
Areas of consideration:
- H4 time frame, support level at 0.70200 and 70015
- H4 time frame, resistance level at 70950 and 0.71260
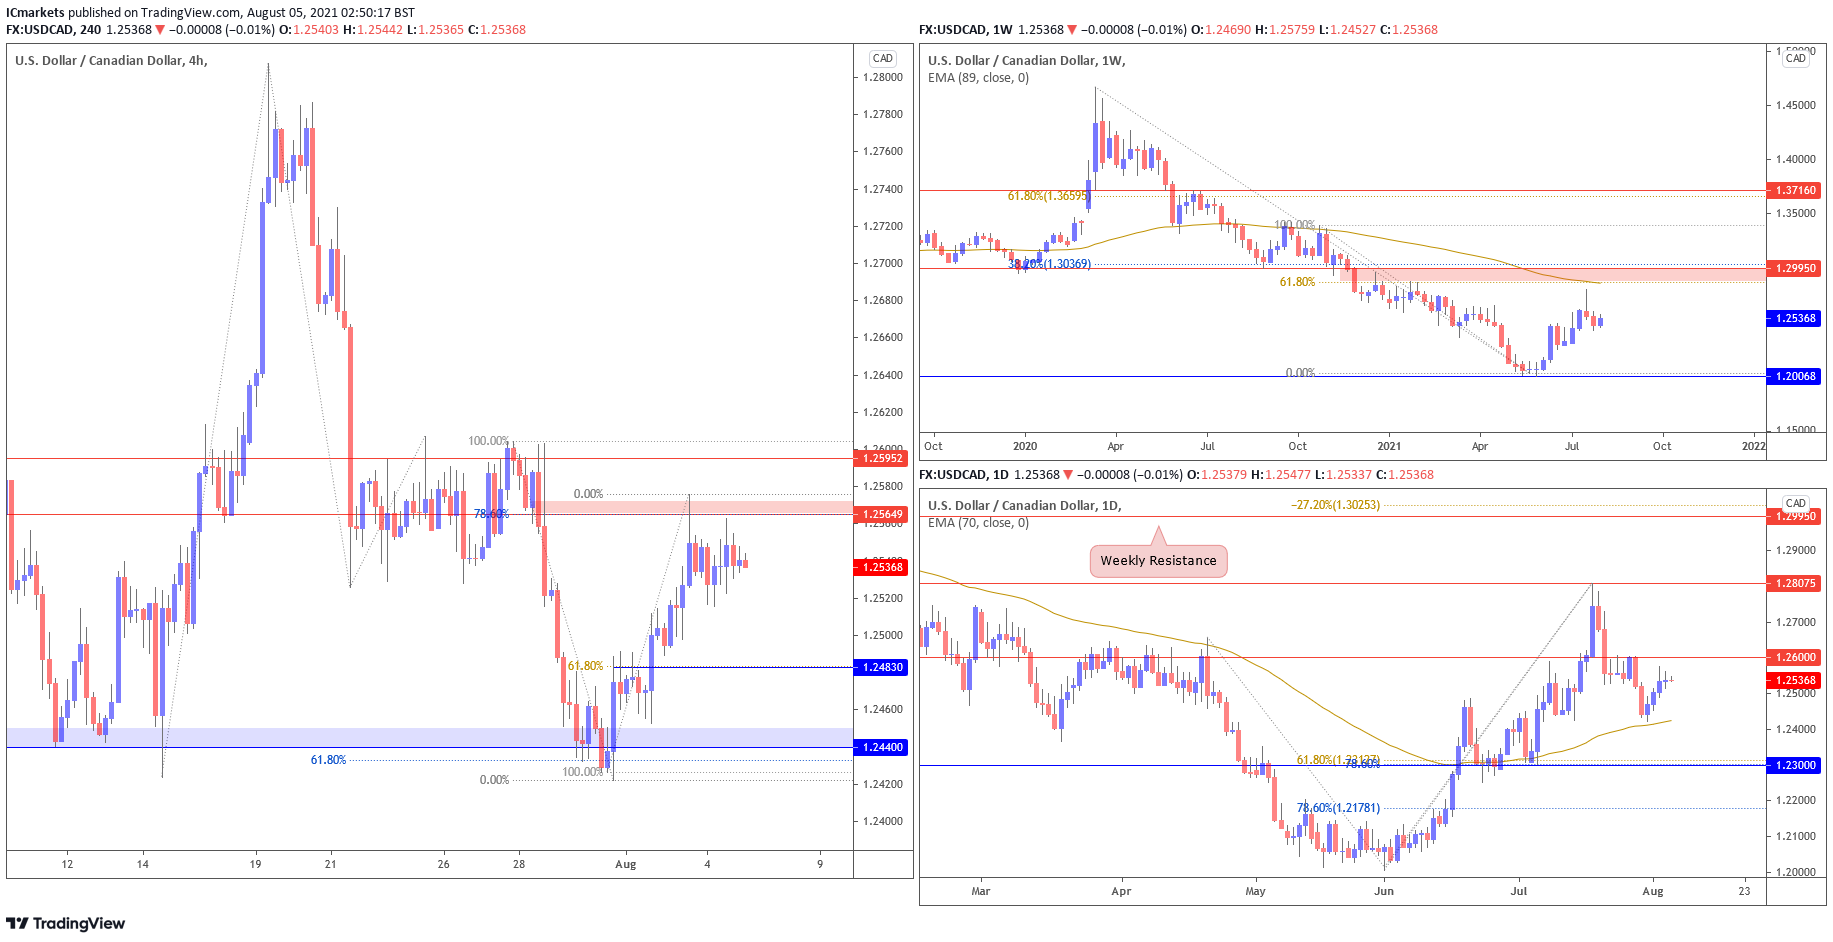
USD/CAD:
On the Weekly timeframe, price is holding below long term moving average and also 38.2% Fibonacci retracement level at 1.29950. As long as the price is holding below this level, we see price facing further bearish pressure in the long term. On the Daily, price recently bounced from the moving average and may find resistance at the resistance level of major number 1.26, if the moving average is broken, we may see a push down towards the first support at 1.23 major level, in line with 61.8% fibonacci retracement and 78.6% fibonacci extension.
On the H4, price has reversed from 78.6% fibonacci retracement at 1.25649, from here we may expect a drop towards 1.24830, in line with 61.8% fibonacci retracement.
Areas of consideration:
- H4 showing sideways consolidation.
- Weekly and Daily showing room for bearish momentum.
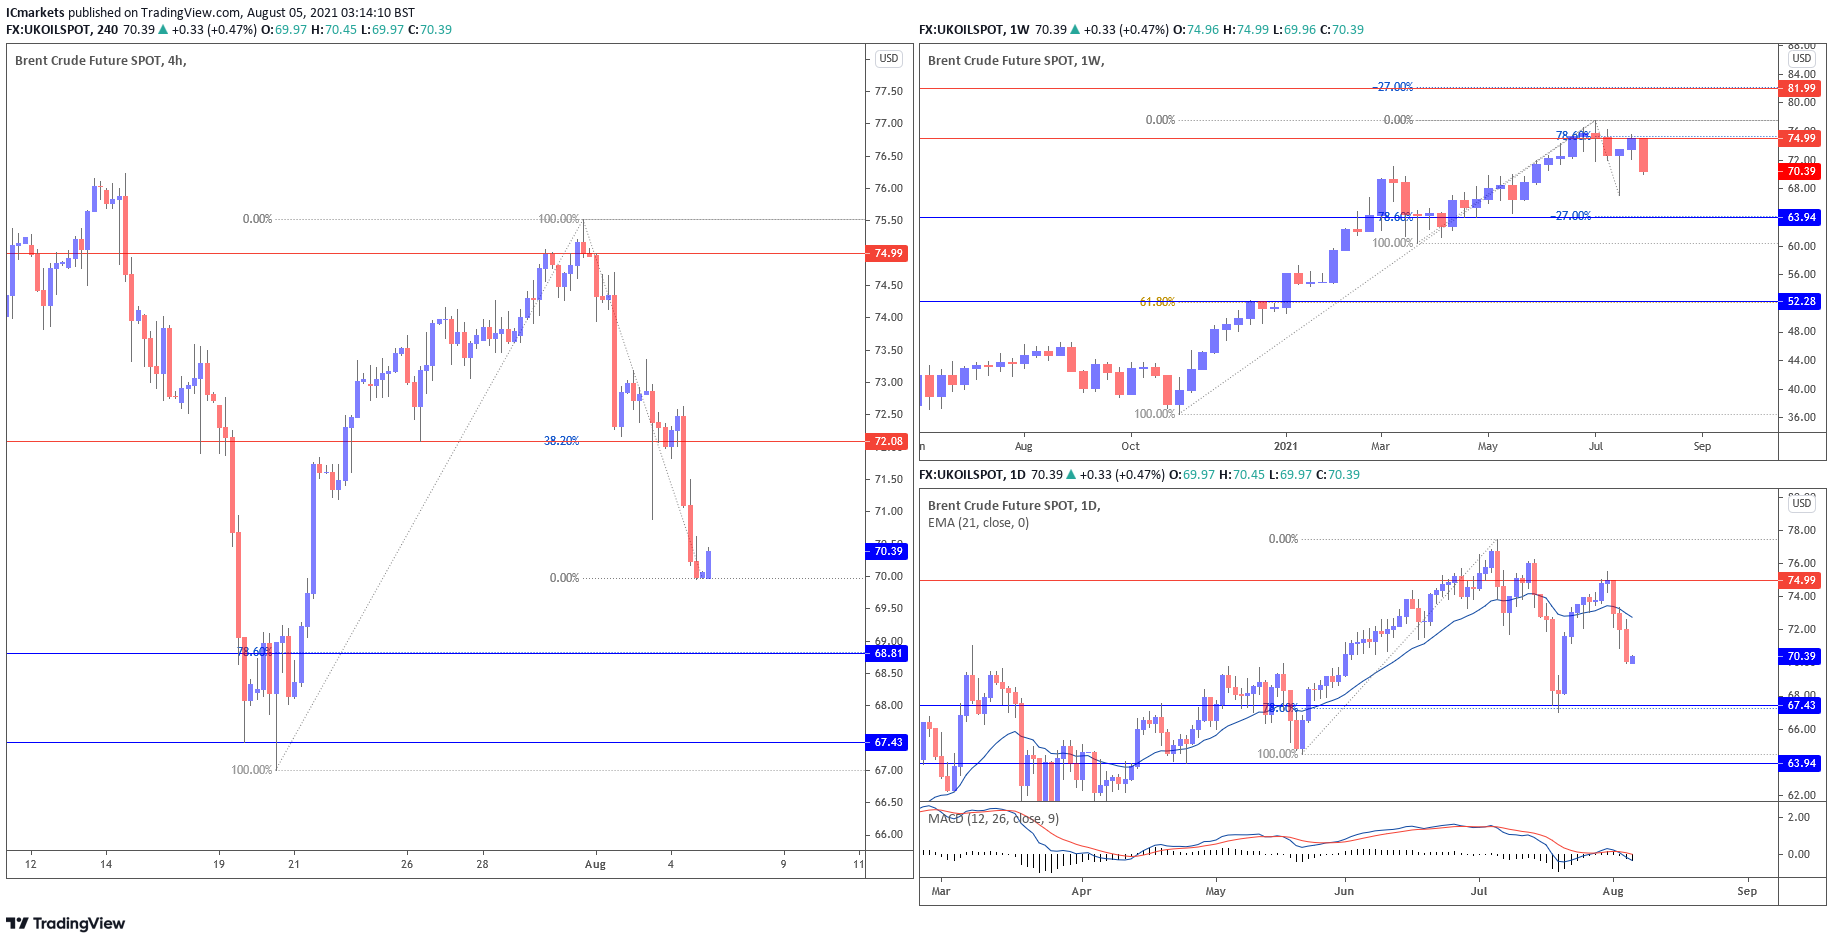
OIL:
On the Weekly timeframe, we can see that price has reversed from 78.6% fibonacci retracement at 74.99, if price continues its bearish momentum, it may find support at 63.94 in line with -27% and 78.6% fibonacci retracement. However, if price breaks above 74.99 resistance, it may swing up towards the next resistance at 81.99. On the daily timeframe, we are seeing a similar bearish pressure as price is trending under the moving average, and MACD is below the 0 line. Price may find support at 67.43 in line with 78.6% fibonacci retracement.
Lastly, on the H4, price is showing a short-term bullish reversal where we may consider a short position at 72.08 in line with 38.2% fibonacci retracement, before pushing down towards support at 68.81 in line with 78.6% fibonacci retracement.
Areas of consideration:
- H4 is showing short-term bullish momentum
- Weekly and Daily showing bearish momentum.
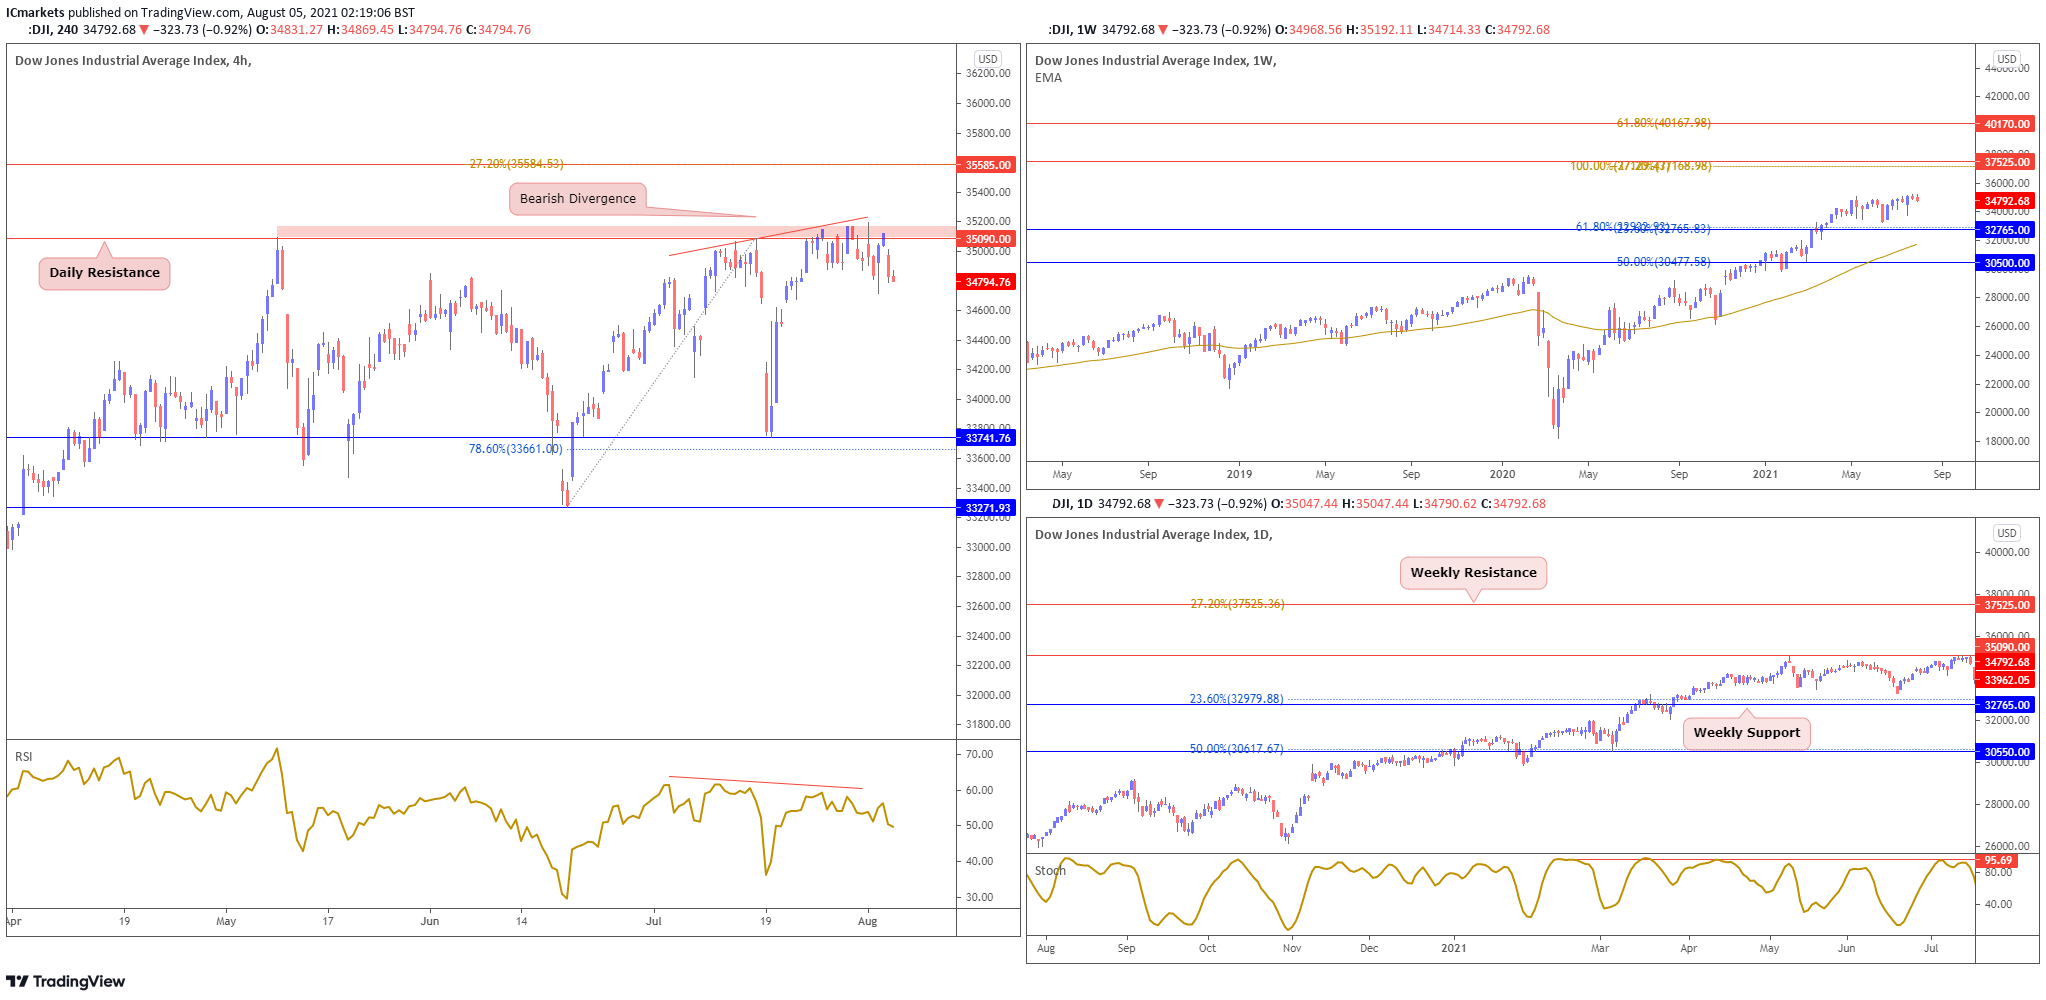
Dow Jones Industrial Average:
On the weekly chart, price is trading sideways holding between 32765 support and 37525 resistance. With price holding above long term moving average, we see a possibility of price facing further bullish pressure. On the daily chart, price is currently trading sideways, testing and holding below resistance at 35090. With stochastic still holding below resistance where price dropped in the past, we see price facing possible bearish pressure.
On the H4, price appears to be resisting off the horizontal swing high resistance at the 35090 price level and is likely to plunge and take support at the 33741 price level in line with the 78.6% FIbonacci retracement level. Bearish divergence still remains valid on RSI indicator. There is a chance that price might push towards the 33741 support. Otherwise failure to hold below 35090 resistance should see price swing the other way towards 35585 resistance instead.
Areas of consideration:
- 35090 daily resistance is key level to watch
- Bearish divergence on H4
The accuracy, completeness and timeliness of the information contained on this site cannot be guaranteed. IC Markets does not warranty, guarantee or make any representations, or assume any liability regarding financial results based on the use of the information in the site.
News, views, opinions, recommendations and other information obtained from sources outside of www.icmarkets.com.au, used in this site are believed to be reliable, but we cannot guarantee their accuracy or completeness. All such information is subject to change at any time without notice. IC Markets assumes no responsibility for the content of any linked site.
The fact that such links may exist does not indicate approval or endorsement of any material contained on any linked site. IC Markets is not liable for any harm caused by the transmission, through accessing the services or information on this site, of a computer virus, or other computer code or programming device that might be used to access, delete, damage, disable, disrupt or otherwise impede in any manner, the operation of the site or of any user’s software, hardware, data or property.


