
Key risk events today:
China Trade Balance.
(Previous analysis as well as outside sources – italics).
EUR/USD:
Weekly gain/loss: +2.33%
Weekly close: 1.1285
Weekly perspective:
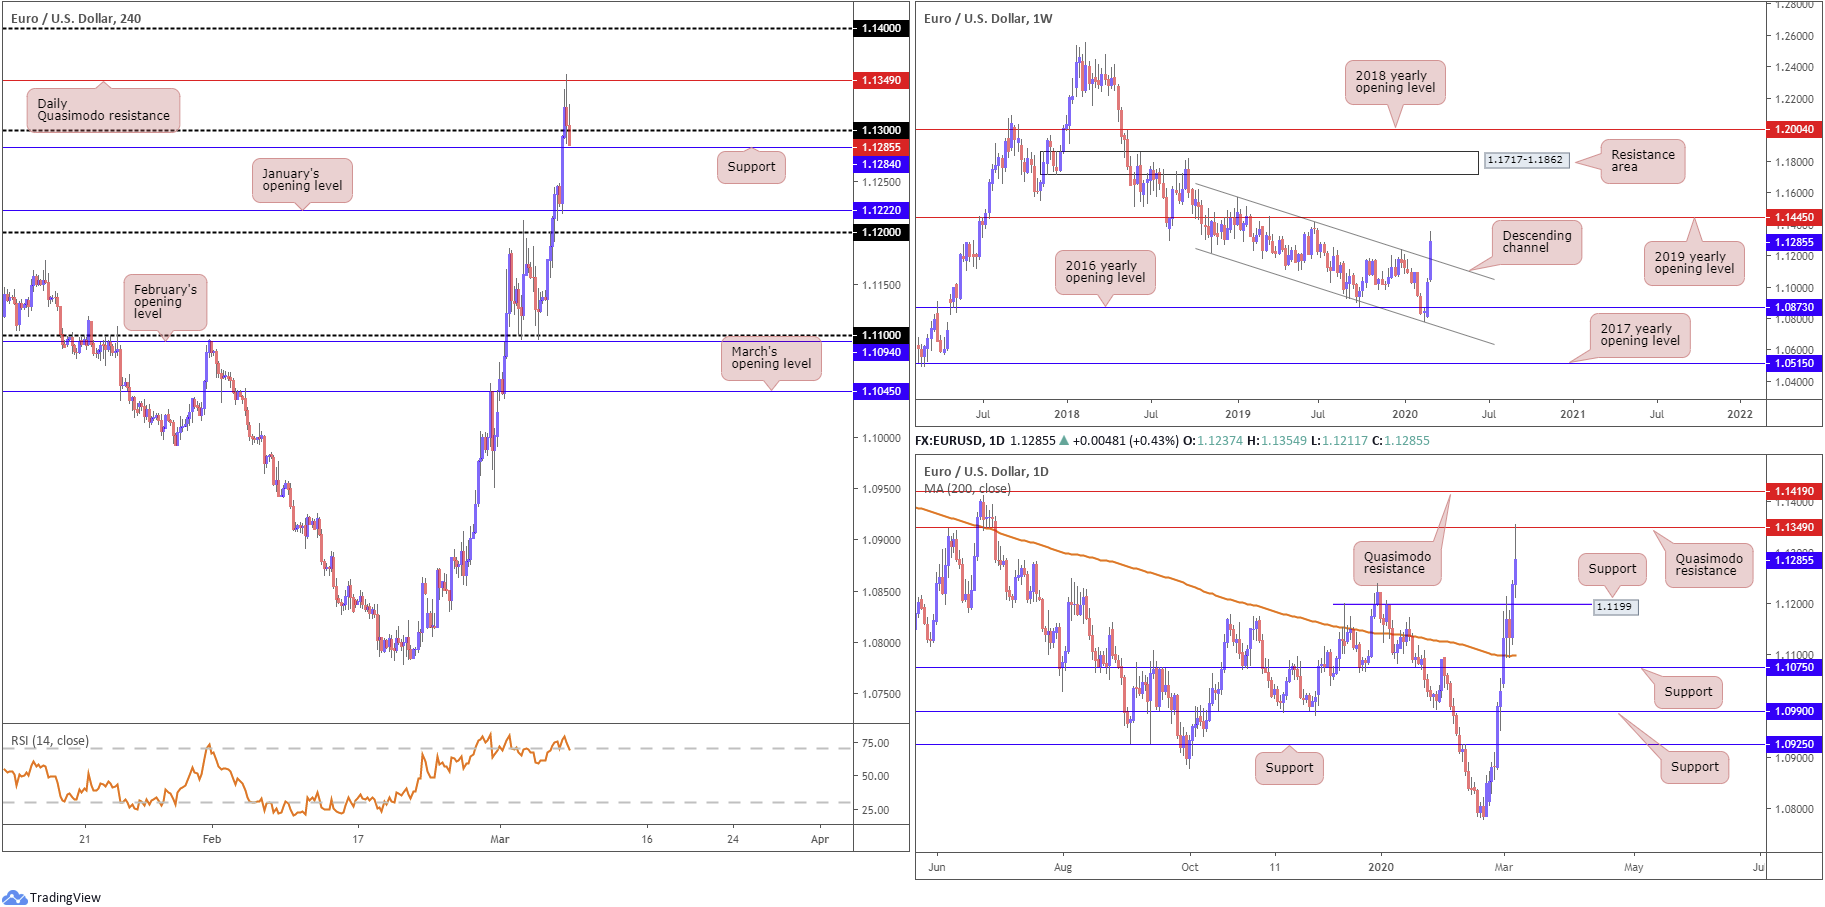
EUR/USD bulls went on the offensive last week, sharply extending gains. Adding more than 250 points, price bettered long-term channel resistance, extended from the high 1.1569.
Sustained upside from here could land traders at the 2019 yearly opening level from 1.1445 this week – a noted port of resistance, boasting incredibly strong history.
With respect to the primary trend, the breakout above the mentioned channel resistance may see the beginning of a long-term trend change take place.
Daily perspective:
After displaying resilience off the widely watched 200-day SMA (orange – 1.1099), Quasimodo resistance at 1.1199 ceded ground in strong fashion Thursday, positioning buyers in a healthy spot. Friday caught another strong wind, running through 1.1239, the apex of the aforementioned Quasimodo resistance, and shaking hands with another layer of Quasimodo resistance at 1.1349 into the week’s end. A break of this level this week suggests scope for further upside towards Quasimodo resistance at 1.1419.
H4 perspective:
The broad dollar index plummeted Friday, as the Fed’s untimely intervention compounded the extreme compression in US Treasury yields and other core global bond yields. Meanwhile, stronger-than-expected US non-farm payrolls data offered limited respite, with the DXY crossing the 96.00 handle.
Europe’s single currency jumped through 1.13 against the buck Friday, reaching highs at 1.1354, before retesting the latter and settling a touch lower. Support is seen close by at 1.1284, while Quasimodo resistance on the daily timeframe currently controls upside at 1.1349. In terms of the relative strength index (RSI), the value remains within overbought terrain, a touch below peaks of 80.00.
Areas of consideration:
Longer-term flow has weekly price eyeing the 2019 yearly opening level at 1.1445, indicating higher prices could be on the cards this week until reaching the said region. Beyond this point, traders may latch on to the possibility of a move forming to a resistance area priced in at 1.1717-1.1862.
A little lower on the curve, daily Quasimodo resistance at 1.1349 may throw a spanner in the works, potentially guiding the unit back to as far south as support coming in at 1.1199. Therefore, traders considering longs from 1.13ish this week, structurally, face daily selling. Once cleared through 1.1349, though, 1.14 and daily Quasimodo resistance at 1.1419 could be in store, prompting intraday buying either on the breakout above 1.1349 or on any retest seen.
A H4 close south of 1.1284, on the other hand, potentially sets the stage for a run to January’s opening level at 1.1222, the 1.12 handle, and ultimately daily support at 1.1199. Movement below 1.1284, therefore, may unlock intraday bearish scenarios.
GBP/USD:
Weekly gain/loss: +1.73%
Weekly close: 1.3044
Weekly perspective:
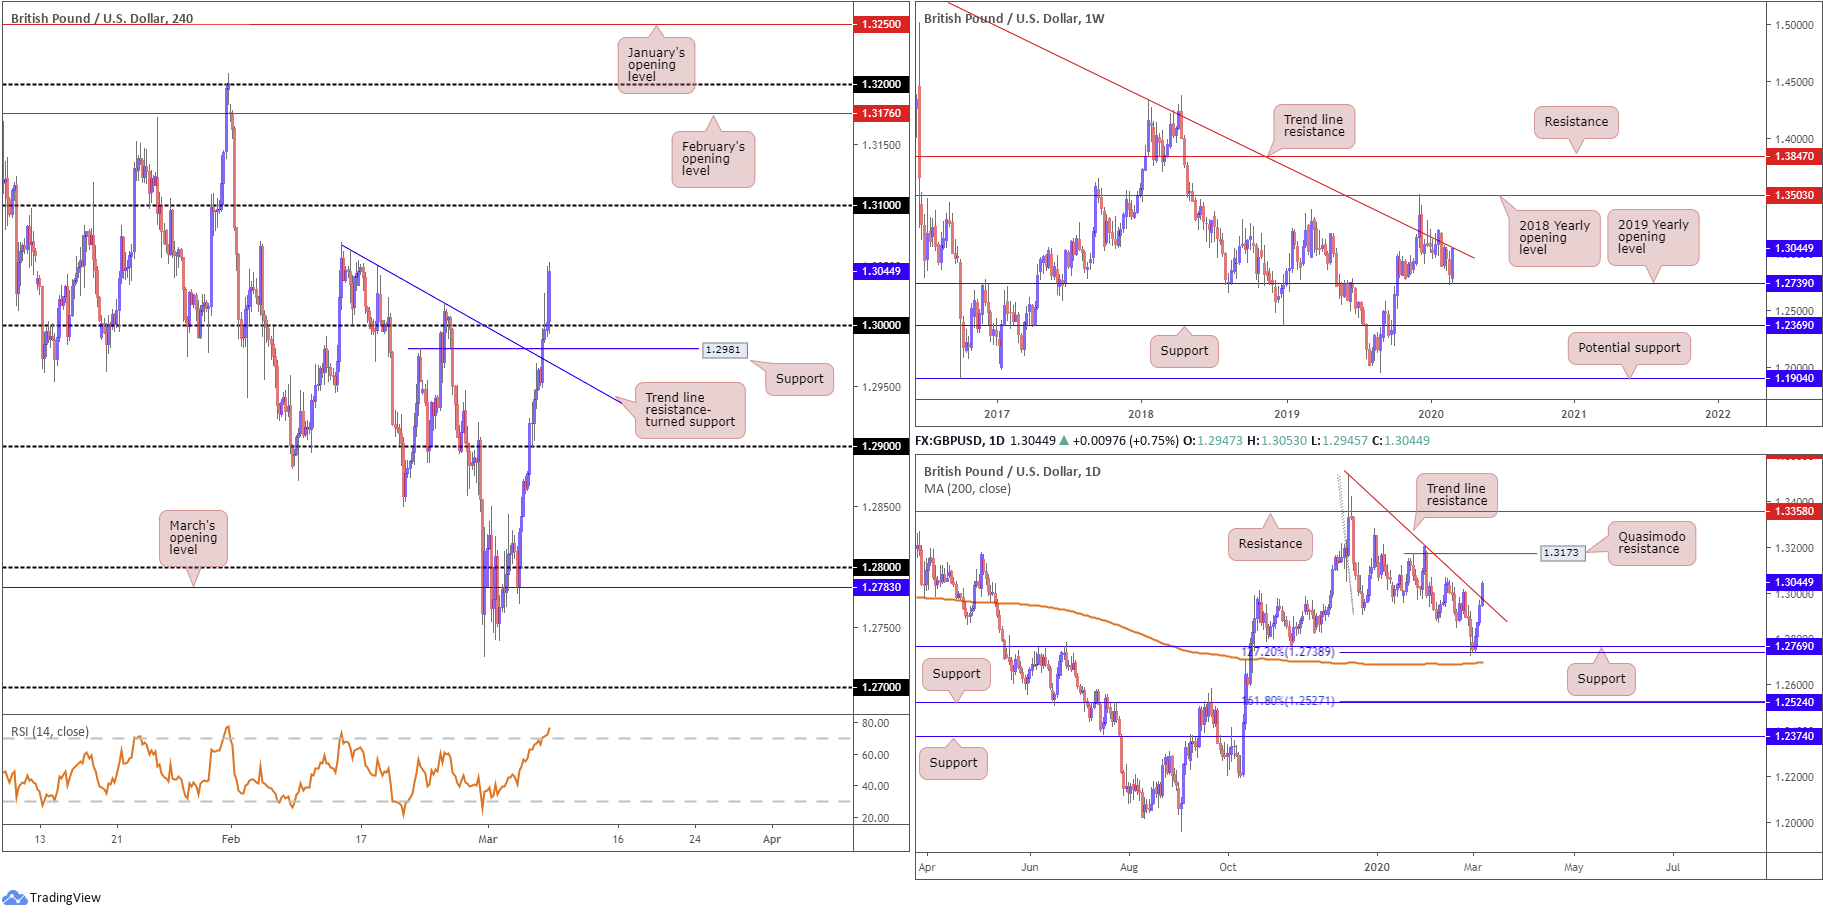
After a stronger-than-anticipated climb off the 2019 yearly opening level at 1.2739, gathering more than 230 points, the pair finds itself toying with long-standing trend line resistance, pencilled in from the high 1.5930.
A breach may ignite buy-stop liquidity, pushing for moves towards the 2018 yearly opening level at 1.3503. A rotation to the downside, however, and breach of current support, may side-line hopes of recovery and shine the spotlight on support from 1.2369.
Daily perspective:
Activity on the daily timeframe penetrated trend line resistance, extended from the high 1.3514, on Friday, closing a touch off its highs. This follows a muscular recovery off support at 1.2769 and a 127.2% Fibonacci extension at 1.2738, closely shadowed by the 200-day SMA. Note the said SMA has been flattening since mid-October 2019.
With sellers in a fragile state, the pound may look to get a foothold above the 1.3069 February 13th high this week and knock on the doors of Quasimodo resistance drawn from 1.3173.
H4 perspective:
The pound remained on the winning side of the table Friday, breaching trend line resistance, drawn from the high 1.3069, a Quasimodo resistance at 1.2981 (now a serving support) and the widely watched 1.30 figure. Additional upside has 1.3070ish to contend with as possible resistance, with a break pointing the finger to 1.31.
The relative strength index (RSI) wrapped up the week in overbought terrain.
The Bank of England signalled a coordinated approach to tackle the virus effect alongside the UK Treasury. In addition to this, mixed opinions on round 1 of the Brexit trade talks have not had much lasting impact on the market.
Areas of consideration:
The break of 1.30, coupled alongside daily price overthrowing trend line resistance, may excite buyers, with crosshairs perhaps fixed on 1.31. Yet, the problem is weekly price is stationed at the underside of a significant trend line resistance. This certainly places a question mark on long positions north of 1.30 this week, despite the pair’s healthy ascent.
Those interested in long entries above 1.30, be it at current price, or any retest seen, waiting for confirmation may be something to consider before pulling the trigger. This helps confirm buyer intent. Further, traders eyeing a retest play off 1.30 are urged to also pencil in the possibility of a fakeout materialising through 1.30 to H4 support at 1.2981.
AUD/USD:
Weekly gain/loss: +2.12%
Weekly close: 0.6645
Weekly perspective:
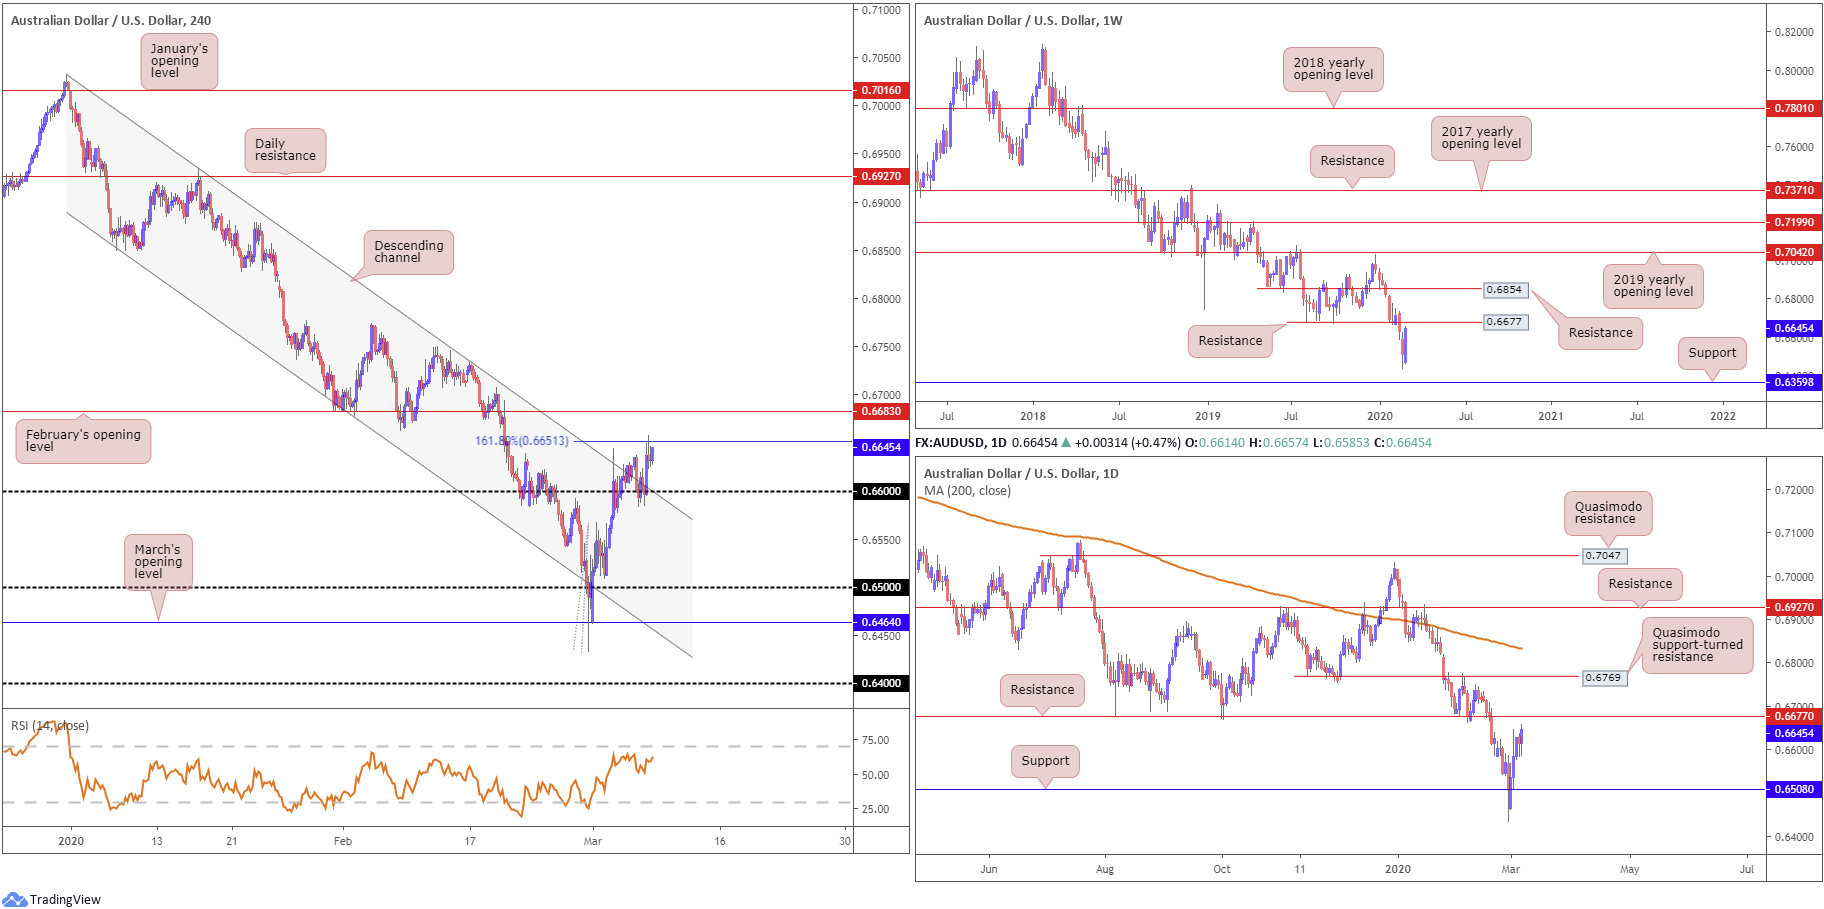
Formed by way of a healthy bullish engulfing candle off decade lows, the Australian dollar bettered the buck last week in strong fashion. Adding more than 130 points and closing not too far off weekly highs, resistance at 0.6677 lies in wait, with a break highlighting another layer of resistance at 0.6854. Support at 0.6359 also remains a level worthy of note, in the event we turn lower this week.
The primary trend has remained south since early 2018, despite recent movement.
Daily perspective:
Technical research on the daily timeframe, following a somewhat disorderly recovery off support at 0.6508, has weekly resistance mentioned above at 0.6677 in sight. Thursday and Friday’s sessions exhibited somewhat lacklustre ranges, struggling to get a foothold above Tuesday’s high 0.6645.
Though 0.6677 represents dominant resistance, a break shows room for extension to a Quasimodo support-turned resistance at 0.6769.
H4 perspective:
Less-than-stellar retail sales data out of Australia undermined AUD/USD in early hours Friday, but failed to extend much beyond the 0.66 handle.
Although scoring two-week highs at 0.6657, heading into US trade the pair entered into a consolidation phase, capped by a 161.8% Fibonacci extension at 0.6651. Upside found its legs largely on the dollar’s demise, though how much further the Aussie can rally is difficult to judge. Global equities remain on the back foot amid risk aversion, as the spotlight firmly focuses on coronavirus headlines.
Areas of consideration:
The 0.66 handle and H4 channel resistance-turned support, taken from the high 0.7031, offers support on the H4 this week, with a break of the 161.8% Fibonacci extension at 0.6651 possible, drawing attention to February’s opening level at 0.6683.The fact this level converges closely with weekly resistance at 0.6677 could be the line in the sand for this market.
Therefore, strong resistance between 0.6683/0.6677 could be in the offing this week.
USD/JPY:
Weekly gain/loss: -2.42%
Weekly close: 105.34
Weekly perspective:
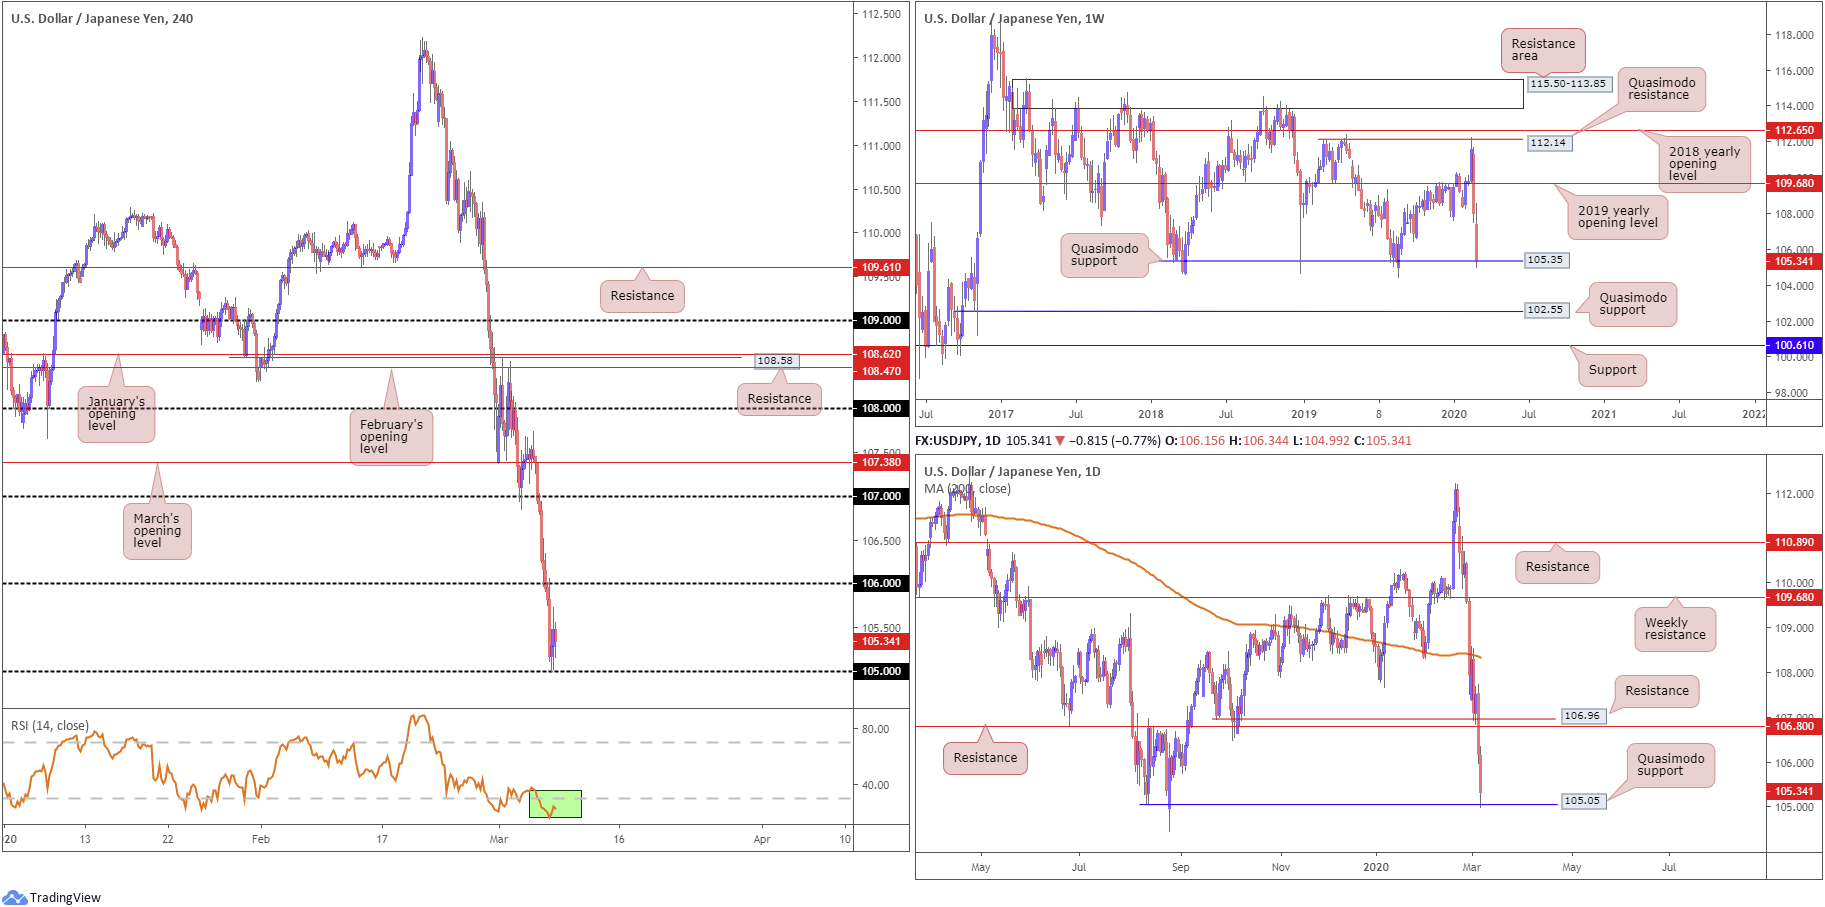
The week prior recorded its largest weekly drop since July 2016. Starved of support, USD/JPY continued to explore lower ground last week, erasing 250 points. Interestingly, though, familiar Quasimodo support at 105.35 welcomed the pair at the tail end of the session, a level that’s held price higher since early 2018.
While this level will likely attract hefty buyers, dipping its toe beneath the barrier could generate accelerated downside in this market, with limited support visible until another layer of Quasimodo support enters view at 102.55.
Daily perspective:
Daily price swarmed Quasimodo support at 106.96, and support at 106.80 Thursday, both now resembling possible resistance levels. Friday welcomed Quasimodo support at 105.05 into the mix, a level that boasts strong connections to the current weekly Quasimodo support at 105.35.
Aside the 104.44 August 26th low (2019), limited support is visible south of 105.05 until reaching the weekly Quasimodo support mentioned above at 102.55.
H4 perspective:
Despite optimistic US non-farm payrolls data, upside attempts were almost non-existent Friday. Yield on the 10-year US Treasury note fell to all-time lows of 0.7%, while global equities plunged as risk aversion clouded markets amid virus jitters.
Technically, we ended the week mildly paring losses off the back of 105, with the relative strength index (RSI) also seen fading bottoms off 15.00, deep within oversold territory. Beyond 105 this week, aside from the possibility of the 104.44 August 26th low (2019) offering support, the extreme low from the current daily Quasimodo support, the 104 handle is next in store on the H4 timeframe.
Areas of consideration:
105 recently entering the fold on the H4 timeframe, confirmed by the RSI, along with weekly Quasimodo support at 105.35 and daily Quasimodo support at 105.05, may stir buyers this week and revisit 106. Traders considering longs from this base likely have eyes on 104.44 as a possible location to site stops, though this may be too large for most to contend with. Other traders could opt to wait and see if the H4 prints a bullish candlestick signal before committing – think hammer candlestick pattern or a bullish engulfing formation.
USD/CAD:
Weekly gain/loss: +0.05%
Weekly close: 1.3420
Weekly perspective:
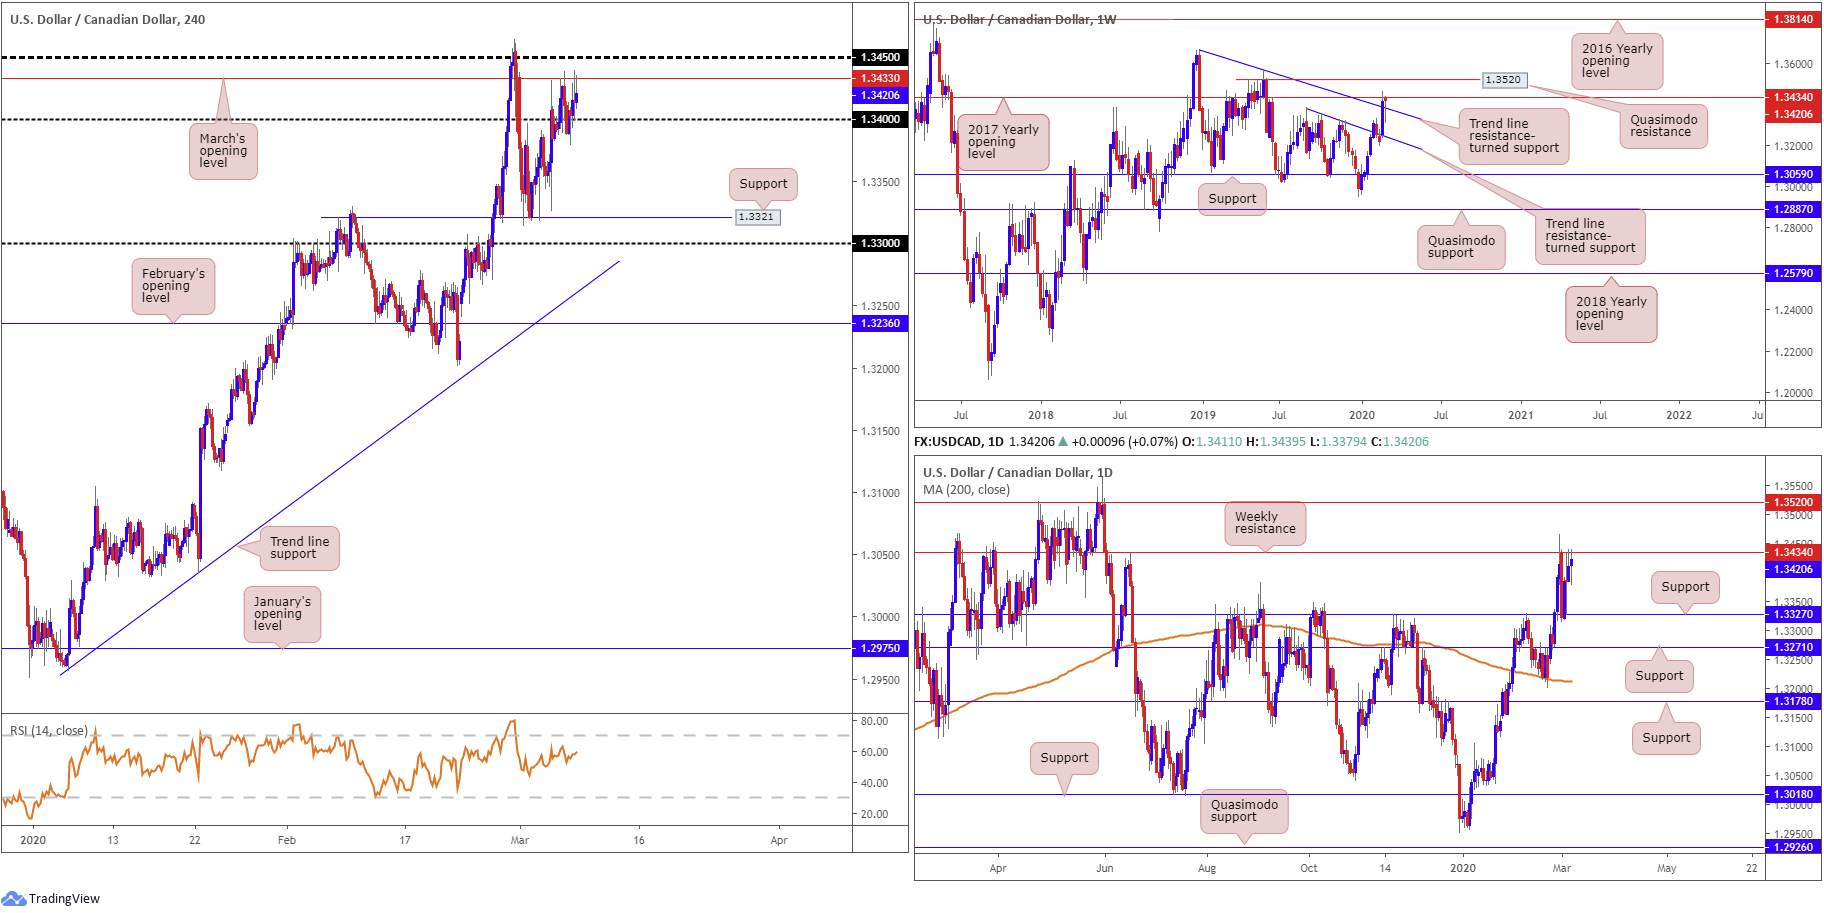
Weekly price has buyers and sellers squaring off between resistance at 1.3434, the 2017 yearly opening level, and trend line resistance-turned support, extended from the high 1.3664. As of current price, buyers appear to have the upper hand.
A break of the said resistance positions Quasimodo resistance at 1.3520 in the firing range this week, a level that’s likely to cap upside given the timeframe, prompting a possible retest at 1.3434.
Daily perspective:
By the same token, daily price has the current weekly resistance in play at 1.3434, while daily support resides around 1.3327. Note on this scale, price action finished the week chalking up a modestly attractive bullish outside day, signalling further upside could be on the horizon.
H4 perspective:
In recent sessions on the H4 timeframe, USD/CAD was relatively tame, settling between March’s opening level at 1.3433 and the 1.34 handle. Price disregarded USD selling, inching higher on the back of tumbling crude oil prices, testing waters below $42/bbl. Familiar resistance resides around 1.3450, whereas reclaiming 1.34 to the downside this week could see support at 1.3321 make another stand, stationed just ahead of 1.33.
It might also interest some traders to note the relative strength index (RSI) is seen hovering just south of overbought ground.
Areas of consideration:
Intraday, buy stop-liquidity is likely consumed above 1.34, perhaps encouraging moves beyond 1.3433 to 1.3450ish today/early week. 1.34, if retested as support, may deliver a platform for potential long opportunities.
Longer term, traders face weekly resistance at 1.3434, though price is simultaneously holding off trend line resistance-turned support.
The technical picture, particularly weekly flow, offers an indecisive tone right now, at least until we nudge through either trend line support or 1.3434. This may cause a bounce in either direction, defiling otherwise sound intraday setups.
USD/CHF:
Weekly gain/loss: -2.96%
Weekly close: 0.9369
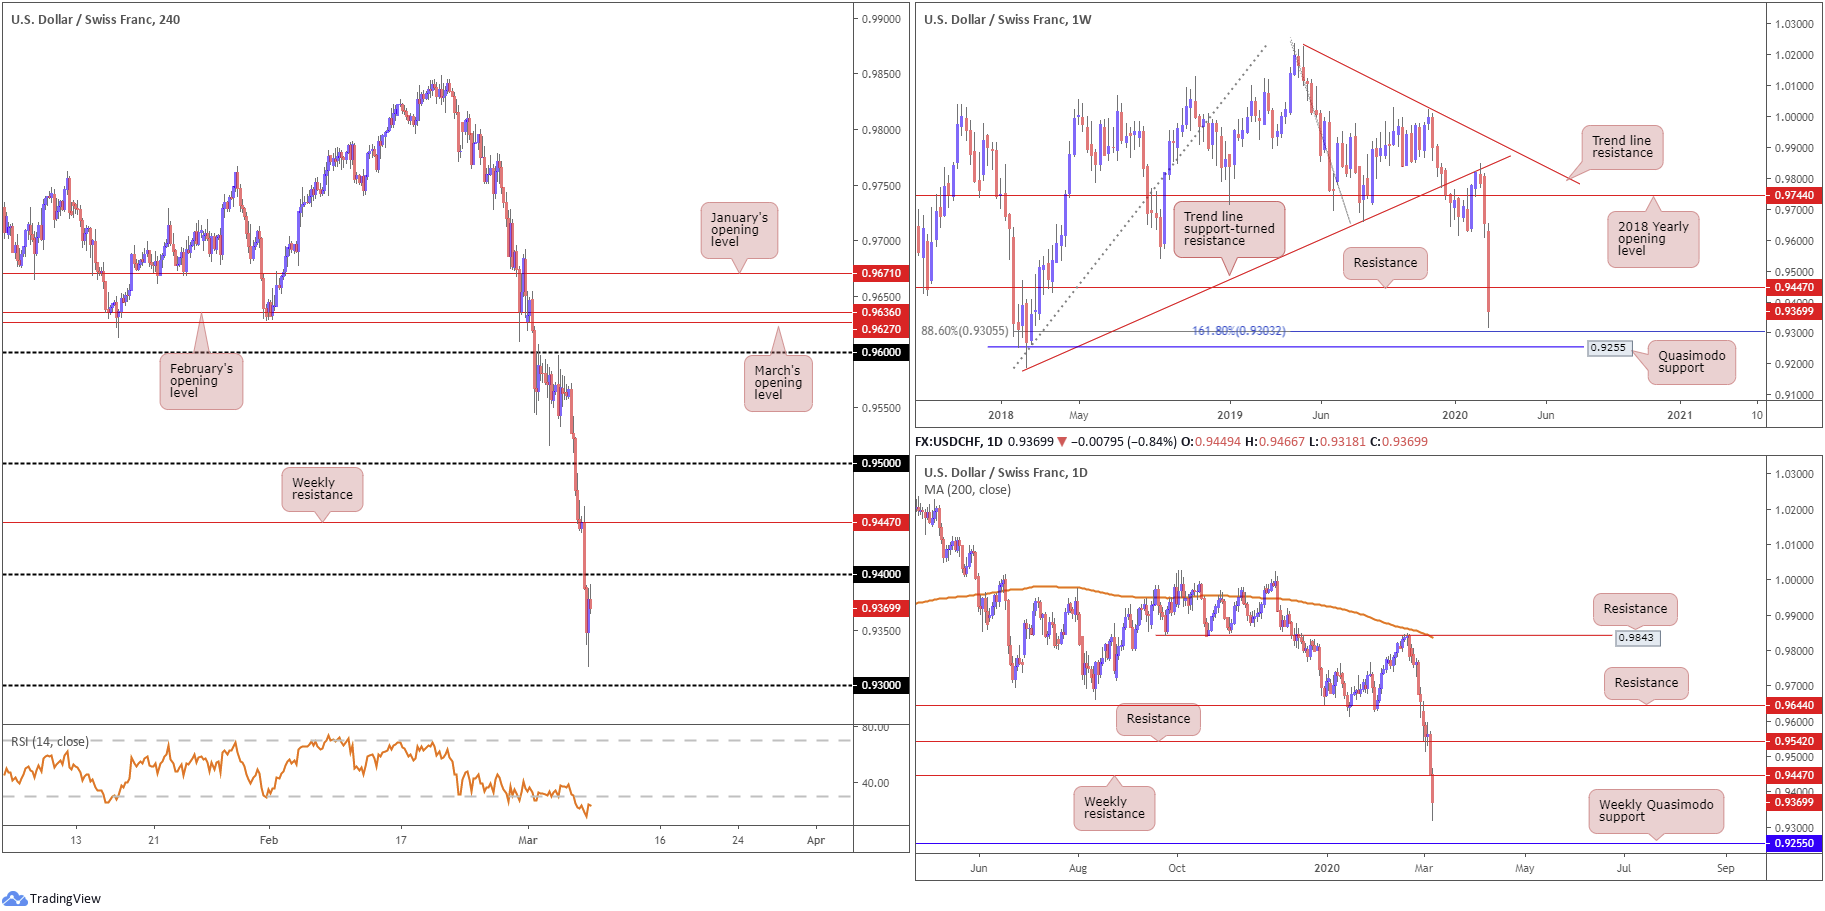
Weekly perspective:
Down a whopping 280 points, USD/CHF blew through weekly support at 0.9447 last week, now a serving resistance, and mildly bottomed at two-year lows just north of a 161.8% Fibonacci extension value at 0.9303 and 88.6% Fibonacci retracement at 0.9305. This, combined with a nearby Quasimodo formation at 0.9255, could hold and cause a retest of 0.9447 this week.
Daily perspective:
The daily timeframe offers a similar story to the weekly. Resistance is seen at 0.9447 this week, with support unlikely to enter view until reaching weekly Quasimodo support at 0.9255. However, traders must take into account the Fibonacci studies also highlighted on the weekly timeframe around 0.93ish, which may hinder downside.
H4 perspective:
Increased demand for the safe-haven Swiss franc, alongside precipitous declines in both US Treasury yields and the broad dollar index, guided prices beneath 0.94 to lows at 0.9318 on Friday. Better-than-expected US data failed to offer support, with the relative strength index (RSI) nosediving deep into oversold territory, nursing losses around 15.00.
0.94 represents resistance on this timeframe this week; breaking this threshold underlines weekly resistance mentioned above at 0.9447. Additional pressure this week, however, will likely draw in 0.93, which, interestingly aligns with the weekly timeframes Fibonacci studies.
Areas of consideration:
0.94 is likely on the watchlist for many today/early week, largely due to the higher timeframes suggesting scope for downside to at least 0.93.
While a solid downside target for the week, 0.93, despite positioned against the prevailing primary trend, is also worthy support, given its connection to the weekly timeframe.
Dow Jones Industrial Average:
Weekly gain/loss: +0.41%
Weekly close: 25801
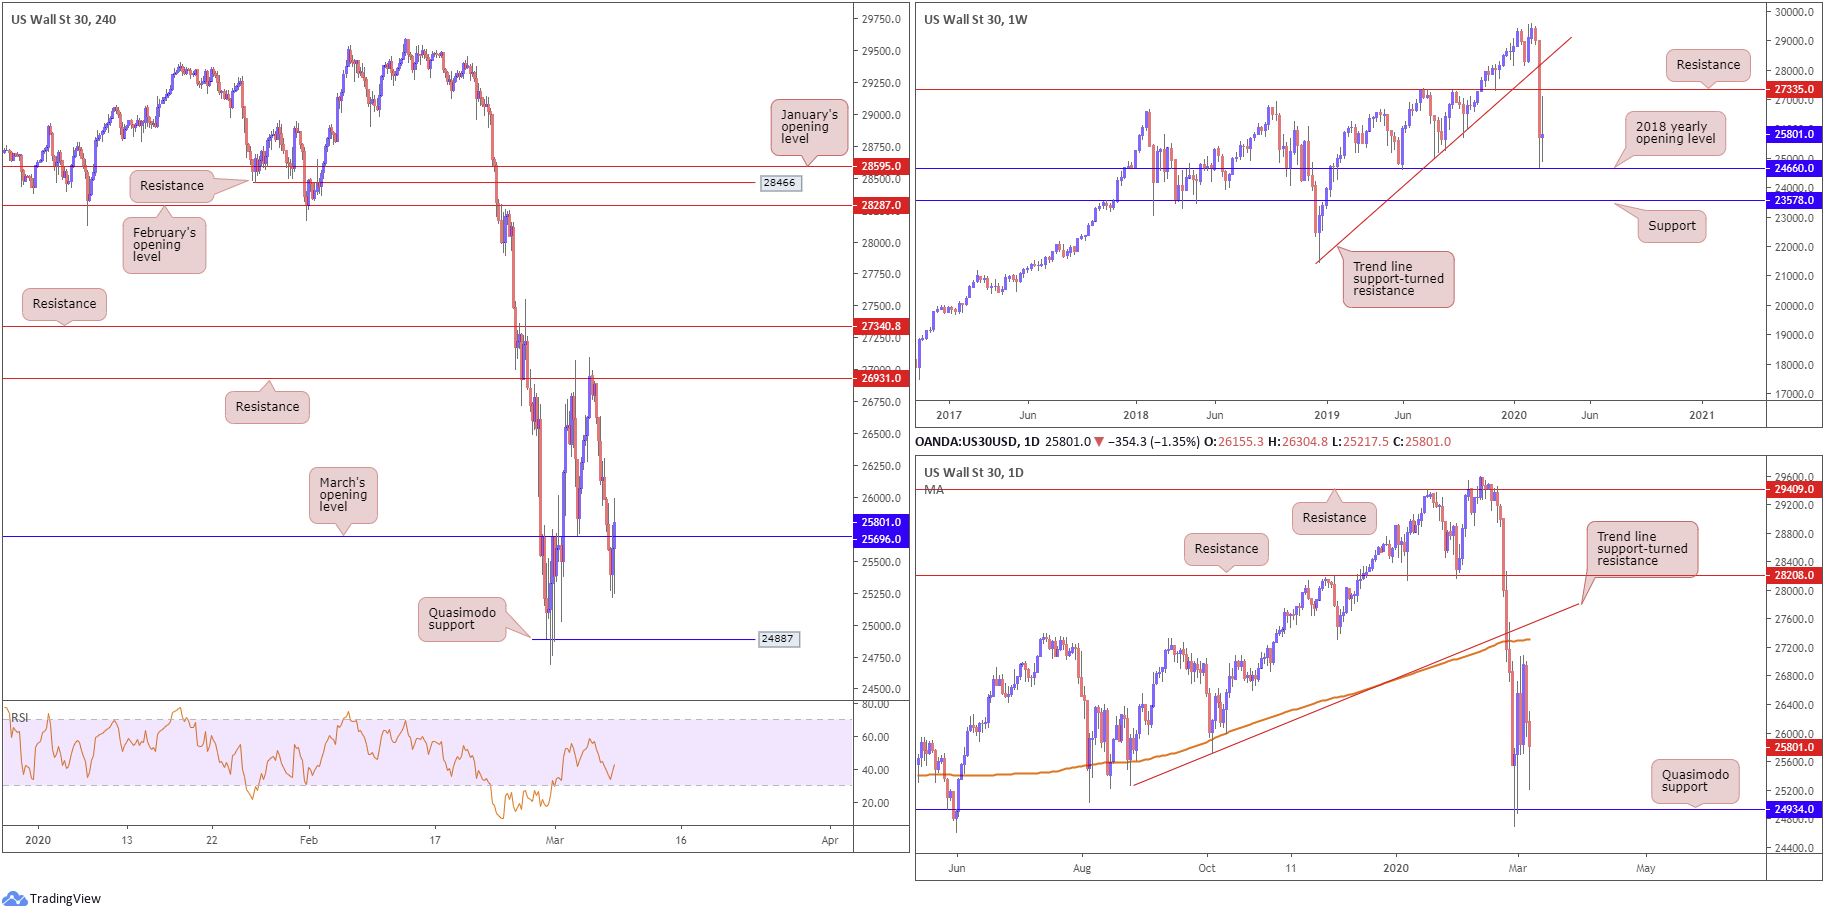
Weekly perspective:
Despite ranging more than 2200 points on the week, the session ended pretty much unchanged, formed in the shape of a long-legged doji indecision candle, albeit with a slight twist to the upside.
Resistance is in focus at 27335, while support, in the form of the 2018 yearly opening level, at 24660 is stationed nearby. Breaking current support could lead to 23578 entering play, whereas a breach beyond 27335 could see trend line support-turned resistance making an entrance, taken from the low 21452.
Daily perspective:
A closer reading of price action on the daily timeframe reveals the index topped a few points south of the 200-day SMA (orange – 27309) last week, closely followed by trend line support-turned resistance, drawn from the low 25264. Note we also have Quasimodo support at 24934 in motion, posted a few points north of the 2018 yearly opening level on the weekly timeframe at 24660.
H4 perspective:
Major US benchmarks concluded off their worst levels Friday, ending the week in modestly positive territory. The Dow Jones Industrial Average lost 256.50 points, or 0.98%; the S&P 500 also declined 51.57 points, or 1.71% and the tech-heavy Nasdaq 100 ended lower by 141.32 points, or 1.63%.
Technical movement on the H4 timeframe breached March’s opening level at 25696 in early Europe Friday, and scored a session low of 25217 heading into US hours. Despite a brief flicker of activity as resistance, the index wrapped up the week reclaiming 25696 to the upside. A bid for higher prices may emerge, assuming buyers defend 25696 as support, targeting resistance at 26931, followed by another port of resistance at 27340.
Failure to hold north of 25696, nonetheless, has Quasimodo support at 24887 to target.
Areas of consideration:
H4 resistance at 27340 is likely eyed as a potential ceiling this week. Not only does it boast strong history, the level converges closely with weekly resistance at 27335 and daily resistances, the 200-day SMA and the trend line support-turned resistance. In addition, buy-stop liquidity beyond H4 resistance at 26931 may entice selling off 27340.
With focus drawn to 27340, traders may also seek intraday bullish scenarios north of 25696.
XAU/USD (GOLD):
Weekly gain/loss: +5.54%
Weekly close: 1673.5
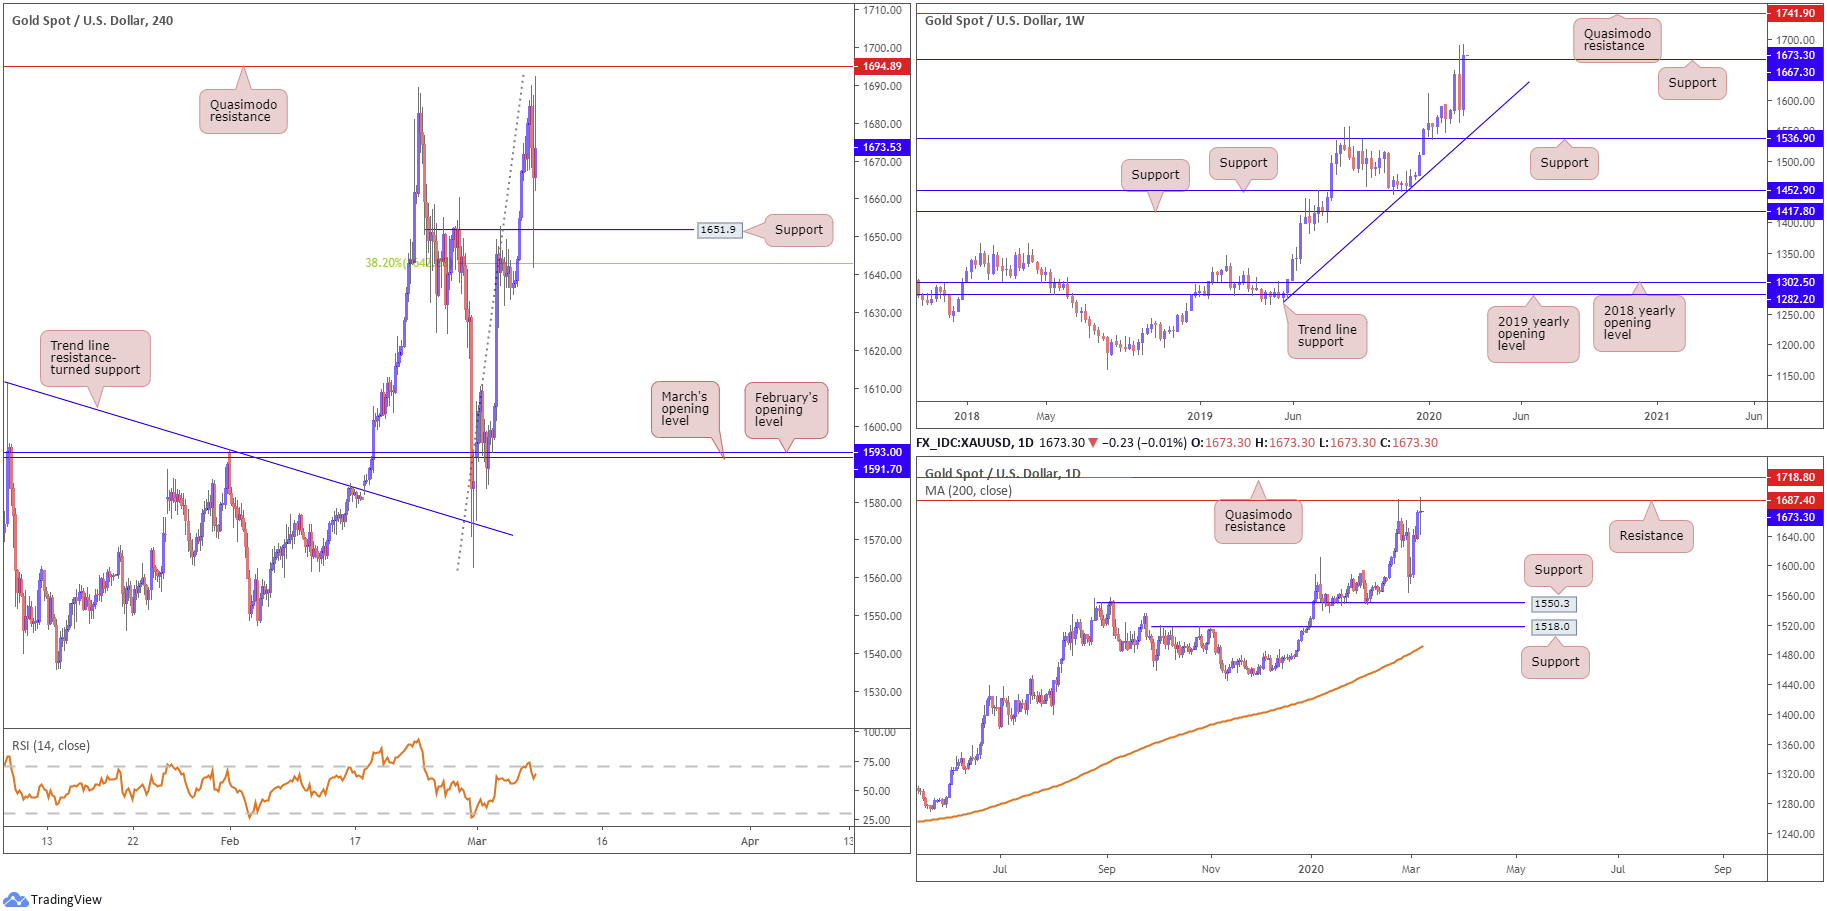
Weekly perspective:
A tumultuous week had Treasury yields collapse to all-time lows, driven by 50bps Fed rate cut bets, the US dollar index challenge levels beyond the 96.00 handle and gold’s strong outperformance, bid on safe-haven flow.
The spirited recovery hauled weekly price marginally above resistance at 1667.3, clocking highs at 1692.2, levels not seen since January 2013. Continued demand for bullion this week may welcome Quasimodo resistance at 1741.9 into the fight, though a retest at 1667.3 could occur beforehand.
Daily perspective:
Resistance on the daily timeframe at 1687.4 remains in play, with price fading the level in the shape of a long-legged doji indecision candle Friday. A close above the said level adds conviction to a run higher, targeting a Quasimodo resistance plotted at 1718.8.
H4 perspective:
Leaving Quasimodo resistance at 1694.9 unchallenged, shorter-term flow mildly retreated into the close Friday, surpassing support at 1651.9 and testing a 38.2% Fibonacci retracement ratio at 1643.2. Combined, these two supports contained downside.
While daily resistance at 1687.4, technically, could be the reason behind H4 Quasimodo resistance not yet entering play, the likelihood of this level making an appearance this week is high, based on recent momentum. A rotation lower, one that overwhelms current H4 supports, could lead to an approach forming to March and February’s opening levels at 1591.7 and 1593.0, respectively. In respect to the relative strength index (RSI) we’re seen trading modestly off overbought levels right now.
Areas of consideration:
Although we effectively cleared weekly resistance at 1667.3, the close was modest in terms of the candle’s position. As such, a pullback this week is not out of the question, particularly as daily resistance at 1687.4 remains in motion. A daily close north of 1687.4, as underlined above, adds conviction to the upside.
To take advantage of any downside in this market, traders may consider waiting for the current H4 supports to give way, consequently unlocking the door for bearish scenarios to around 1590ish.
The accuracy, completeness and timeliness of the information contained on this site cannot be guaranteed. IC Markets does not warranty, guarantee or make any representations, or assume any liability regarding financial results based on the use of the information in the site.
News, views, opinions, recommendations and other information obtained from sources outside of www.icmarkets.com.au, used in this site are believed to be reliable, but we cannot guarantee their accuracy or completeness. All such information is subject to change at any time without notice. IC Markets assumes no responsibility for the content of any linked site.
The fact that such links may exist does not indicate approval or endorsement of any material contained on any linked site. IC Markets is not liable for any harm caused by the transmission, through accessing the services or information on this site, of a computer virus, or other computer code or programming device that might be used to access, delete, damage, disable, disrupt or otherwise impede in any manner, the operation of the site or of any user’s software, hardware, data or property.


