
Key risk events today:
Limited.
EUR/USD:
Weekly gain/loss: +0.33%
Weekly close: 1.0976
Weekly perspective:
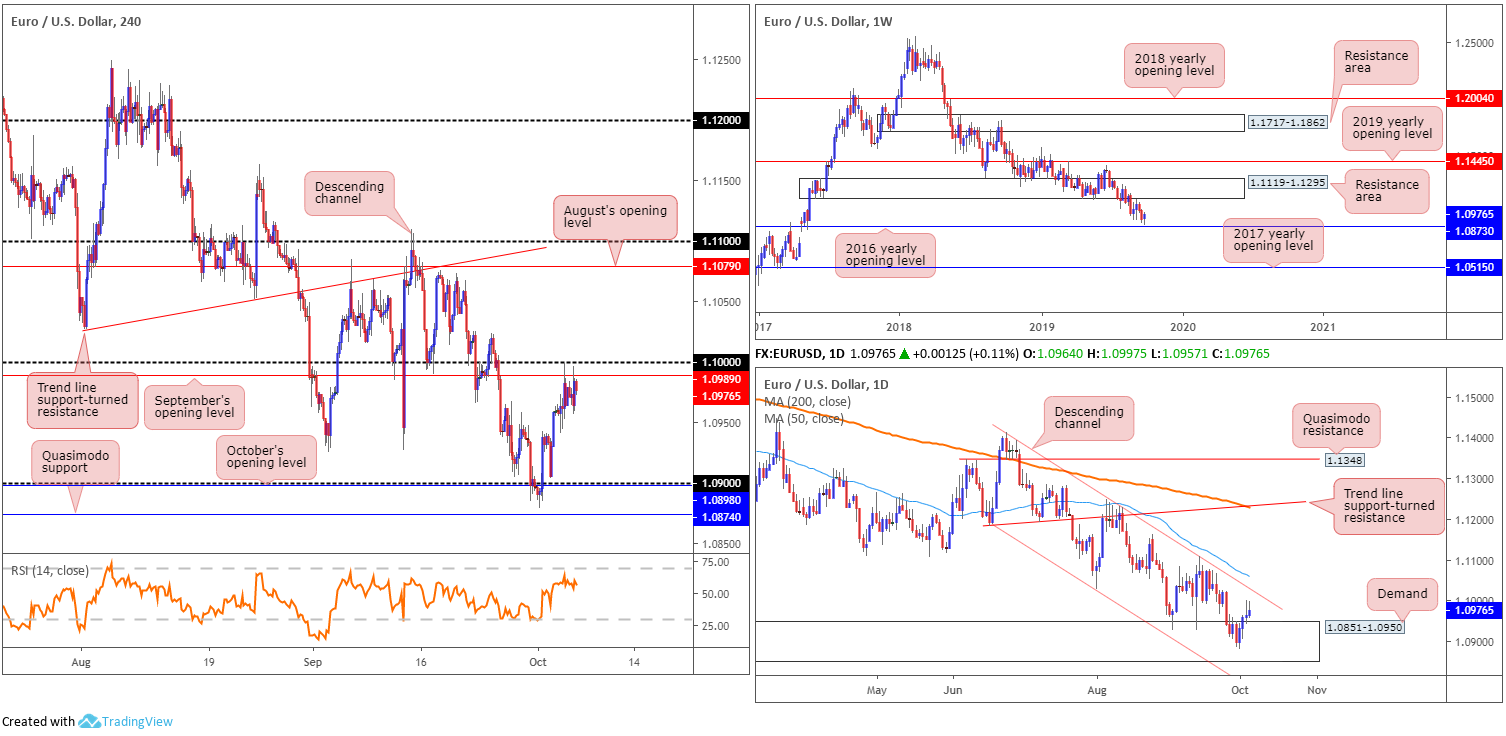
Europe’s shared currency staged a modest recovery against the buck last week, snapping a two-week bearish phase a few points ahead of the 2016 yearly opening level at 1.0873. Aiding the move was the US dollar index, or DXY, encountering notable weekly resistance coming in at 99.62 – boasts history as far back as mid-2015 – which held the dollar lower.
To the upside, the next area of resistance on the EUR/USD falls within 1.1119-1.1295. Concerning trend direction, however, since topping in early 2018 at 1.2555, the long-term trend remains facing a southerly bearing.
Daily perspective:
Daily action found itself back within the parapets of demand at 1.0851-1.0950 last week – formed April 2017 and houses the 2016 yearly opening level inside its lower bounds. Buyers began strengthening their grip as early as Tuesday, with channel resistance (extended from the high 1.1412) positioned as the next viable upside target on this scale, closely shadowed by the 50-day SMA (blue – 1.1060).
Traders may also wish to acknowledge price has been compressing within a descending channel formation since late June (1.1412/1.1026).
H4 perspective:
Friday had the euro a shade higher vs. the dollar, extending Tuesday’s recovery off 1.09. Despite this, chart studies indicate the key figure 1.10 remains in motion as resistance, alongside September’s opening level at 1.0989. Beyond 1.10, tops are visible around 1.1070, followed closely by August’s opening level at 1.1079 and then the 1.11 handle. To the downside, nonetheless, limited support is visible until revisiting 1.09, which now happens to merge closely with October’s opening level at 1.0898.
On the data front, the unemployment rate declined to 3.5% in September, total non-farm payroll employment rose by 136,000 and average hourly earnings ticked lower to 0.0%, the US Bureau of Labour Statistics reported Friday. It appears the unemployment rate clocking its lowest level in five decades helped limit losses in the dollar.
Areas of consideration:
Longer term, research points to further buying, particularly on the weekly timeframe. The first area of concern, however, falls in reasonably close by at the daily channel resistance mentioned above (1.1412). Therefore, longer-term positions may want to be approached cautiously.
Medium-term analysis (H4), nevertheless, reveals entry long at this point to be problematic until the H4 candles decisively engulf 1.10 to the upside, as noted in Friday’s technical briefing. Should this occur, a run to August’s opening level at 1.1079 may be on the cards. Before reaching this far north, though, do remain cognisant of the said daily channel resistance possibly holding price action lower. Upon witnessing a H4 close above 1.10, possible entry points can be found either on the close of the breakout candle (with stop-loss orders positioned beneath its lower shadow), or a retest at the top edge of the figure (likely eyed by conservative traders – entry and risk can be determined according to the rejection candle’s structure).
GBP/USD:
Weekly gain/loss: +0.38%
Weekly close: 1.2330
Weekly perspective:
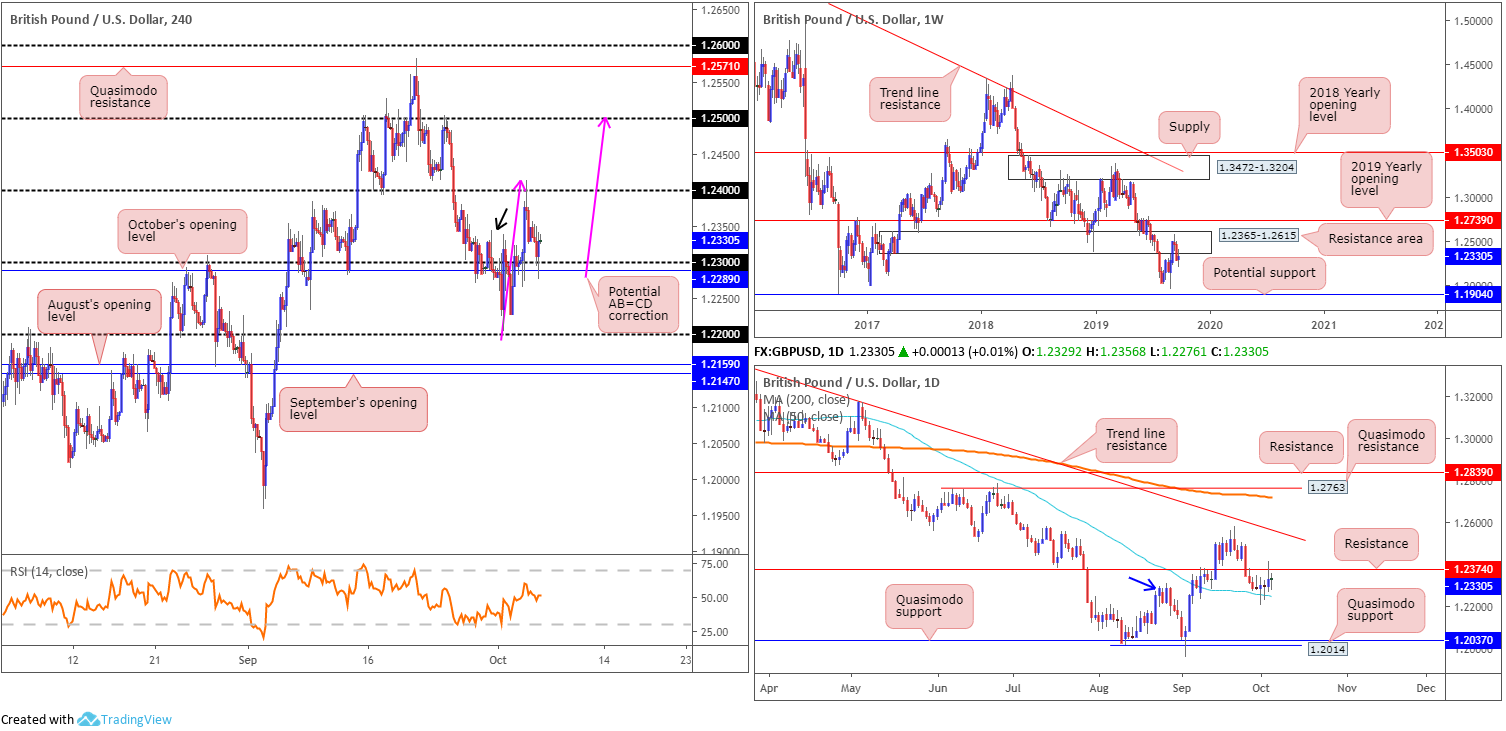
The long-term resistance area coming in at 1.2365-1.2615 remains a dominant structure on the weekly timeframe, currently plugging upside. Assuming further downside is seen, the 1.1958 September 2 low and 1.1904 – held price action strongly higher in October 2016 – are the next supports in the firing range.
The overall trend has faced a southerly trajectory since April 2018, with a break of 1.1904 confirming the larger downward trend that began mid-2014.
Daily perspective:
A closer reading on the daily timeframe shows price action recently entered a consolidative phase between resistance plotted at 1.2374 and the 50-day SMA (blue – 1.2248). Outside of this range, areas of interest fall in at a trend line resistance (extended from the high 1.3380) and two layers of Quasimodo support at 1.2014 and 1.2037.
According to basic market structure, the high 1.2309 (blue arrow) was engulfed early September, potentially motioning the beginning of a strong recovery. The current consolidation could be a bottoming phase.
H4 perspective:
Sterling concluded Friday unmoved against the US dollar, though a touch lower against the euro as Brexit concerns kept pressure on the pound. Technically, the candles are retesting 1.23/October’s opening level at 1.2289, following Thursday’s run to highs at 1.2413.
Similar to the daily timeframe’s analysis, H4 movement also overthrew a (minor) high point at 1.2345 (black arrow) before shaking hands with 1.24. This may imply a continuation move off 1.23 could be in store back to 1.24 and possibly beyond to 1.25, completing an AB=CD correction move (pink arrows).
Areas of consideration:
In essence, the market has weekly price trading out of a resistance area, albeit making limited progress last week, and both H4 and daily timeframes showing promise to the upside.
Entering long based on H4 price rebounding from 1.23 is a chancy setup, given daily resistance lurking close by at 1.2374, followed closely by 1.24 on the H4 timeframe. Therefore, a H4 close above 1.24 this week will likely unbolt the door for bullish scenarios to 1.25, closely trailed by the daily trend line resistance mentioned above (1.3380).
In the event the above analysis is incorrect and the market turns lower and reclaims 1.23, then shorts are an option back to the 50-day SMA (1.2248) and possibly 1.22.
AUD/USD:
Weekly gain/loss: +0.10%
Weekly close: 0.6768
Weekly perspective:
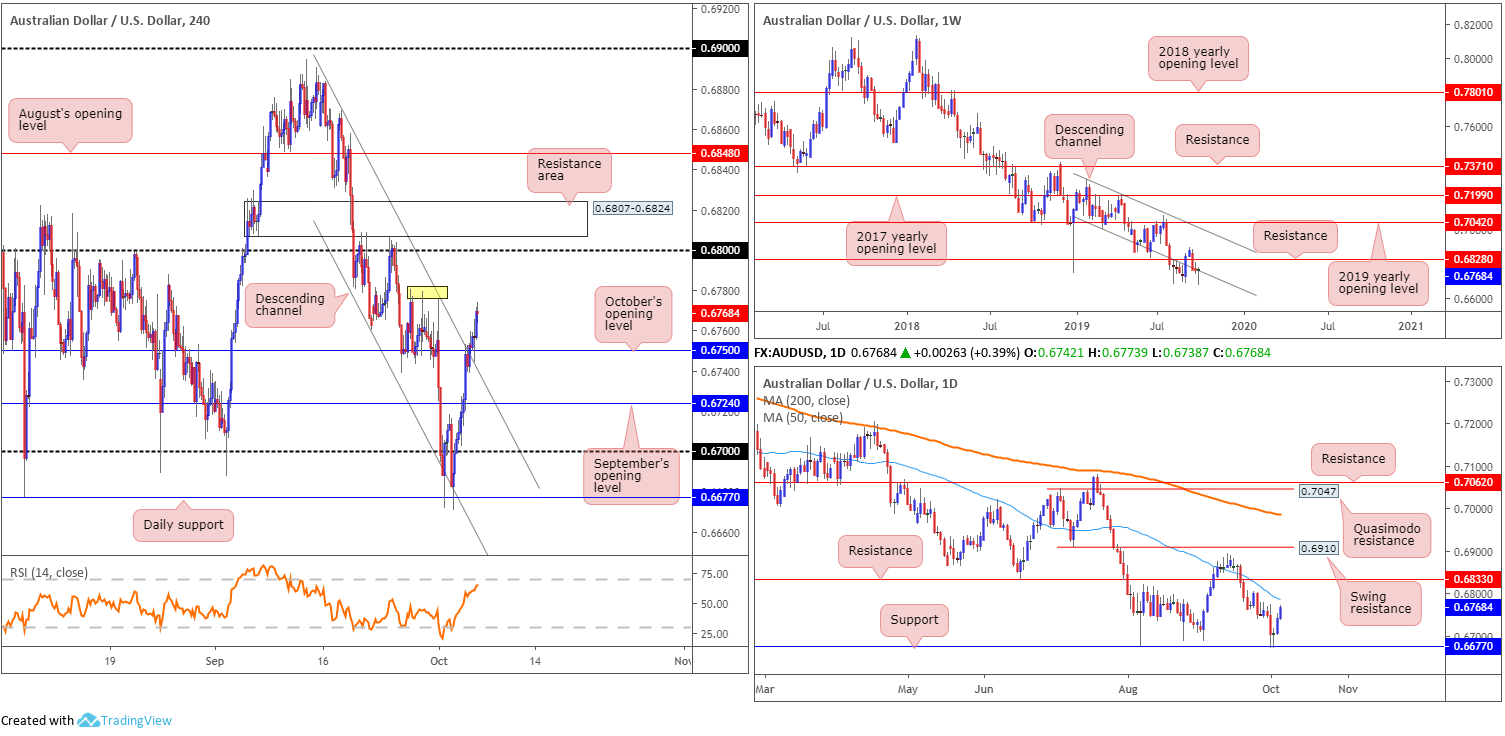
Technical action on the weekly timeframe had price attempt to take hold of its channel support (taken from the low 0.7003) in recent trade, concluding in the shape of a hammer candlestick pattern (considered a bullish signal). If successful, this may lead to a move towards resistance at 0.6828.
As is clear on this scale, however, the long-term downtrend remains in full swing, and has done since early 2018. If the aforementioned channel support fails to hold, the next base of support does not emerge until 0.6359 (not visible on the screen).
Daily perspective:
The key observation on the daily timeframe is support at 0.6677. Nearby resistance resides close by in the form of a 50-day SMA (blue – 0.6786), followed by resistance pencilled in at 0.6833.
H4 perspective:
Mixed US employment figures failed to incite much USD demand Friday, consequently lifting the Australian dollar to higher ground. What’s more, latest headlines surrounding the US/China trade conflict provided additional support for the commodity-linked currency. US NEC Director Kudlow stated his trade team are going into the China talks with an open-mind, and said there could be positive surprises from the talks.
Technically, AUD/USD movement dethroned both October’s opening level at 0.6750 and channel resistance extended from the high 0.6883. This potentially sets the stage for a run to tops around 0.6778 (yellow), followed by a possible approach to 0.68 and nearby resistance area at 0.6807-0.6824.
Areas of consideration:
All three timeframes exhibit scope to explore higher ground this week. For traders who read Friday’s technical briefing you may recall the following:
A decisive H4 close beyond the noted channel resistance possibly confirms further upside might be in store. And with both weekly and daily structure emphasising a somewhat bullish notion, the H4 candles could reach 0.68.
Entry on the close of the H4 breakout candle is an idea, with a protective stop-loss order beneath its lower shadow. Alternatively, a retest motion could be an option, basing entry and risk levels on the back of the rejecting candle’s structure. Irrespective of the entry method, traders are urged to consider risk/reward before pulling the trigger, ensuring at least a 1:2 ratio exists.
Entering on the breakout candle proved fruitful, as did the retest motion. The next upside targets can be found above in bold.
USD/JPY:
Weekly gain/loss: -0.96%
Weekly close: 106.90
Weekly perspective:
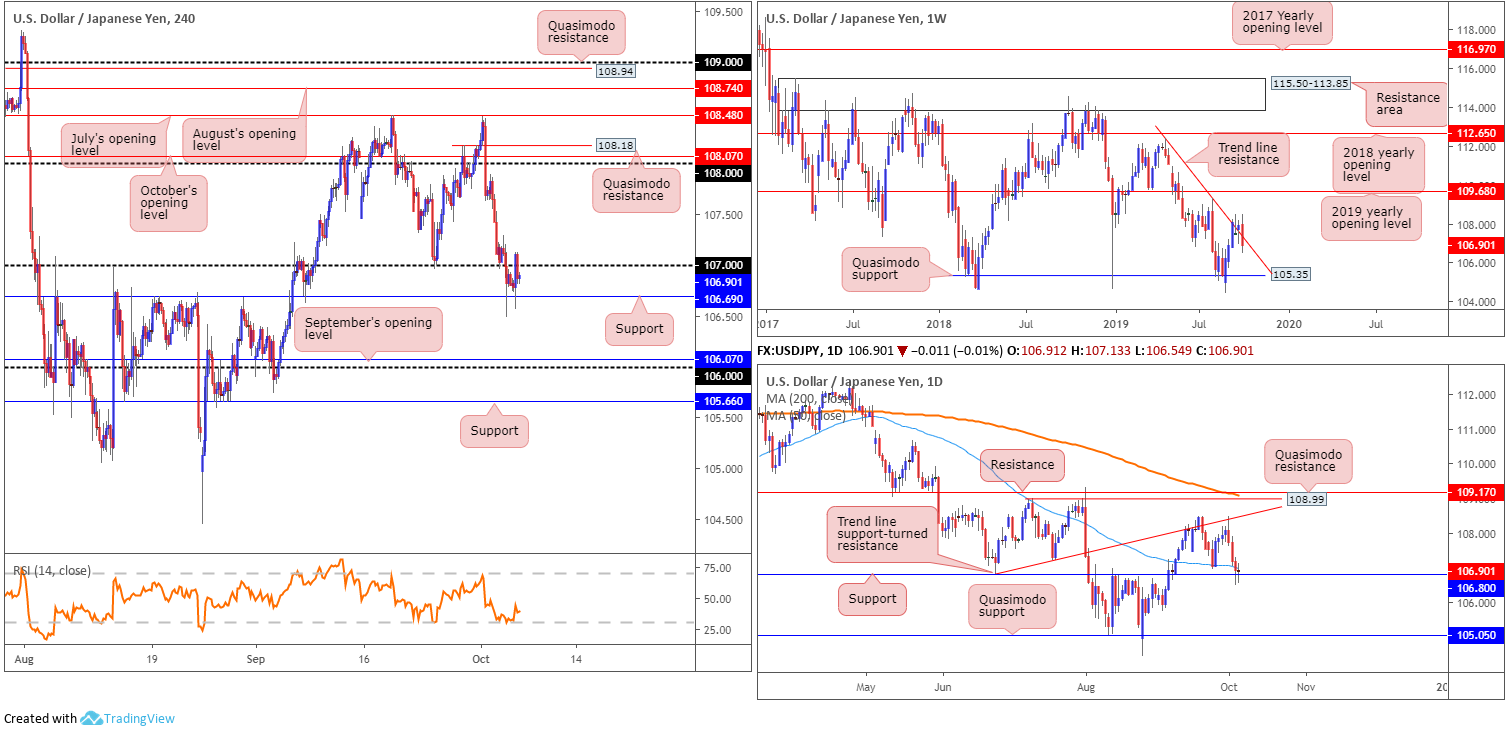
USD/JPY activity witnessed a sharp change in mood last week, engulfing the prior week’s range and establishing a clear-cut bearish outside pattern. Focus on the weekly timeframe has now shifted to the possibility of additional selling after reclaiming trend line resistance taken from the high 112.40, targeting familiar Quasimodo support at 105.35.
The recent move likely caught many traders unaware, particularly those attempting to long the breakout of the said trend line resistance.
Daily perspective:
Following a somewhat dominant selloff from the underside of a trend line support-turned resistance (taken from the low 106.78), Thursday’s candle crossed paths with notable support priced in at 106.80 and the nearby 50-SMA (blue – 106.97). Friday’s session did little to turn the dial, producing a Doji indecision candle. Continued selling this week could overthrow the current support and perhaps approach Quasimodo support at 105.05, sited 30 points south of the weekly Quasimodo.
H4 perspective:
Immediately following Friday’s mixed US employment release, USD/JPY jumped to 107.11. While likely sufficient to trip buy stops above the 107 handle, the unit failed to sustain gains and elbowed its way back beneath the psychological mark into the close.
In terms of structure to keep an eye on this week, we have nearby support at 106.69, followed by September’s opening level at 106.07 and 106. Beyond 107, however, traders’ crosshairs are likely fixed on the 108 neighbourhood, which happens to intersect closely with October’s opening level at 108.07 and a Quasimodo resistance at 108.18.
Areas of consideration:
In order to confirm seller intent from the weekly outside candle formation, a daily close below daily support at 106.80 would be a good start. A H4 close beneath H4 support at 106.69, though, would be even better, likely clearing the pathway to the 106 region. Entry (sell)/stops set on the back of the breakout candle is an idea; others, nevertheless, may prefer to witness a retest at 106.69 and set entry/stop levels based on the rejection candle’s framework.
Should the unit probe higher and retake 107, however, traders may view this as daily buyers strengthening their grip on support at 106.80 for a push to 108 on the H4. Given this entails entering long against weekly flow, waiting for a retest at 107 to form, preferably by way of a H4 bullish candlestick signal, is certainly worth considering.
USD/CAD:
Weekly gain/loss: +0.53%
Weekly close: 1.3306
Weekly perspective:
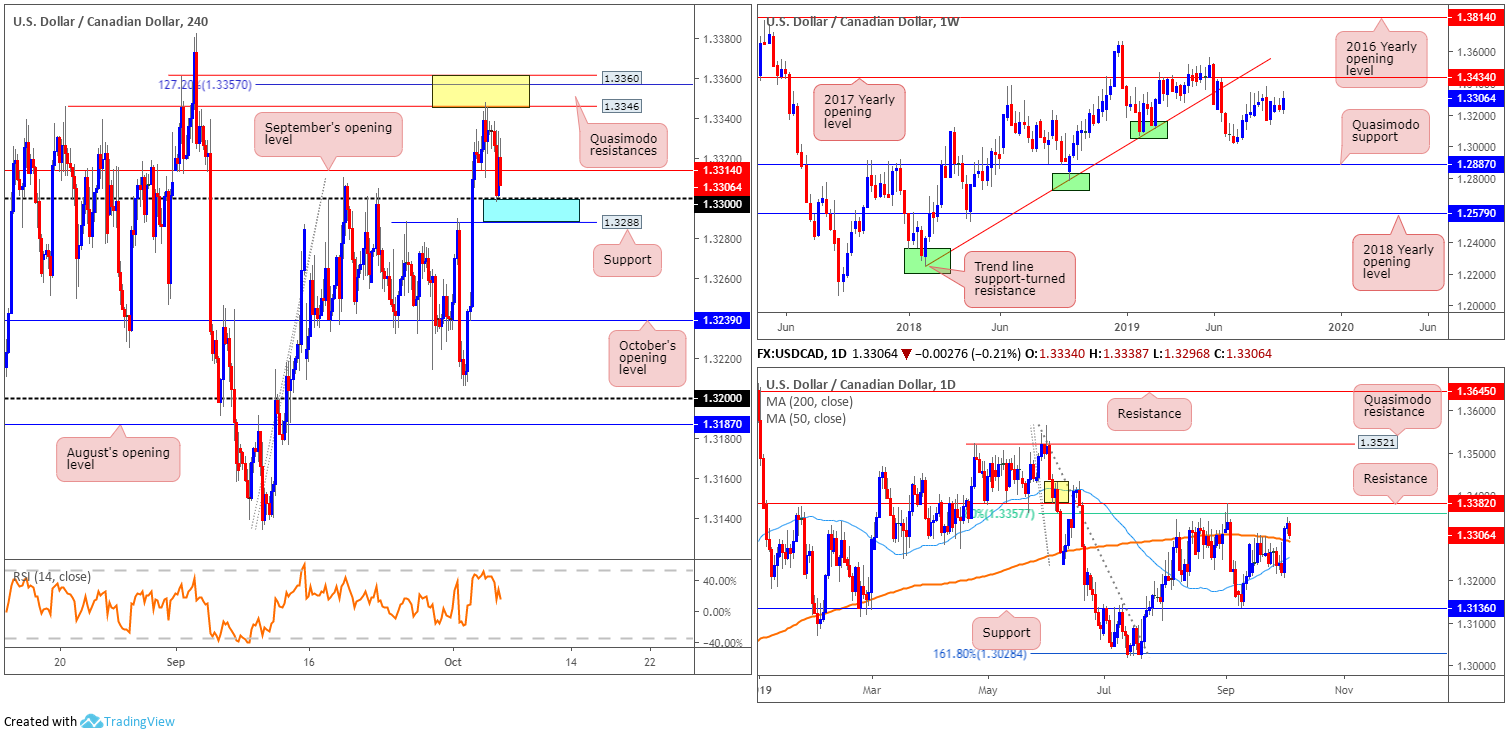
USD/CAD movement witnessed an expansion in volatility last week, overwhelming two weeks’ worth of trading in the shape of a bullish outside pattern. Considered a reasonably strong buy signal, resistance at the 2017 yearly opening level drawn from 1.3434, closely lagged by trend line support-turned resistance extended from the low 1.2247, may enter the mix sometime this week.
Daily perspective:
Wednesday saw the unit overpower its 200-day SMA (orange – 1.3292), extend to weekly highs at 1.3347 and finish reclaiming a portion of the move Friday. A retest of the said SMA is feasible this week, which appears to be enticing the 50-day SMA (blue – 1.3254) closer to its value for a possible crossover. A run to resistance plotted at 1.3382 is also feasible this week, sited just north of a 61.8% Fibonacci ratio at 1.3357.
Bolstering resistance is a supply zone (yellow) between 1.3430-1.3381, with a break of this zone likely foretelling a move to Quasimodo resistance at 1.3521.
H4 perspective:
Mixed US employment figures, coupled with Statistics Canada announcing the trade deficit narrowing from $1.4 billion in July to $955 million in August, saw the USD/CAD pop to a high of 1.3316, and shortly after revisit 1.33 to find support.
Medium-term analysis has two layers of Quasimodo resistance 1.3360/1.3346 (yellow) in sight, which held price action lower Thursday. Additionally, the 127.2% Fibonacci extension point is housed within at 1.3357 as is the 61.8% daily Fibonacci ratio at 1.3357. To the downside, aside from 1.33, September’s opening level at 1.3314 is also in view, though currently a touch above price action, resembling resistance. We also have possible support emerging from a prior double-top formation at 1.3288.
Areas of consideration:
Weekly candlestick action suggests further buying could be on the menu this week, therefore a retest at the 200-day SMA could be something to keep an eye on for possible long opportunities. Interestingly, the moving average coincides with an area of H4 support (blue) between 1.3288/1.33, therefore resembling a potential reversal zone buyers may look to work from.
As 1.3288/1.33 consists of a 12-point range, the probability of a fakeout beyond its limits is increased. As such, waiting for H4 price to confirm buyer intent out of the zone is recommended. A H4 hammer candlestick formation, for example, not only identifies buyer intent, it also provides strict entry and risk levels to work with. The first profit target can be set at 1.3288/1.33.
USD/CHF:
Weekly gain/loss: +0.46%
Weekly close: 0.9951
Weekly perspective:
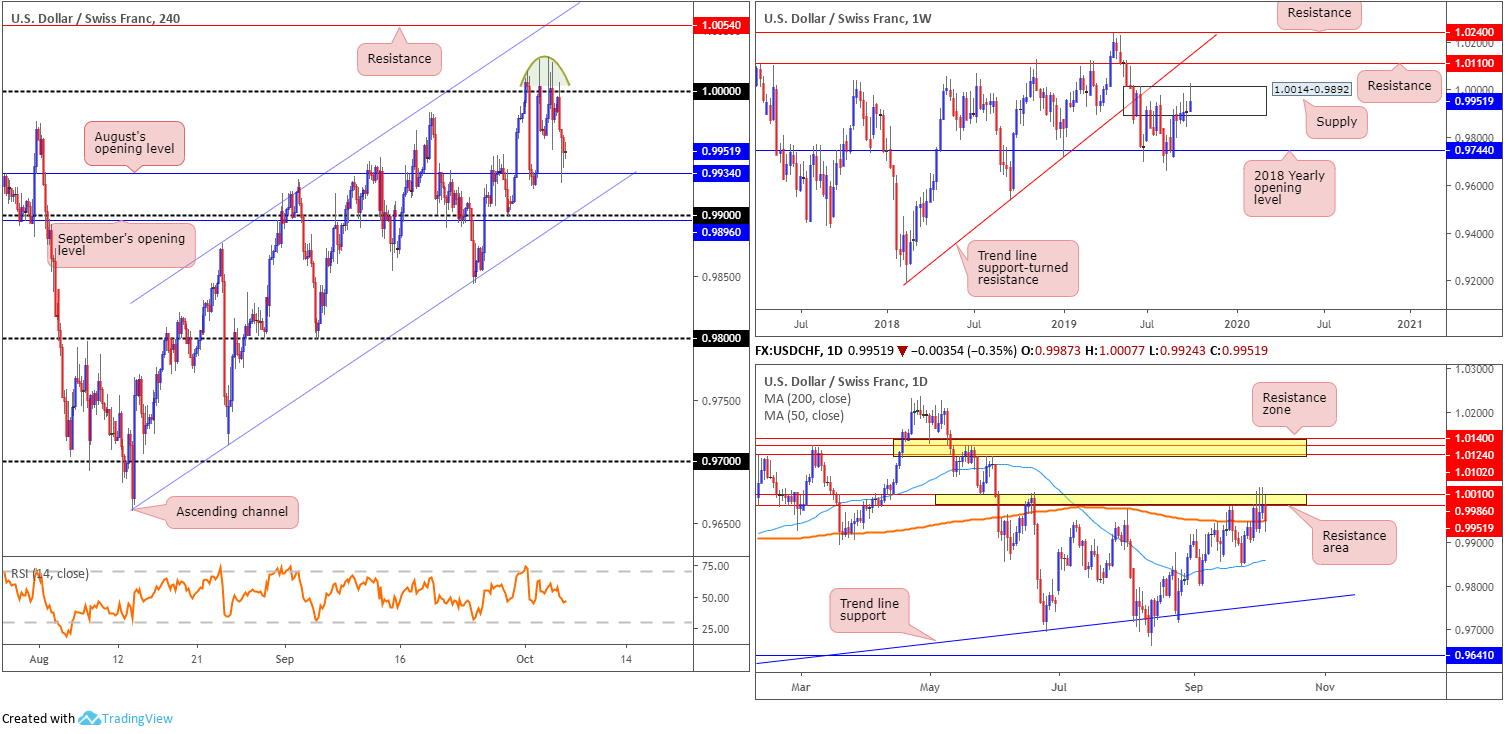
Longer-term flow, as you can see, had the weekly candle clip the top edge of supply at 1.0014-0.9892 last week. While the recent move to multi-month peaks at 1.0027 possibly tripped some buy stops, interest from the sell side of the market clearly remains. In the event of a push higher this week, however, traders are urged to note resistance coming in at 1.0110, with a break of this barrier exposing trend line support-turned resistance (etched from the low 0.9187). If downside persists, the 2018 yearly opening level at 0.9744 is marked as the next support base.
Daily perspective:
Closer analysis of price action on the daily timeframe has the candles defending a narrow resistance zone at 1.0010/0.9986. Interestingly, price action also remains sited just north of the 200-day SMA (orange – 0.9949). A break higher this week exposes another resistance zone at 1.0140/1.0102, whereas elbowing beneath the 200-day SMA may lead to the 50-day SMA entering the fold (blue – 0.9859).
H4 perspective:
Since the beginning of the week, the underside of 1.0000 (parity) has been under attack. Buy stops above the number were likely tripped, triggering pain on both sides of the market: those attempting to fade the level and those bidding the breakout. All in all, though, the H4 candles formed a minor rounded topping formation (green) and once more found support at 0.9934: August’s opening level.
Beyond the said support, September’s opening level at 0.9896 is in view, closely coupled with the 0.99 handle and a channel support extended from the low 0.9659.
Areas of consideration:
Three potential scenarios could play out this week:
- Should H4 price remain rangebound between 1.0000/0.9934, range traders may look to buy/sell these limits.
- A break beneath 0.99 takes hold, perhaps unlocking the door to the 0.9843 September 24 low and 0.98 handle. Remember, we also have the 50-day SMA at 0.9859 to contend with.
- Overthrowing 1.0000 indicates buyer intent to at least H4 resistance at 1.0054, though this entails entering long within the upper range of both a daily resistance area at 1.0010/0.9986 and a weekly supply at 1.0014-0.9892.
Dow Jones Industrial Average:
Weekly gain/loss: -1.19%
Weekly close: 26523
Weekly perspective:
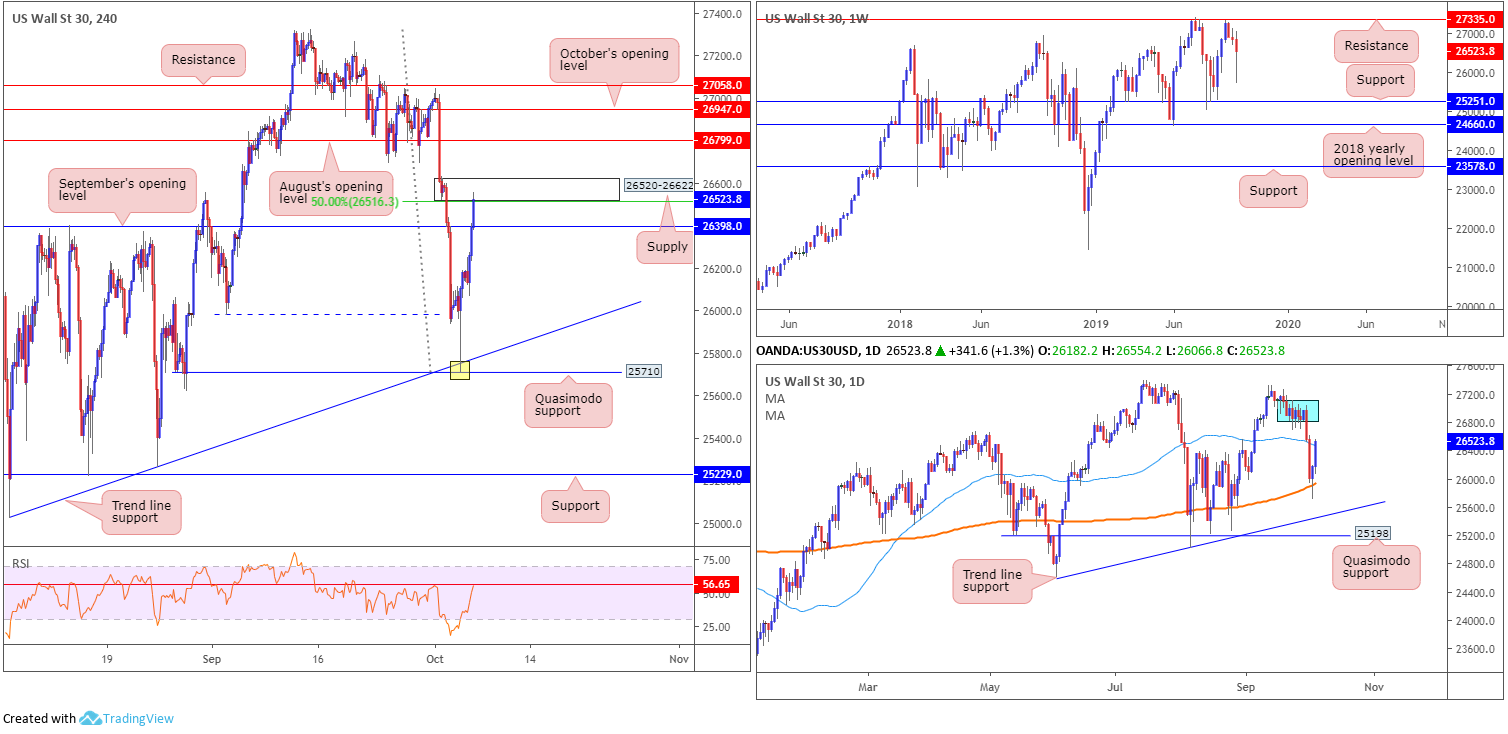
Despite ranging more than 1,300 points last week, the index settled lower, down 320 points, or 1.19%. Resistance on this timeframe is evident around the 27335 point, a touch lower than the all-time high 27388, whereas support can be seen at the 25251 region, shadowed closely by the 2018 yearly opening level at 24660.
Daily perspective:
The market witnessed daily activity rebound from its 200-day SMA (orange – 25932) Thursday, and extend gains Friday, consequently engulfing the 50-day SMA (blue – 26469). Overhead, supply is evident between 27110-26813 (blue), which could hold price action lower this week (positioned just south of the weekly resistance at 27335).
H4 perspective:
US equities firmed Friday after the US Bureau of Labour Statistics employment data calmed fears of a recession, though provided enough evidence of a slowing economy to maintain market expectations for another Federal Reserve interest rate cut in late October. The Dow Jones Industrial Average added 372.68 points, or 1.42%; the S&P 500 also rallied 41.38 points, or 1.42%, and the tech-heavy Nasdaq 100 added 115.71 points, or 1.51%.
Technically, recent movement concluded north of September’s opening level at 26398, though faces the possibility of selling pressure emerging from fresh supply at 26520-26622, which merges with a 50.0% resistance value at 26516. Given this area was effectively the origin of the break of the low (dashed blue) at 25976, the base should not be overlooked. Selling from here could be enough to overpower any buying at 26398 and close back beneath the 50-day SMA highlighted above.
Areas of consideration:
The H4 supply mentioned above at 26520-26622 is likely of interest to many traders today for possible selling opportunities, though with immediate support residing close by at 26398, waiting for this level to be overthrown may be the safer path to explore (entry/risk can then be based on the breakout candle’s structure). Beyond here, the next downside target can be found at the 200-day SMA (25932) or the H4 trend line support taken from the low 25024. Supporting a run lower, indicator-based traders may also wish to acknowledge the Relative Strength Index (RSI) testing notable resistance around the 56.65 value.
XAU/USD (GOLD):
Weekly gain/loss: +0.53%
Weekly close: 1504.6
Weekly perspective:
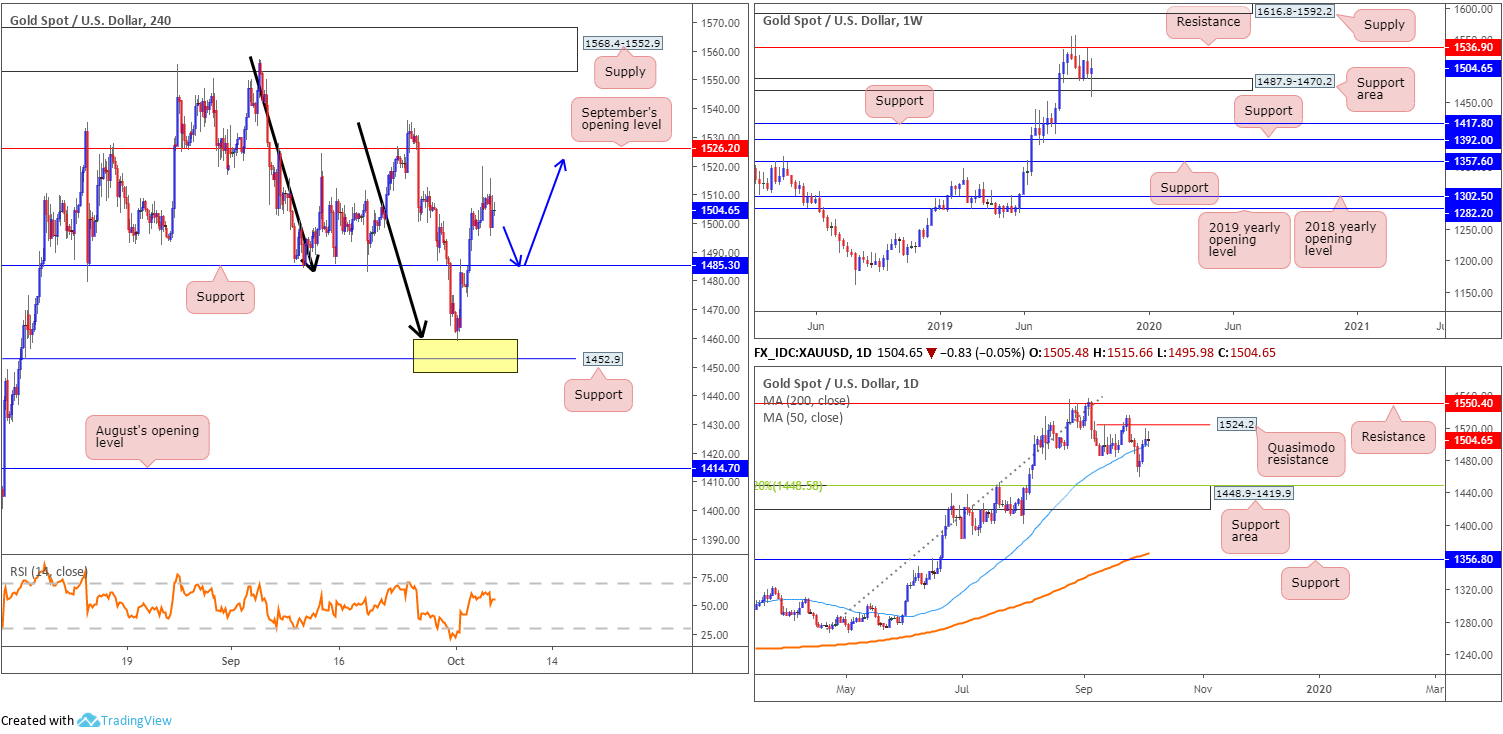
Latest from the weekly timeframe reveals the support area at 1487.9-1470.2, although having its lower edge torn through earlier in the week, appears to have stabilised. This could set the stage for additional buying this week, aiming for resistance at 1536.9, with a break of this line likely forcing supply at 1616.8-1592.2 into the mix. Beyond the current support area, nonetheless, two layers of support are seen at 1392.0 and 1417.8.
Daily perspective:
Technical research on the daily timeframe has the yellow metal trading marginally north of its 50-day SMA (blue – 1500.0), eyeing a run towards local Quasimodo resistance at 1524.2 and possibly resistance at 1550.4. Wednesday’s breakout above the 50-day SMA, however, was tepid, and Friday’s session concluded in the shape of an indecision candle, or Doji candle. Therefore, should price turn lower this week, support may emerge off the 1459.2 October 1st low, followed by a possible run to a support area at 1448.9-1419.9 (converges with a 38.2% Fibonacci support value at 1448.5).
H4 perspective:
Last week’s rally, originating from H4 support between 1448.9/1460.2 (comprised of the top limit of a daily support area at 1448.9-1419.9, a H4 support level at 1452.9 and a H4 AB=CD completion point at 1460.2 [black arrows]), lifted H4 action to weekly peaks of 1519.7.
In light of Friday’s lacklustre performance that ultimately formed the noted Doji candlestick on the daily timeframe, a retest at support from 1485.3 is still eyed, targeting daily Quasimodo resistance at 1524.2 and September’s opening level at 1526.2.
Areas of consideration:
Outlook unchanged.
As all three timeframes exhibit space to press higher, longs likely remain the order of the day. Entering long at current price, however, is tricky, given limited support. A retest at H4 support drawn from 1485.3, nonetheless, would possibly entice buyers into the market, with an upside target, as highlighted above, set at the daily Quasimodo formation 1524.2, closely trailed by September’s opening level at 1526.2.
For conservative buyers, waiting for additional candlestick confirmation to form off 1485.3 might be an option worth exploring. This will help identify buyer intent before committing funds, and will also provide entry and risk levels.
The accuracy, completeness and timeliness of the information contained on this site cannot be guaranteed. IC Markets does not warranty, guarantee or make any representations, or assume any liability regarding financial results based on the use of the information in the site.
News, views, opinions, recommendations and other information obtained from sources outside of www.icmarkets.com.au, used in this site are believed to be reliable, but we cannot guarantee their accuracy or completeness. All such information is subject to change at any time without notice. IC Markets assumes no responsibility for the content of any linked site.
The fact that such links may exist does not indicate approval or endorsement of any material contained on any linked site. IC Markets is not liable for any harm caused by the transmission, through accessing the services or information on this site, of a computer virus, or other computer code or programming device that might be used to access, delete, damage, disable, disrupt or otherwise impede in any manner, the operation of the site or of any user’s software, hardware, data or property.


