
Japanese banks closed in observance of Culture Day; Australia Retail Sales m/m; ECB President Lagarde Speaks.
EUR/USD:
Weekly gain/loss: +0.77%
Weekly close: 1.1164
Weekly perspective:
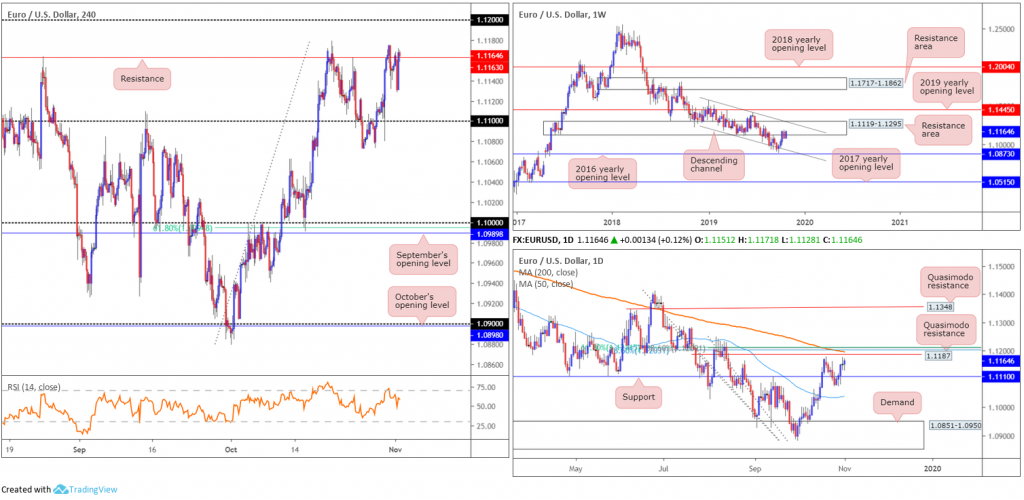
Despite recently anchoring at the underside of a long-standing resistance area drawn from 1.1119-1.1295, buyers appear to be strengthening their grip. Increased bidding this week has the upper boundary of a descending channel (1.1169/1.1569) to target, which happens to intersect with the top edge of the aforementioned resistance zone. Buying beyond here, however, exposes the 2019 yearly opening level at 1.1445.
Concerning trend direction, the primary downtrend has been in motion since topping in early 2018 at 1.2555.
Daily perspective:
Chart studies on the daily timeframe reveal EUR/USD movement retested support at 1.1110 last week and clocked highs at 1.1175. As a result of this, the ducks appear to be lining up for a test of a nearby Quasimodo resistance level at 1.1187 this week. Not only is this level reasonably strong in its own right, additional resistance is visible in the form of a 200-day SMA (orange – 1.1196) and a Fibonacci cluster between 1.1121/1.1203. Therefore, 1.1121/1.1187 is certainly a zone to watch on this scale going forward.
H4 perspective:
Total non-farm payroll employment rose by 128,000 in October, the unemployment rate was little changed at 3.6% and average hourly earnings ticked lower than expected at 0.2%, the US Bureau of Labour Statistics reported Friday. Additionally, the October PMI registered 48.3%, an increase of 0.5 percentage points from the September reading of 47.8%, though lower than market consensus at 49.0%, according to the Institute for Supply Management.
The employment reading prompted a run higher, travelling from a low of 97.26 on the US dollar index to a high of 97.43. The move was relatively short lived, aided by less-than-stellar US manufacturing. In terms of EUR/USD action, the pair wrapped up Friday a shade higher, but remains toying with resistance coming in at 1.1163. Continued bidding may lead to an approach towards the 1.12 handle, which, according to daily structure, aligns with 1.1121/1.1187.
Areas of consideration:
Though H4 resistance at 1.1163 remains in motion, most traders likely have their crosshairs fixed on the 1.12 handle for shorts this week. Knowing this barrier merges with 1.1121/1.1187 on the daily scale as well as weekly price trading within a resistance area at 1.1119-1.1295, 1.12 represents a high-probability sell zone.
Conservative traders, however, may opt to wait and see if a H4 bearish candlestick formation emerges before pulling the trigger, in an attempt to avoid any whipsaw through 1.12, which is common viewing around psychological numbers (entry/risk can then be set according to this structure).
GBP/USD:
Weekly gain/loss: +0.87%
Weekly close: 1.2933
Weekly perspective:
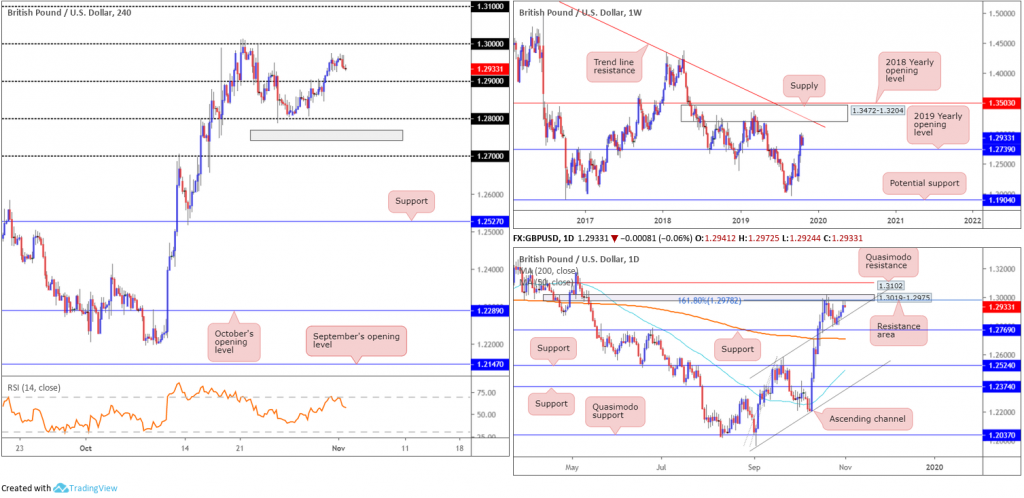
Following the break of the 2019 yearly opening level at 1.2739, price action on the weekly timeframe has entered a somewhat indecisive phase over the past two weeks. A retest at 1.2739 or additional upside towards supply at 1.3472-1.3204/long-term trend line resistance etched from the high 1.5930 is certainly a possibility on this scale going forward.
The immediate trend faces a downward trajectory from 1.4376, with a break of the 1.1904 low (labelled potential support) confirming the larger downtrend from 1.7191.
Daily perspective:
The small, yet clearly respected, area of resistance at 1.3019-1.2975, which aligns with the 161.8% Fibonacci ext. point at 1.2978, remains at the forefront of this timeframe. Failure to engulf channel resistance-turned support (extended from the high 1.2582), however, has placed the current resistance zone under pressure, with Quasimodo resistance plotted at 1.3102 seen above. Below the said channel support, support resides close by at 1.2769, closely shadowed by the 200-day SMA (orange – 1.2708).
H4 perspective:
The headline seasonally adjusted UK manufacturing purchasing managers’ index (PMI) rose to 49.6 in October, up for the second successive month but remaining below the neutral 50.0 mark separating expansion from contraction, according to Markit. Friday also staged mixed US employment figures, with headline non-farm payroll employment rising by 128,000 in October.
In terms of the technical position on the H4 timeframe, the pair trades firm north of the 1.29 handle, poised to approach the key figure 1.30. Note 1.30 held price lower on two occasions during October, strengthened by the daily resistance area mentioned above at 1.3019-1.2975 and a 161.8% Fibonacci ext. ratio at 1.2978.
Areas of consideration:
The break of 1.29 has potentially set the technical stage for a bullish theme, targeting the underside of the daily resistance area at 1.3019-1.2975, followed by 1.30 on the H4. To take advantage of any upside above 1.29, traders, as of current price, may be watching for a retest at 1.29 to emerge before committing funds to a position. Should this unfold, waiting for a confirming H4 bullish candlestick to develop may be the better path to explore; this identifies buyer intent and provides entry/risk levels to work with.
AUD/USD:
Weekly gain/loss: +1.35%
Weekly close: 0.6912
Weekly perspective:
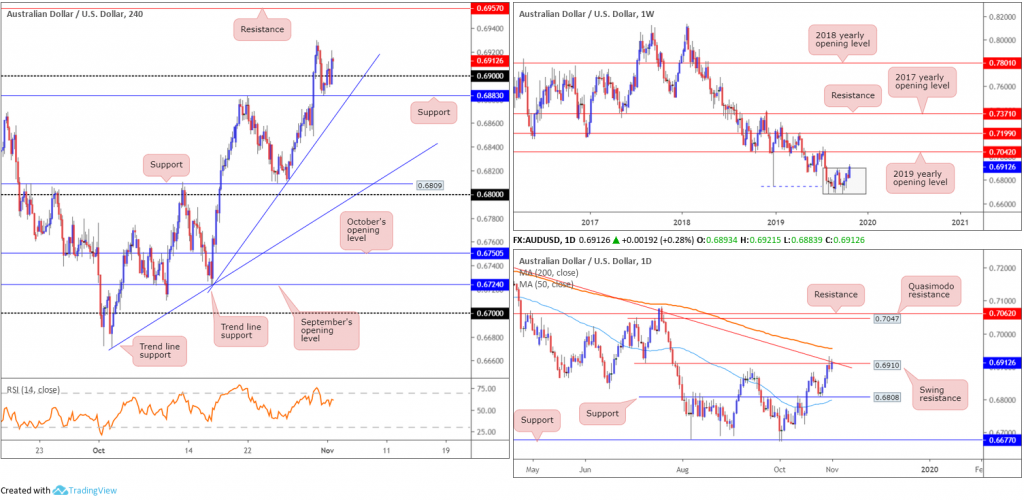
Since engulfing 0.6744 (blue dashed) in early August, AUD/USD action has been carving out a consolidation zone between 0.6894/0.6677 (light grey). That was the case until last week when buyers tunnelled through the top edge of the said range. Potentially viewed as a sign of bullish strength, the 2019 yearly opening level at 0.7042 is seen as the next upside objective on this scale.
With a primary downtrend in play since early 2018, breaking through 0.7042 is likely a challenge.
Daily perspective:
It may also interest some traders this week that a violation of the 200-day SMA potentially clears the runway for an advance towards Quasimodo resistance at 0.7047, closely followed by another layer of resistance priced in at 0.7062 (set nearby the 2019 yearly opening level on the weekly timeframe at 0.7042).
H4 perspective:
China’s Caixin manufacturing PMI provided fresh impetus to the AUD/USD in early trade Friday, lifting price action beyond the 0.69 handle. Weak US ISM manufacturing PMI data weighed on the dollar amid US hours, consequently supporting buyers north of 0.69 into the close. Aside from last Thursday’s high at 0.6929, the next port of resistance on the H4 scale falls in around 0.6957, which aligns almost to-the-point with the 200-day SMA.
Additional levels worthy of mention are trend line support taken from the low 0.6723, support at 0.6883 and another layer of support at 0.6809.
Areas of consideration:
Until the unit engulfs the 200-day SMA (0.6954), further buying on the weekly timeframe is problematic. With this being the case, traders may find use in the H4 resistance at 0.6957 this week as a possible sell zone, knowing it merges with the said 200-day SMA value. This could be good for at least a bounce back to 0.69ish.
Failing a push higher, a H4 close beneath H4 trend line support mentioned above at 0.6723 is likely to be viewed as a bearish indicator, targeting H4 support coming in at 0.6809. As such, shorts beyond the said trend line support are also a consideration this week.
USD/JPY:
Weekly gain/loss: -0.46%
Weekly close: 108.16
Weekly perspective:
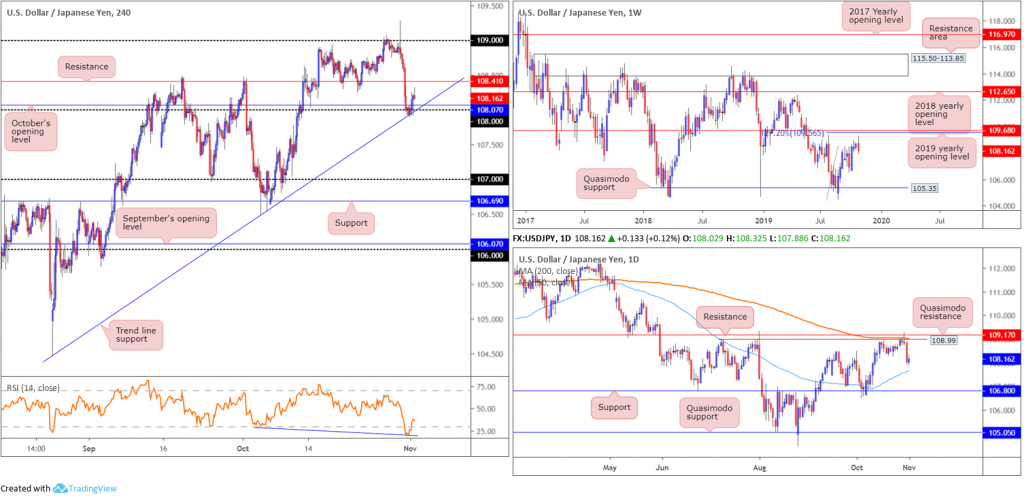
Moulded in the shape of a bearish engulfing candlestick pattern, USD/JPY activity spiralled southbound over the past week and snapped a three-week bullish phase. Formed a few points south of the 2019 yearly opening level at 109.68 and a 127.2% Fibonacci ext. point at 109.56 (taken from the low 104.44), the 106.48 September 30 low offers possible support in the event of further selling this week. Quasimodo support located at 105.35 is also prominent structure on this timeframe.
Daily perspective:
Daily price sold off following Wednesday’s shooting star candlestick pattern (considered a bearish signal) out of a daily resistance area between 109.17/108.99 (comprised of a resistance level at 109.17, the 200-day SMA [orange/109.03 – seen flattening] and Quasimodo resistance at 108.99). The next downside target on this scale falls in close by at the 50-day SMA (blue – 107.68), followed by support at 106.80.
H4 perspective:
The US economy added 128,000 new jobs in October vs. 90,000 anticipated, spurring a wave of buying to highs of 108.25 Friday. Gains, however, were swiftly pared on the back of weaker-than-expected US ISM manufacturing data, though price modestly defended the 108 handle and trend line support (pencilled in from the low 104.44) into the close.
Resistance lies nearby at 108.41, with a break higher exposing the 109 handle. Beneath 108, nonetheless, the pair exhibits scope to press as far south as the 107 region. Indicator-based traders may also wish to note the relative strength index (RSI) recently formed a hidden bullish divergence reading out of oversold territory (blue line).
Areas of consideration:
Traders searching for confirmation of the recently formed weekly bearish engulfing candle could watch for a break of the H4 trend line support (104.44) this week. This, despite the possibility of the 50-day SMA offering support, could lead to a test of 107.
A break of H4 resistance at 108.41, on the other hand, lends a bullish vibe to the proceedings, emphasising a retest of 109 may be in store. In this case, looking for bullish signals above 108.41, preferably a retest of the level by way of a H4 bullish candlestick pattern (entry and risk levels can be set according to this structure), could be an idea.
USD/CAD:
Weekly gain/loss: +0.64%
Weekly close: 1.3138
Weekly perspective:
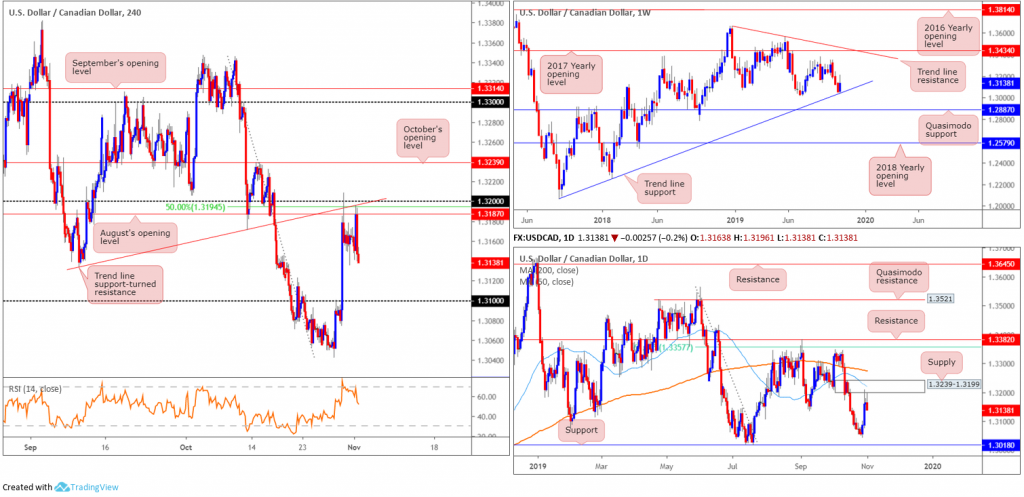
Snapping a three-week losing streak and reclaiming all the prior week’s losses, weekly flow rebounded from trend line support (extended from the low 1.2061) in reasonably strong fashion last week. Additional upside from this point has tops around 1.3342 in sight, closely followed by the 2017 yearly opening level at 1.3434 and trend line resistance taken from the peak at 1.3661.
A violation of the aforementioned trend line support exposes Quasimodo support at 1.2887.
Daily perspective:
Supply at 1.3239-1.3199 entered the fold Wednesday and held into the close, with Friday producing an impressive downside rotation. Intersecting with this area is the 50-day SMA (blue – 1.3220), with the 200-day SMA (orange – 1.3274) positioned a few points above.
With both SMAs pointing south, last Tuesday’s low at 1.3042 could be targeted this week, set a few points north of support at 1.3018.
H4 perspective:
A robust NFP report, followed by optimism on the US/China trade front, saw crude oil prices move higher Friday, consequently weighing on USD/CAD movement from a familiar resistance area between 1.32/1.3187 (comprised of a 50.0% retracement ratio at 1.3194, August’s opening level at 1.3187 and a trend line support-turned resistance etched from the low 1.3134. Note this area also unites with the underside of daily supply mentioned above at 1.3239-1.3199.
Traders who read Friday’s technical briefing may recall the following piece:
In light of the technical confluence supporting 1.32 as resistance on the H4 scale, this could promote further selling. However, entering at current price places the trader at a slight disadvantage in regards to risk/reward. Waiting and seeing if price action retests 1.32 a second time may be the alternative, entering on the back of the rejection candle’s structure and targeting a move to 1.31.
Areas of consideration:
Well done to any readers who managed to short 1.32/1.3187 on the H4 scale. Reducing risk to breakeven and liquidating a portion of the position is certainly an option now. This helps protect against the possibility of buying on the weekly scale off trend line support.
Continued selling on the H4 timeframe, nevertheless, highlights 1.31 as the next downside target, which despite weekly price suggesting higher prices, is backed by daily price exhibiting scope to press lower from supply mentioned above at 1.3239-1.3199.
USD/CHF:
Weekly gain/loss: -0.88%
Weekly close: 0.9854
Weekly perspective:
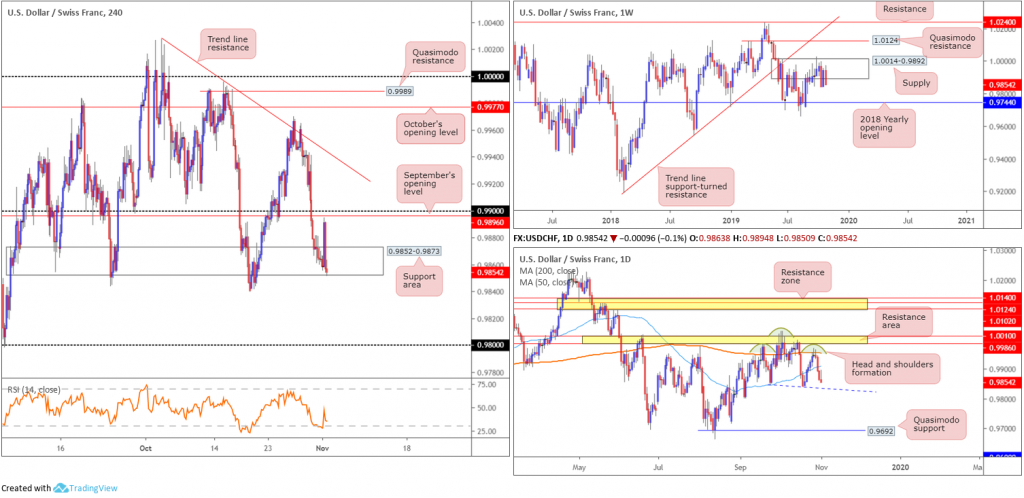
Supply at 1.0014-0.9892 remains in play, though despite recent selling still resembles somewhat of a fragile tone. The beginning of October witnessed a penetration to the outer edge of the supply area’s limit, possibly tripping a portion of buy stops and weakening sellers. An upside move out of the said supply may draw in Quasimodo resistance at 1.0124, while downside has the 2018 yearly opening level at 0.9744 in sight.
According to the primary trend, price also reflects a slightly bullish tone; however, do remain aware we have been rangebound since the later part of 2015 (0.9444/1.0240).
Daily perspective:
Supporting a bearish theme out of the current weekly supply, however, is daily action currently in process of completing a bearish head and shoulder’s formation out of a resistance area at 1.0010-0.9986. The break of the neckline taken from the 0.9843 September 24 low (blue line) needs to be engulfed before this pattern is tradeable, with an optimal downside target present at Quasimodo support fixed from 0.9692.
H4 perspective:
Friday witnessed an upsurge of buying in wake of the US non-farm payrolls release, reaching highs just south of September’s opening level at 0.9896/the 0.99 handle. Buyers failed to sustain gains beyond this point, weighed on by weaker-than-expected US manufacturing data.
The current support area at 0.9852-0.9873 is hanging on by a thread at the moment; a break would likely clear orders to shake hands with 0.98.
Areas of consideration:
Based on the three timeframes analysed above, a reasonably strong bearish vibe is present right now. Ultimately, traders are likely watching for a daily close below the head and shoulders neckline (0.9843) before committing funds to a short position. A decisive H4 close below the support area at 0.9852-0.9873 will potentially be viewed as an early cue, however. Therefore, aggressive traders may look to begin loading up on shorts at this point, and pyramiding positions on a break of the head and shoulder’s neckline.
The first downside target for shorts falls in at 0.98, though according to weekly price, 0.9744 is a possibility, followed by daily Quasimodo support at 0.9692.
Dow Jones Industrial Average:
Weekly gain/loss: +1.34%
Weekly close: 27270
Weekly perspective:
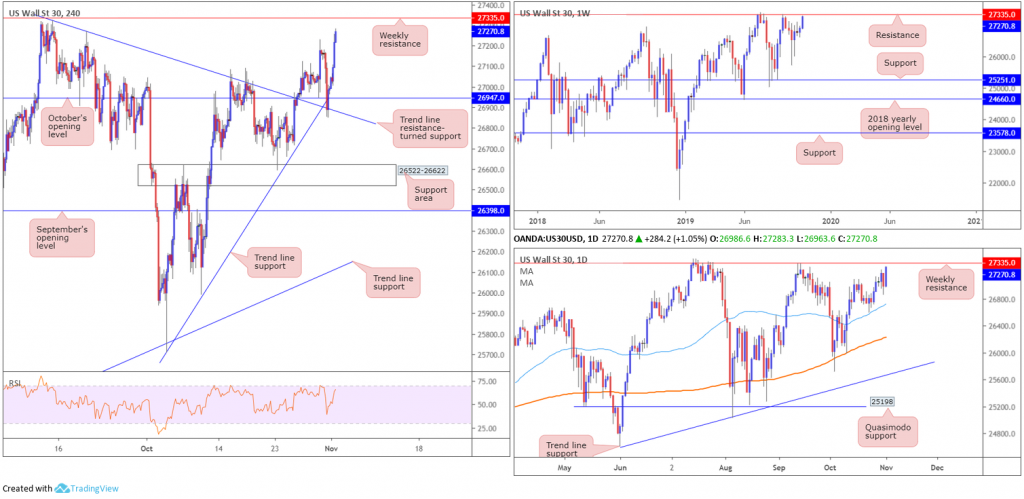
US stocks ended the week in relatively strong fashion, extending the previous week’s gain by way of a near-full-bodied bullish candle. Resistance at 27335 remains a focal point on this chart, sited only a few points south of the all-time high 27388. Levels of support remain fixed at the 25710 September 30 low, support at 25251 and the 2018 yearly opening level at 24660.
Despite a minor setback to 21452, the primary trend in this market remains facing northbound.
Daily perspective:
In similar fashion to weekly movement, resistance is seen at 27335 with daily action firming north of the 50-day SMA (blue – 26728). Both this SMA and the 200-day SMA (orange – 26229) face a northerly bearing.
H4 perspective:
Thursday’s recovery off October’s opening level fixed from 26947, which aligns closely with two trend line supports (25710/27321), extended higher Friday as investor sentiment got a lift from stronger-than-expected US jobs data. The Dow Jones Industrial Average added 301.13 points, or 1.11%; the S&P 500 advanced 29.35 points, or 0.97% and the tech-heavy Nasdaq 100 closed higher by 77.33 points, or 0.96%.
Further upside from this point is likely to challenge weekly resistance at 27335.
Areas of consideration:
Traders long from the 26947 neighbourhood may want to consider liquidating a portion of their position ahead of weekly resistance at 27335.The likelihood of active sellers being present here is high. A H4 close beyond 27335, and preferably beyond the all-time high 27388, however, will confirm a strong bullish bias. Longs based on either the breakout candle or a retest at 27335 will then be an option.
XAU/USD (GOLD):
Weekly gain/loss: +0.64%
Weekly close: 1514.0
Weekly perspective:
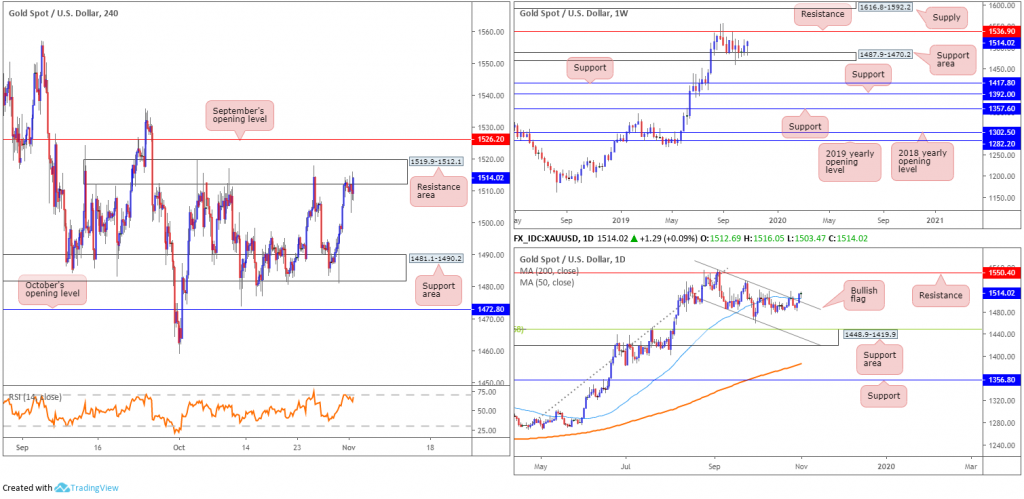
Gold, in $ terms, recorded its third successive week in positive terrain, bolstered by a familiar support area at 1487.9-1470.2. Resistance is seen at 1536.9, whereas two layers of support are visible at 1392.0 and 1417.8, in the event we eventually push for lower ground.
With respect to the longer-term primary trend, gold has been trading northbound since the later part of 2015 (1046.5).
Daily perspective:
Daily price brushed aside the upper edge of a bullish flag (taken from the high 1557.1) and the 50-day SMA (blue – 1504.3) last Thursday, supporting longs off the weekly support area mentioned above at 1487.9-1470.2. The next upside target from this region falls in at the 1535.6 September 24 high, closely shadowed by resistance at 1550.4.
H4 perspective:
In wake of Friday’s robust US non-farm payrolls data, the yellow metal clocked lower levels, though failed to push beyond 1503.1. As highlighted in Friday’s technical briefing, the H4 candles have been busy carving out a consolidation between a support area coming in at 1481.1-1490.2 and a resistance zone at 1519.9-1512.1 since early October. Note the week concluded at the top edge of the said range. Outside of this consolidation, nearby resistance resides in the form of September’s opening level at 1526.2, whereas below we have October’s opening level pencilled in from 1472.8.
Technically speaking, a breakout higher is the more likely route on the H4, considering the higher-timeframe’s picture.
Areas of consideration:
Having noted higher-timeframe action is poised to move higher, selling the top edge of the current H4 range at 1519.9-1512.1, despite the area holding a number of times in the past, is considered chancy.
An alternative is to simply enter long at current price and position protective stop-loss orders below Friday’s low (1503.1) in anticipation of further upside. In that case, keep eyes on September’s opening level at 1526.2 as possible resistance.
More conservative traders, on the other hand, may wait for a breakout north above 1526.2 to occur. While a break higher may be appealing, this leaves little room for manoeuvre to weekly resistance mentioned above at 1536.9.
The accuracy, completeness and timeliness of the information contained on this site cannot be guaranteed. IC Markets does not warranty, guarantee or make any representations, or assume any liability regarding financial results based on the use of the information in the site.
News, views, opinions, recommendations and other information obtained from sources outside of www.icmarkets.com.au, used in this site are believed to be reliable, but we cannot guarantee their accuracy or completeness. All such information is subject to change at any time without notice. IC Markets assumes no responsibility for the content of any linked site.
The fact that such links may exist does not indicate approval or endorsement of any material contained on any linked site. IC Markets is not liable for any harm caused by the transmission, through accessing the services or information on this site, of a computer virus, or other computer code or programming device that might be used to access, delete, damage, disable, disrupt or otherwise impede in any manner, the operation of the site or of any user’s software, hardware, data or property.


