
DXY:
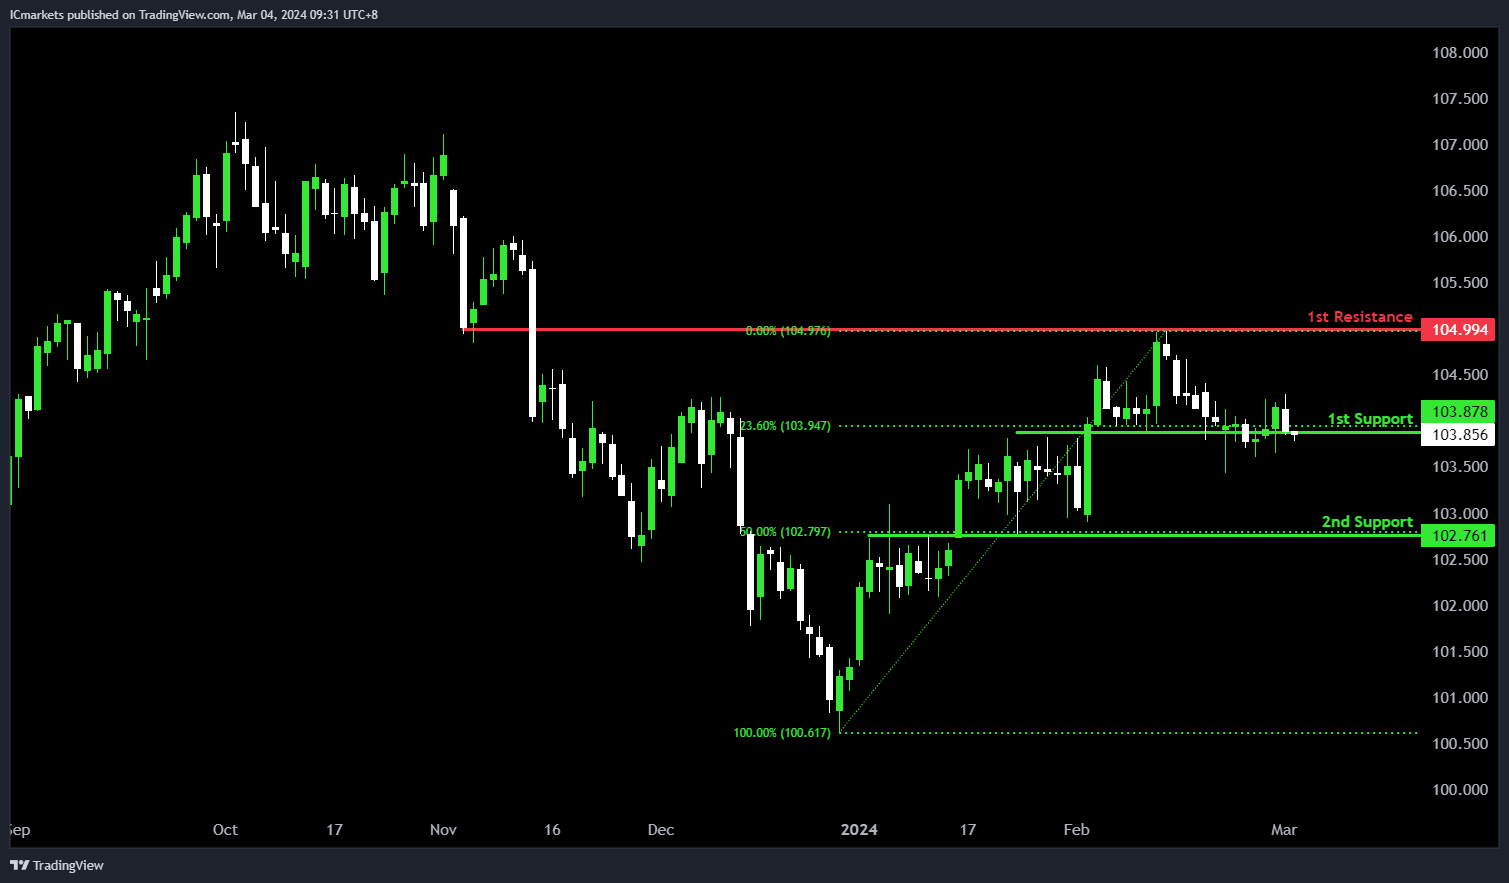
The DXY (US Dollar Index) chart currently reflects bullish momentum, indicating a potential scenario of a bullish continuation towards the 1st resistance.
The 1st support level at 103.87 is recognized as an overlap support, coinciding with the 23.60% Fibonacci Retracement level. This convergence suggests a historically significant area where buying interest has previously emerged, potentially providing substantial support for the price.
Additionally, the 2nd support at 102.76 is characterized as an overlap support, aligning with the 50% Fibonacci Retracement level. This reinforces its significance as a key support zone, historically attracting buyers and potentially halting further downside movement.
Conversely, the 1st resistance at 104.99 is identified as an overlap resistance. This level historically serves as a significant barrier where selling pressure may intensify, potentially limiting upward movement in the short term.
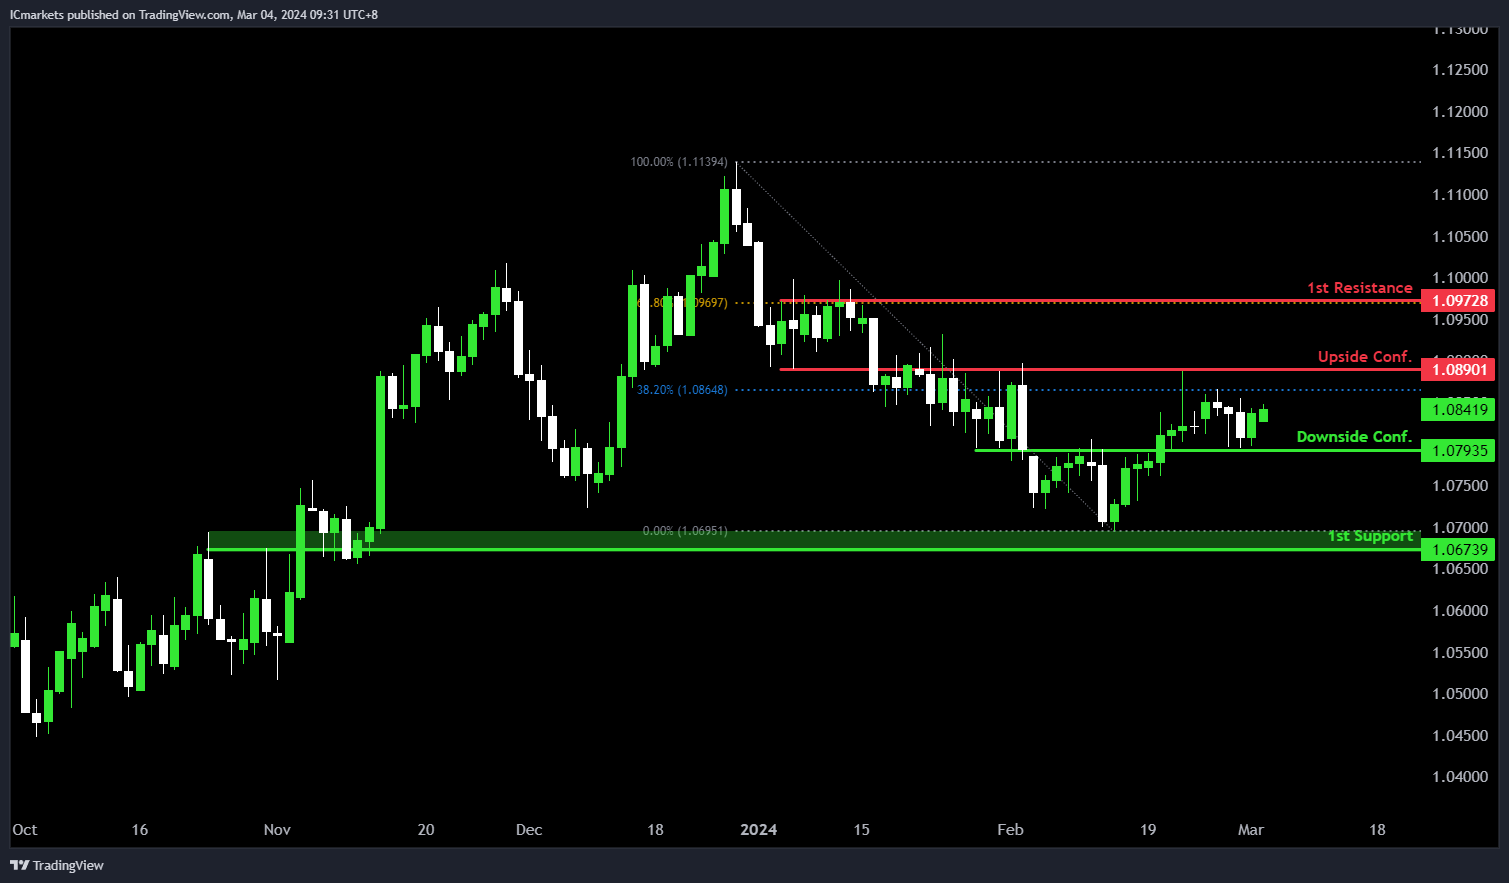
EUR/USD:
The EUR/USD chart currently reflects a neutral momentum, suggesting a potential scenario of fluctuation between the 1st resistance and 1st support levels.
The downside confirmation level at 1.0793 is recognized as an overlap support, historically indicating a significant area where buying interest has emerged, potentially providing support for the price.
Furthermore, the 1st support at 1.0673 is characterized as an overlap support, reinforcing its significance as a key level where buyers have historically intervened to prevent further decline.
On the upside, the upside confirmation level at 1.0890 is identified as an overlap resistance, coinciding with the 38.20% Fibonacci Retracement level. This convergence suggests a historically significant area where selling pressure may intensify, potentially limiting upward movement in the short term.
Moreover, the 1st resistance at 1.0972 is noted as a multi-swing high resistance, aligning with the 61.80% Fibonacci Retracement level. This further solidifies its significance as a level where selling interest may intensify, potentially capping the upside movement of prices.
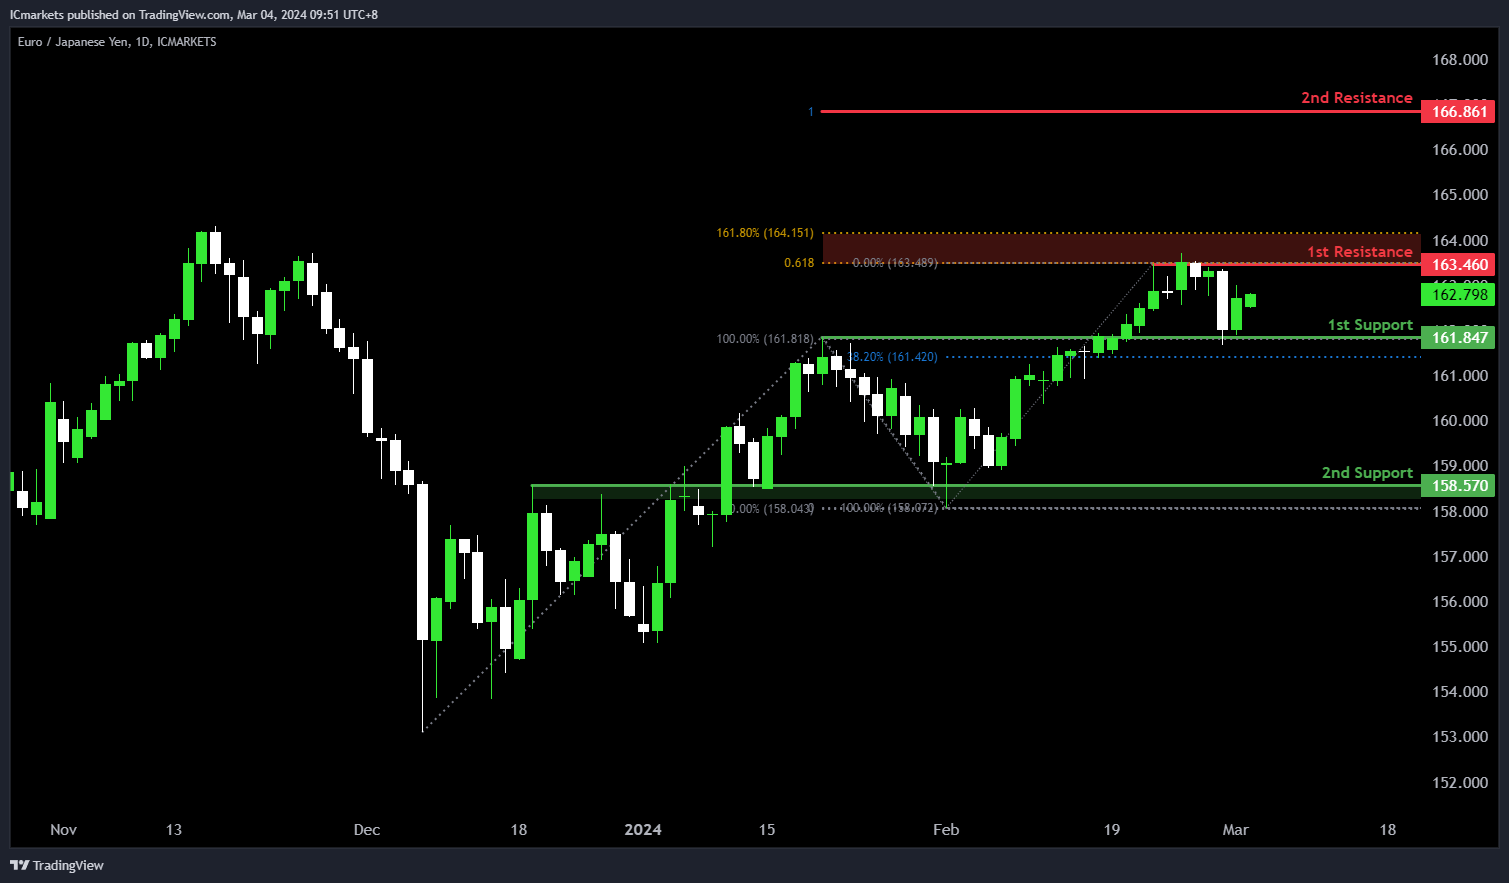
EUR/JPY:
The EUR/JPY chart is currently displaying bullish momentum, indicating a potential continuation towards the 1st resistance level.
The 1st support at 161.84 is identified as an overlap support, coinciding with the 38.20% Fibonacci Retracement level. This level historically signifies a point where buying interest has emerged, providing potential support for the price.
Furthermore, the 2nd support at 158.57 is characterized as an overlap support, further reinforcing its significance as a level where buyers have intervened in the past.
On the resistance side, the 1st resistance at 163.46 is identified as a multi-swing high resistance. It is notable for its confluence with the 161.80% Fibonacci Extension and the 61.80% Fibonacci Projection, indicating a strong barrier where selling pressure may intensify.
Additionally, the 2nd resistance at 166.86 is noted for its presence as a 100% Fibonacci Projection, further highlighting its importance as a level where selling interest may increase.
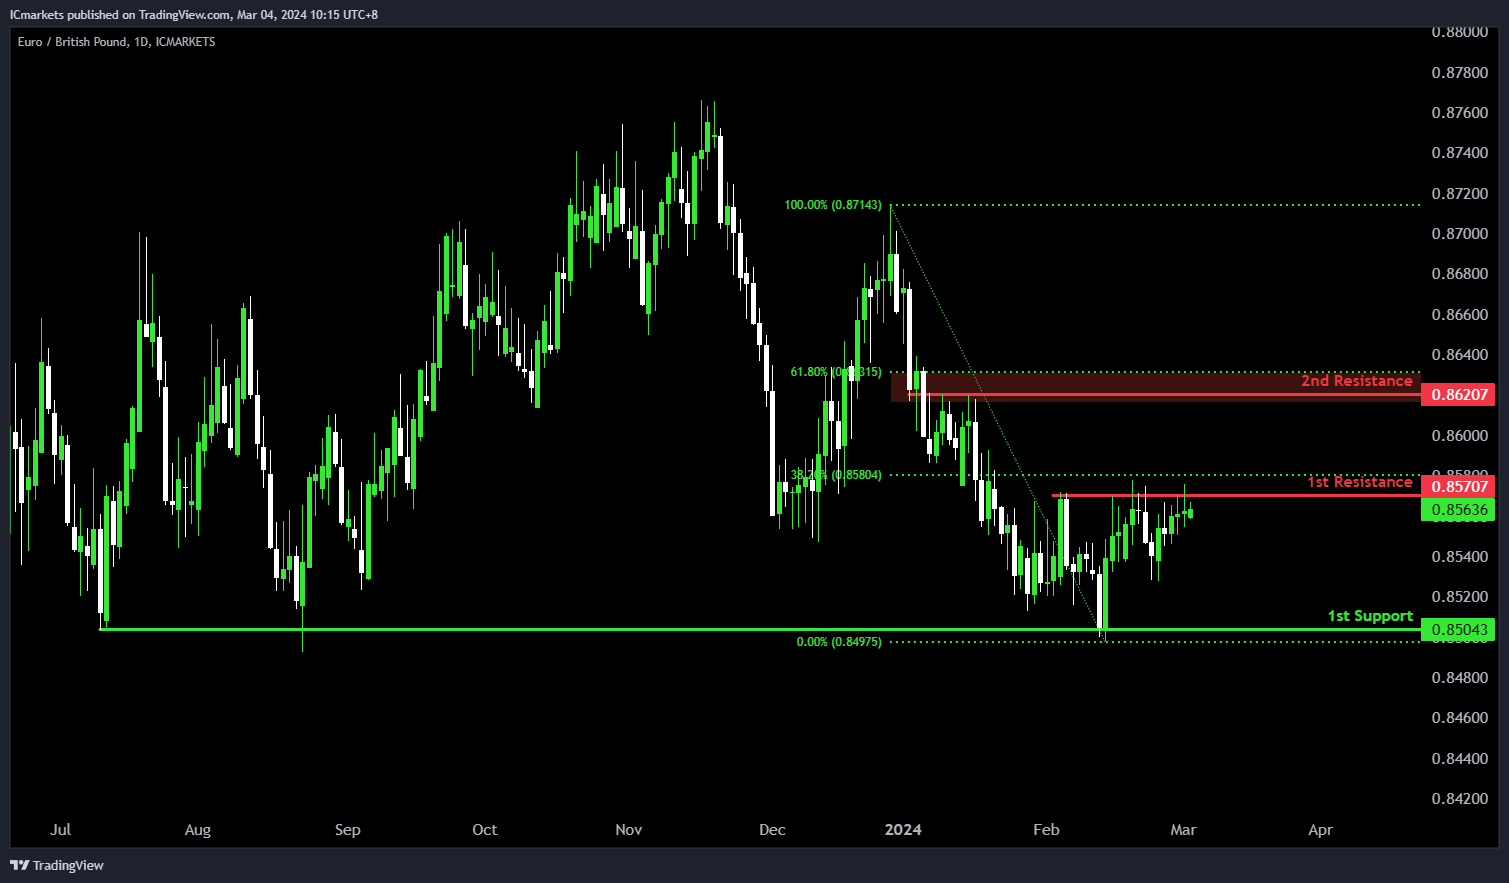
EUR/GBP:
The EUR/GBP chart currently indicates a bearish momentum, suggesting a potential scenario of a bearish reaction off the 1st resistance level followed by a drop towards the 1st support.
The 1st support level at 0.8504 is identified as a multi-swing low support, indicating its historical significance as a level where buying interest has previously emerged, potentially providing support for the price in the event of a decline.
On the resistance side, the 1st resistance at 0.8570 is identified as a multi-swing high resistance. Additionally, this level coincides with the 38.20% Fibonacci Retracement level, further reinforcing its significance as a barrier where selling pressure may increase, potentially causing a bearish reaction.
Furthermore, the 2nd resistance at 0.8620 is characterized as an overlap resistance, coinciding with the 61.80% Fibonacci Retracement level. This adds another layer of resistance, suggesting that selling interest may intensify at this level.
GBP/USD:
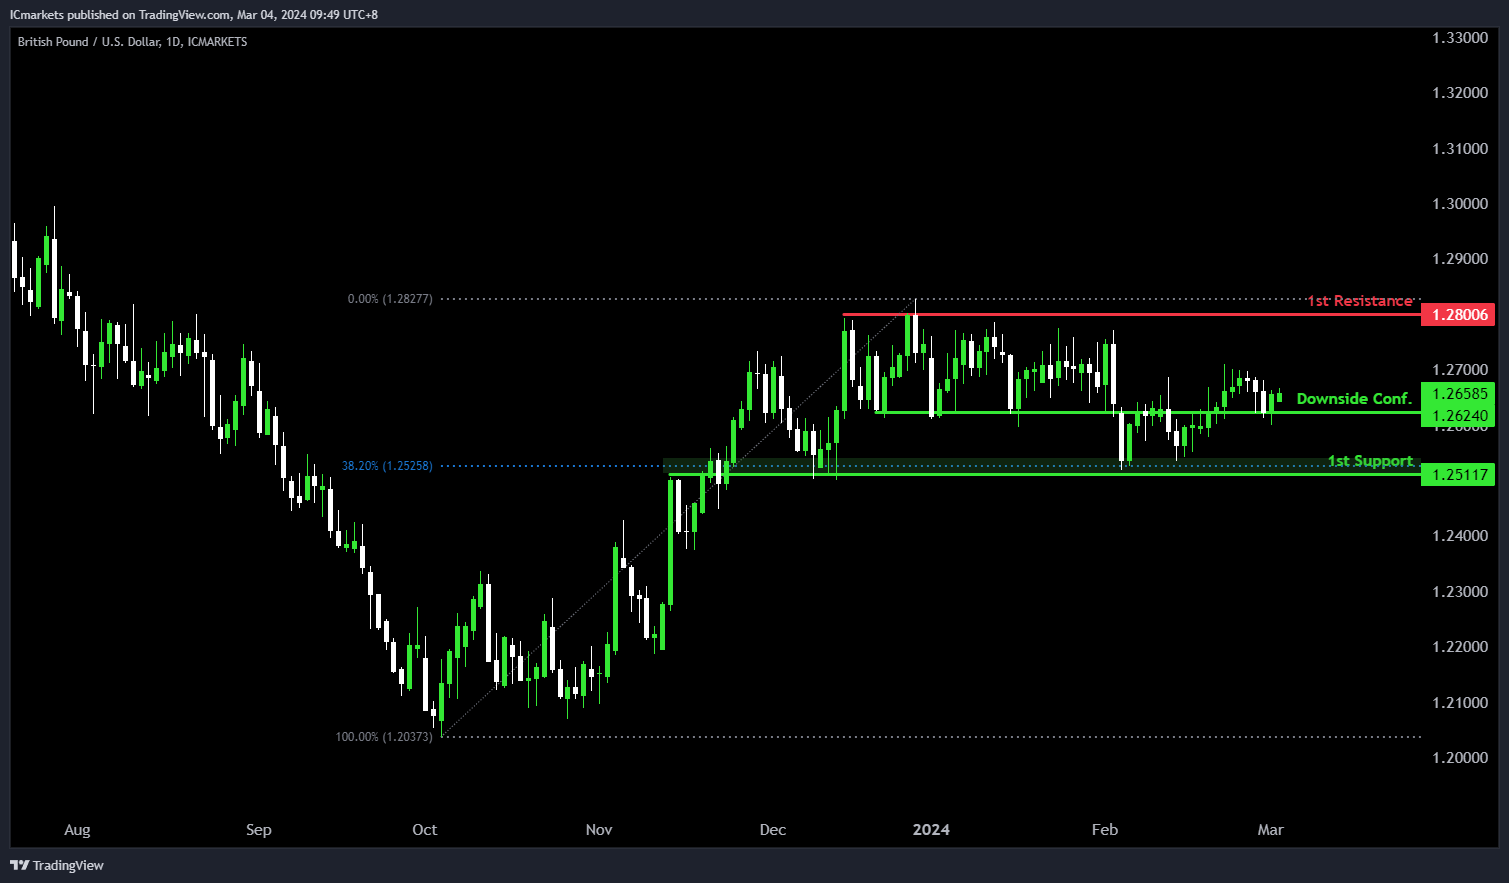
The GBP/USD chart currently indicates bearish momentum, suggesting a potential scenario of a bearish continuation towards the 1st support level.
The downside confirmation level at 1.2624 is recognized as an overlap support, historically indicating a significant area where buying interest has emerged, potentially providing support for the price.
Furthermore, the 1st support at 1.2511 is characterized as an overlap support, coinciding with the 38.20% Fibonacci Retracement level. This reinforces its significance as a key level where buyers have historically intervened to prevent further decline.
On the resistance side, the 1st resistance at 1.2800 is identified as a multi-swing high resistance. This level suggests historical significance as a barrier where selling pressure may increase, potentially limiting upward movement in the short term.
.
GBP/JPY:
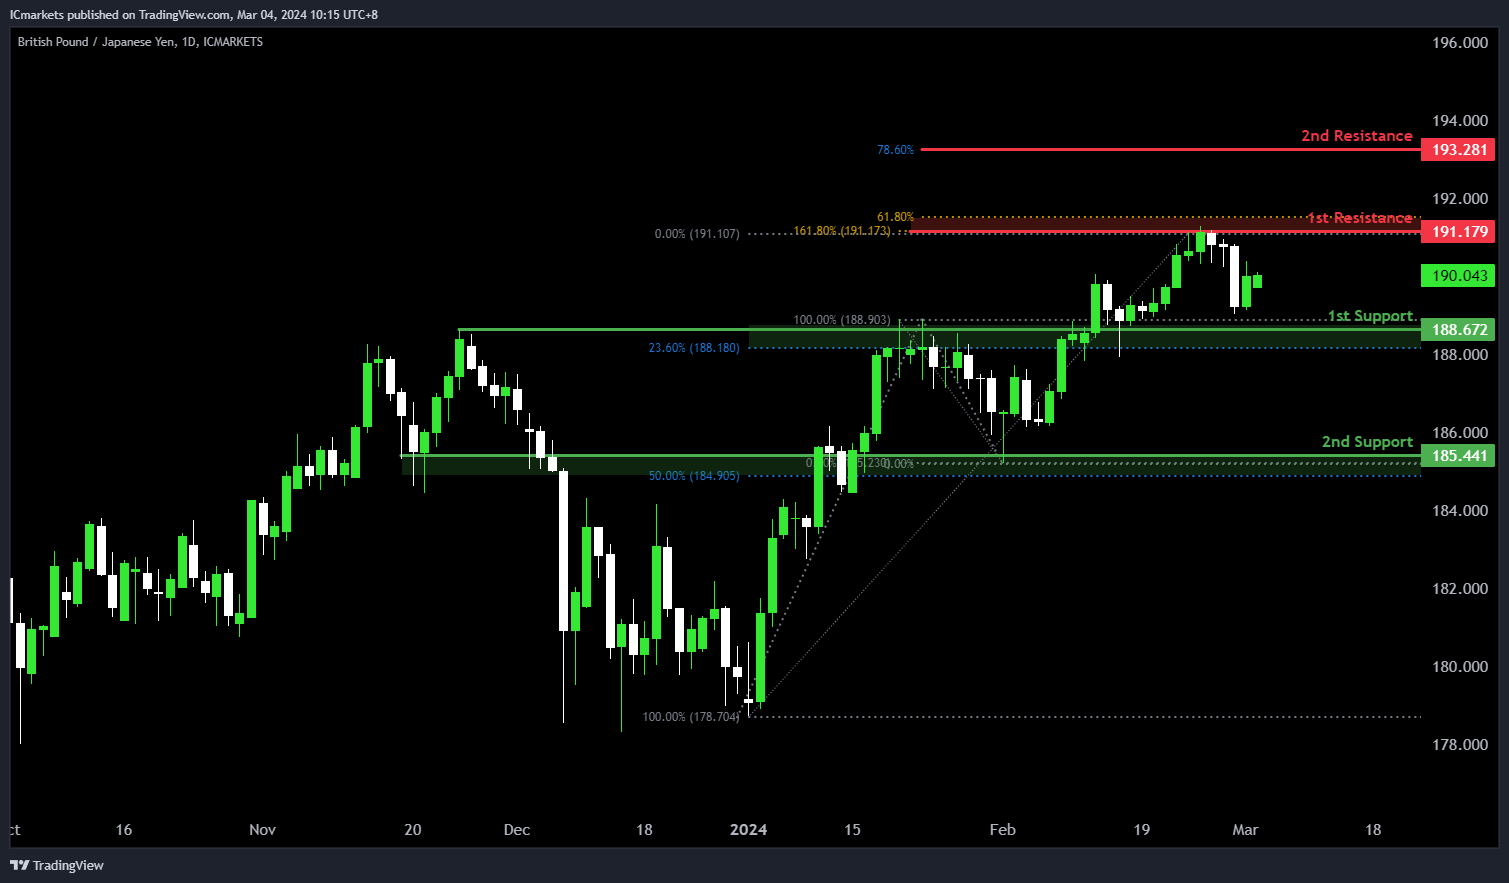
The GBP/JPY chart currently exhibits bullish momentum, suggesting a potential scenario of a bullish continuation towards the 1st resistance.
The 1st support level at 188.67 is identified as an overlap support, coinciding with the 23.60% Fibonacci Retracement level. This level historically indicates a significant area where buying interest has emerged, potentially providing support for the price in case of a pullback.
Furthermore, the 2nd support at 185.44 is characterized as an overlap support, coinciding with the 50% Fibonacci Retracement level. This reinforces its significance as a level where buyers have historically intervened to prevent further decline.
On the resistance side, the 1st resistance level at 191.17 is identified as a swing high resistance. Additionally, this level is significant as it coincides with the 161.80% Fibonacci Extension and the 61.80% Fibonacci Retracement, indicating Fibonacci confluence and suggesting a strong resistance area.
Moreover, the 2nd resistance at 193.28 is noted for its presence at the 78.60% Fibonacci Retracement level, further reinforcing its importance as a level where selling pressure may intensify.
USD/CHF:
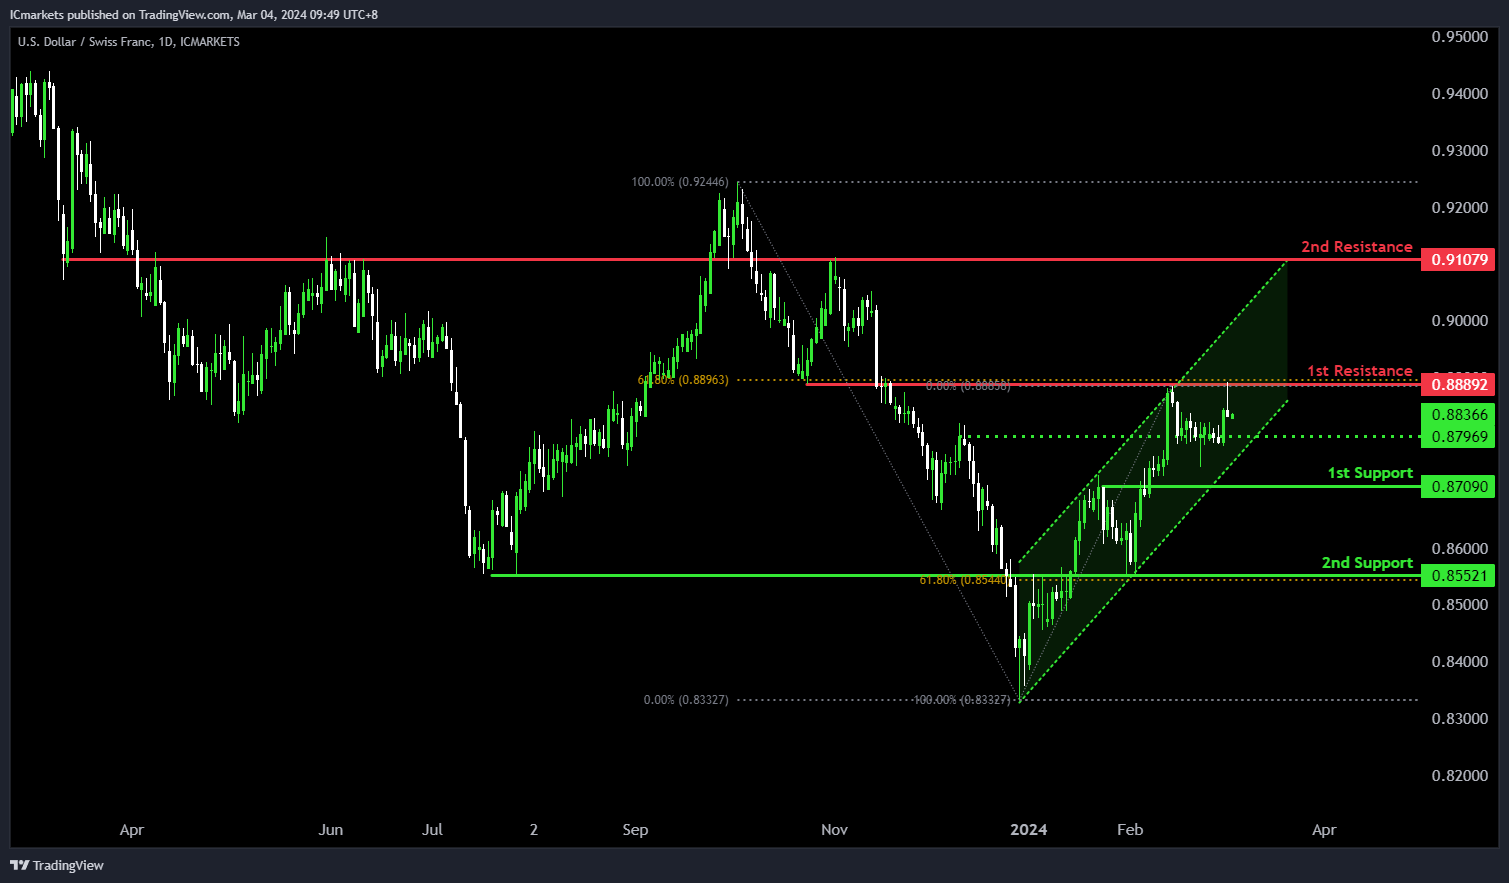
The USD/CHF chart exhibits bullish momentum, characterized by its presence in a bullish ascending channel, indicating a potential scenario of a short-term drop to the 1st support level before rebounding towards the 1st resistance.
The 1st support at 0.8709 is identified as a pullback support, historically indicating a level where buying interest has emerged, potentially providing support for the price.
Additionally, the 2nd support at 0.8552 is characterized as an overlap support, coinciding with the 61.80% Fibonacci Retracement level. This reinforces its significance as a key level where buyers may intervene to prevent further decline.
On the resistance side, the 1st resistance at 0.8889 is identified as an overlap resistance, coinciding with the 61.80% Fibonacci Retracement level. This level suggests historical significance as a barrier where selling pressure may increase.
Moreover, the 2nd resistance at 0.9107 is noted as an overlap resistance, further reinforcing its importance as a level where selling interest may intensify.
The intermediate support level at 0.8796 is also identified as an overlap support, providing additional confirmation of potential support for the price.
USD/JPY:
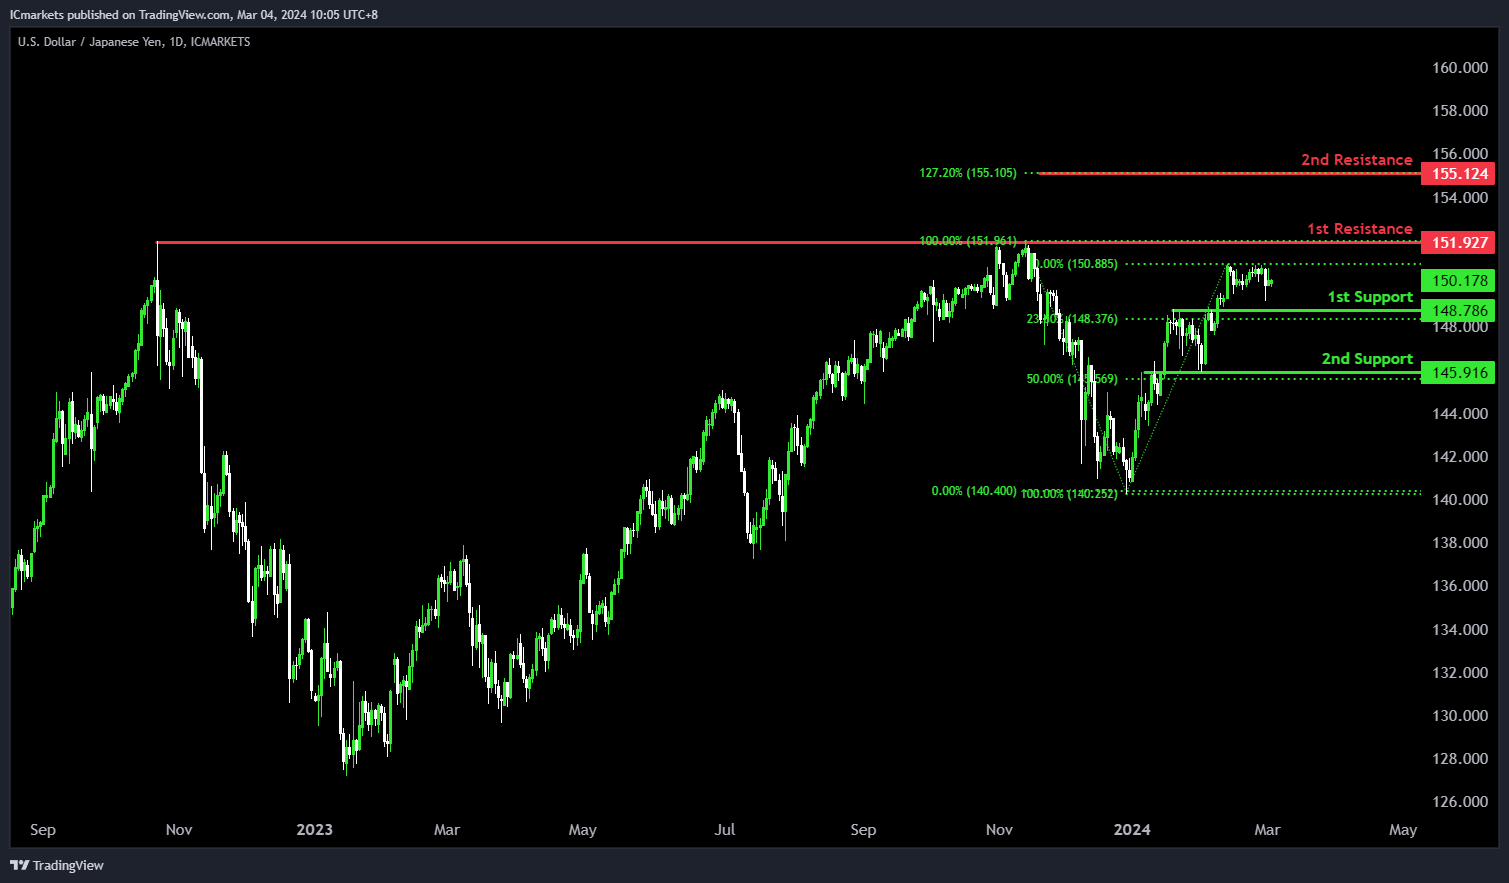
The USD/JPY chart is currently exhibiting bullish momentum, suggesting a potential short-term drop to the 1st support level before rebounding towards the 1st resistance.
The 1st support at 148.78 is identified as a pullback support, coinciding with the 23.60% Fibonacci Retracement level. This level historically indicates a point where buying interest has emerged, potentially offering support for the price.
Additionally, the 2nd support at 145.91 is characterized as an overlap support, aligning with the 50% Fibonacci Retracement level. This reinforces its significance as a level where buyers have historically intervened to prevent further decline.
On the resistance side, the 1st resistance at 151.92 is identified as a multi-swing high resistance, suggesting its historical importance as a barrier where selling pressure may increase, potentially limiting upward movement.
Moreover, the 2nd resistance at 155.12 is noted for its presence as a 127.20% Fibonacci Extension level, further solidifying its significance as a level where selling interest may intensify, potentially capping the upward movement of prices.
USD/CAD:
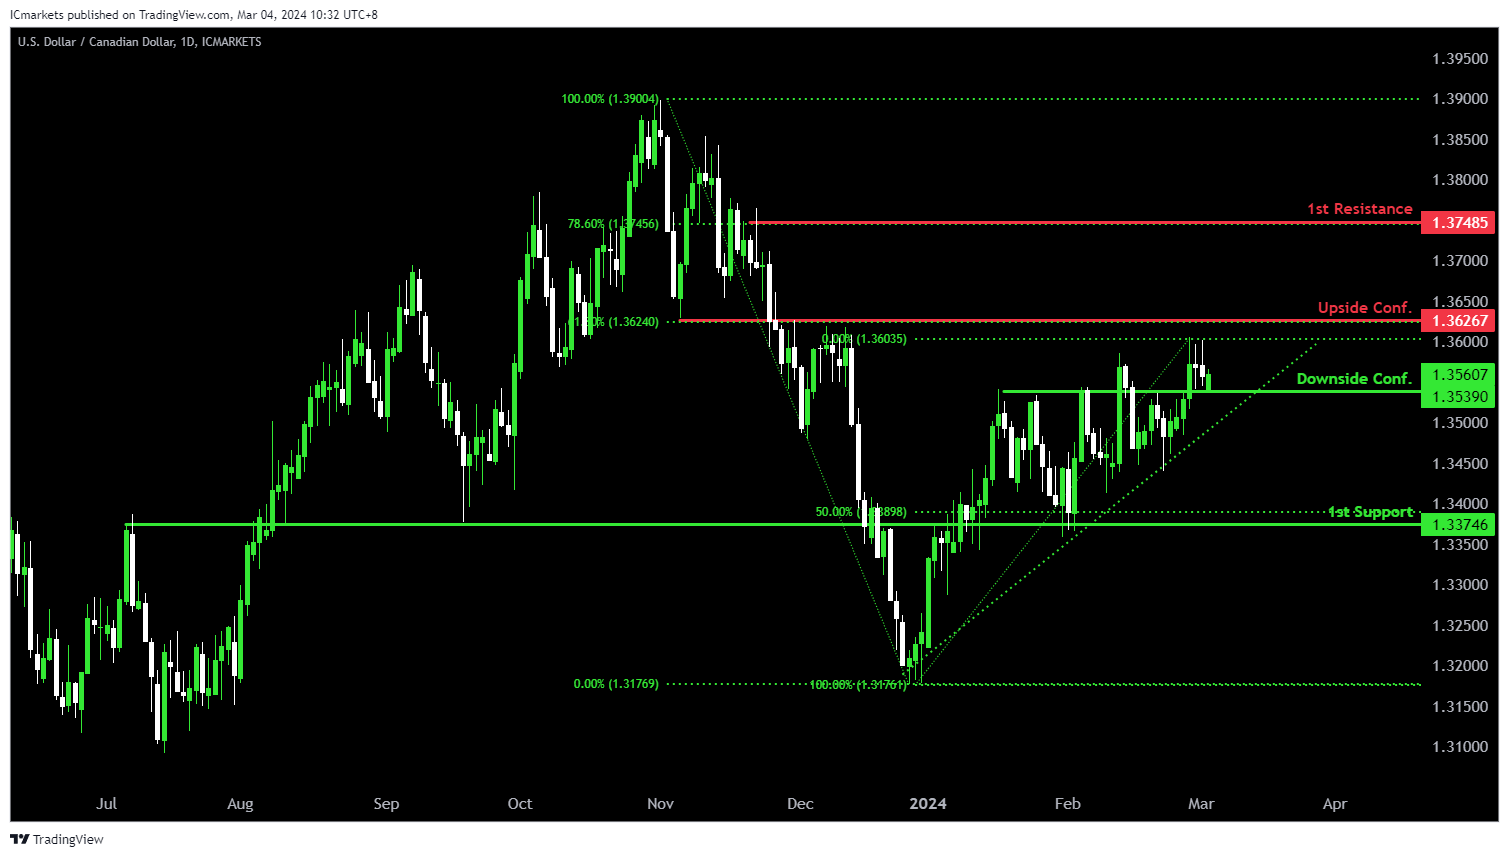
The USD/CAD chart currently exhibits an overall bullish momentum. In this context, there is a potential scenario for price to break above the Upside Confirmation and rise towards the 1st resistance.
The Upside Confirmation level at 1.3626 is identified as an overlap resistance that aligns with the 61.80% Fibonacci Retracement level. Higher up, the 1st resistance level at 1.3748 is marked as a pullback resistance that aligns with the 78.60% Fibonacci Retracement level, further highlighting its importance as a potential resistance zone.
To the downside, the Downside Confirmation level at 1.3539 is identified as an overlap support. Further below, the 2nd support level at 1.3374 is also marked as an overlap support that aligns close to the 50.00% Fibonacci retracement level, reinforcing its significance as a key support level.
AUD/USD:
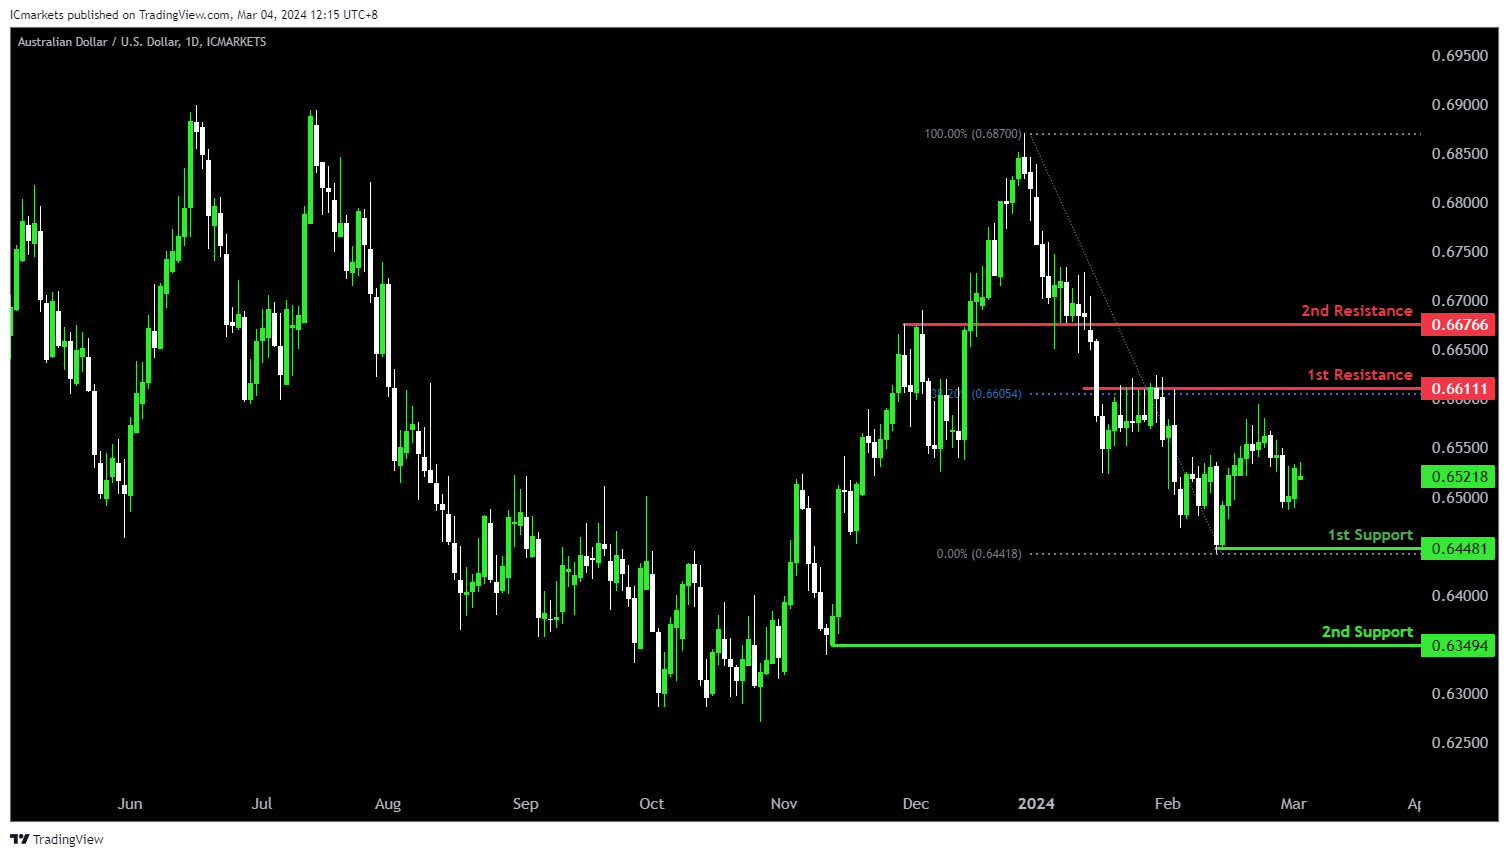
The AUD/USD chart currently exhibits an overall bearish momentum. In this context, there is a potential scenario for price to fall towards the 1st support.
The 1st support level at 0.6448 is identified as a pullback support. Further below, the 2nd support level at 0.6349 is also marked as a pullback support, further emphasizing its importance as a potential support zone.
To the upside, the 1st resistance level at 0.6611 is identified as a pullback resistance that aligns with the 38.20% Fibonacci Retracement level. Higher up, the 2nd resistance level at 0.6676 is noted as an overlap resistance, further highlighting its importance as a potential resistance zone.
NZD/USD
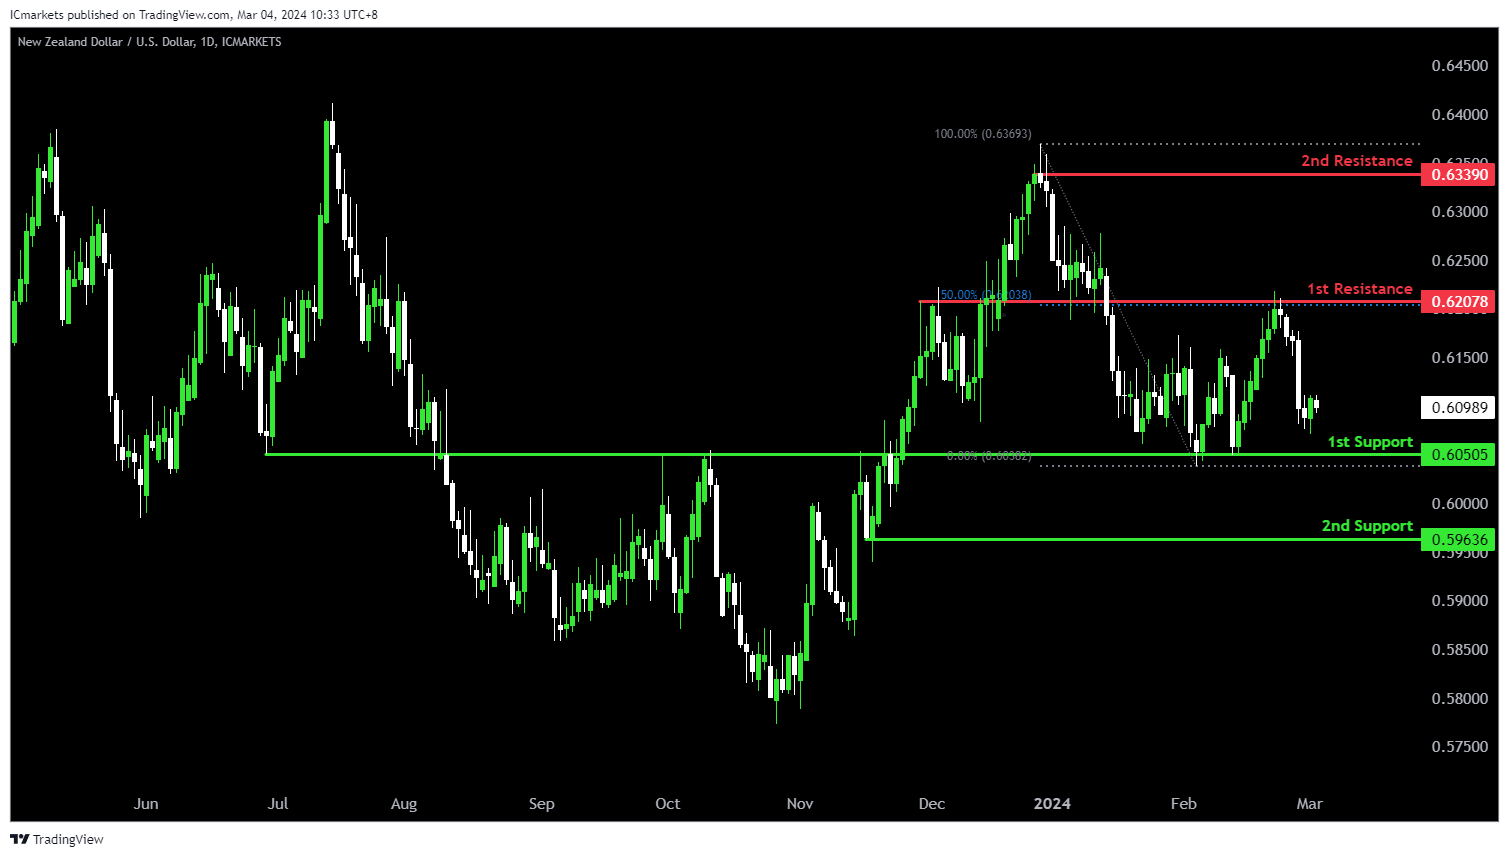
The NZD/USD chart currently exhibits an overall bearish momentum. In this context, there is a potential scenario for price to fall towards the 1st support.
The 1st support level at 0.6050 is identified as an overlap support. Further below, the 2nd support level at 0.5963 is marked as a pullback support, further emphasizing its importance as a potential support zone.
To the upside, the 1st resistance level at 0.6207 is identified as an overlap resistance that aligns with the 50.00% Fibonacci Retracement level. Higher up, the 2nd resistance level at 0.6339 is noted as a swing-high resistance, further highlighting its importance as a potential resistance zone.
DJ30:
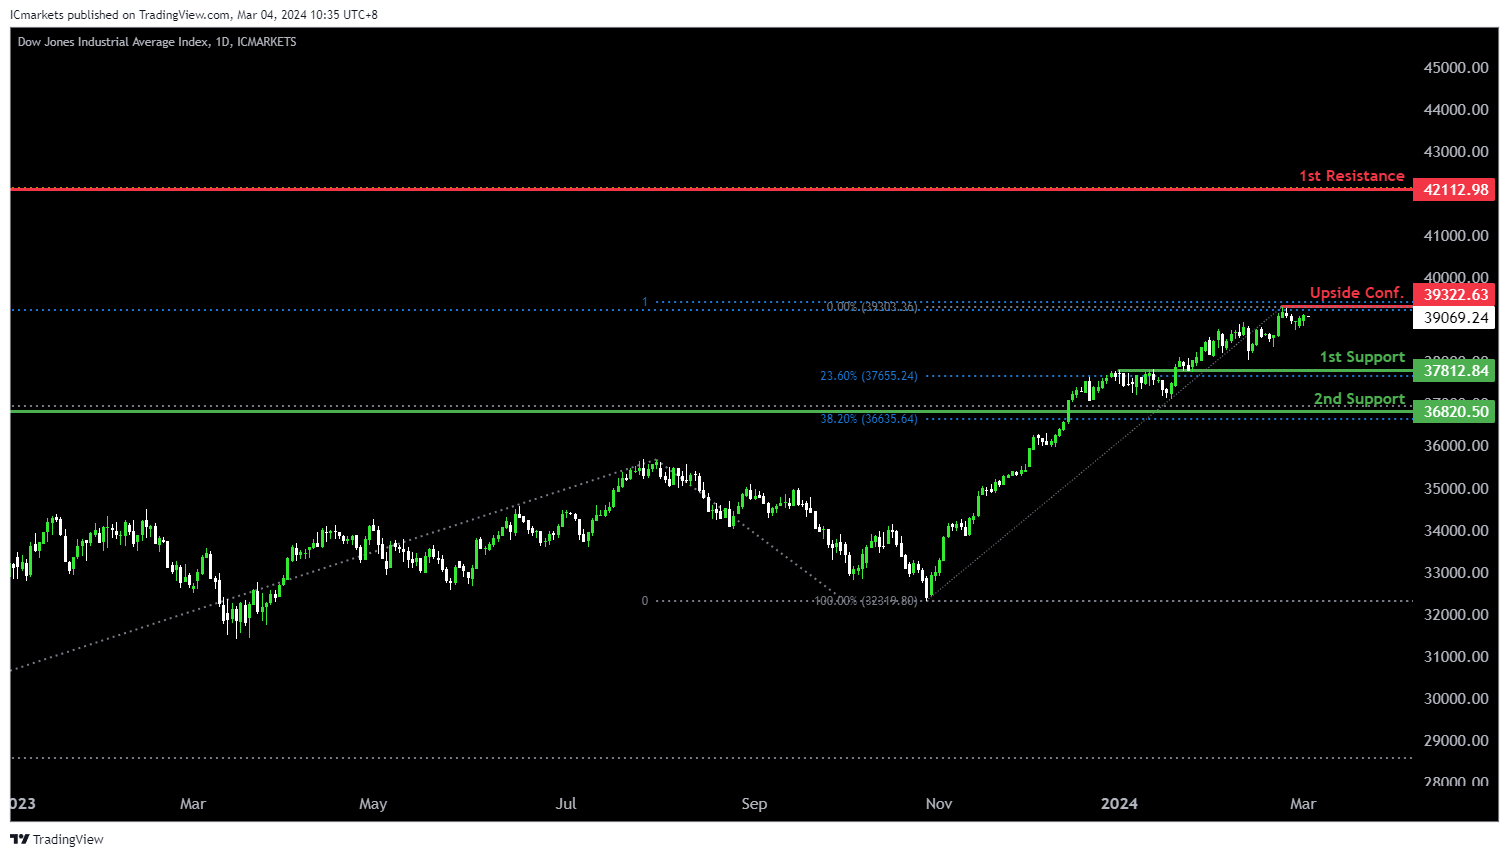
The DJ30 chart currently exhibits an overall bullish momentum. In this context, there is a potential scenario for price to make a bullish continuation towards the 1st resistance should it break above the Upside Confirmation.
The Upside Confirmation level at 39,322.63 is identified as a pullback resistance that aligns with a confluence of Fibonacci levels i.e. the 100.00% Projection and the 127.20% Extension. Higher up, the 2nd resistance level at 42,112.98 is noted as a resistance that aligns with the 161.80% Fibonacci Extension level, adding to its significance as a potential barrier to further bullish movement.
On the support side, the 1st support level at 37,812.84 is identified as an overlap support that aligns with the 23.60% Fibonacci Retracement level. Further below, the 2nd support at 36,820.50 is marked as a pullback support that aligns close to the 38.20% Fibonacci Retracement level, further reinforcing its significance as a potential level of support.
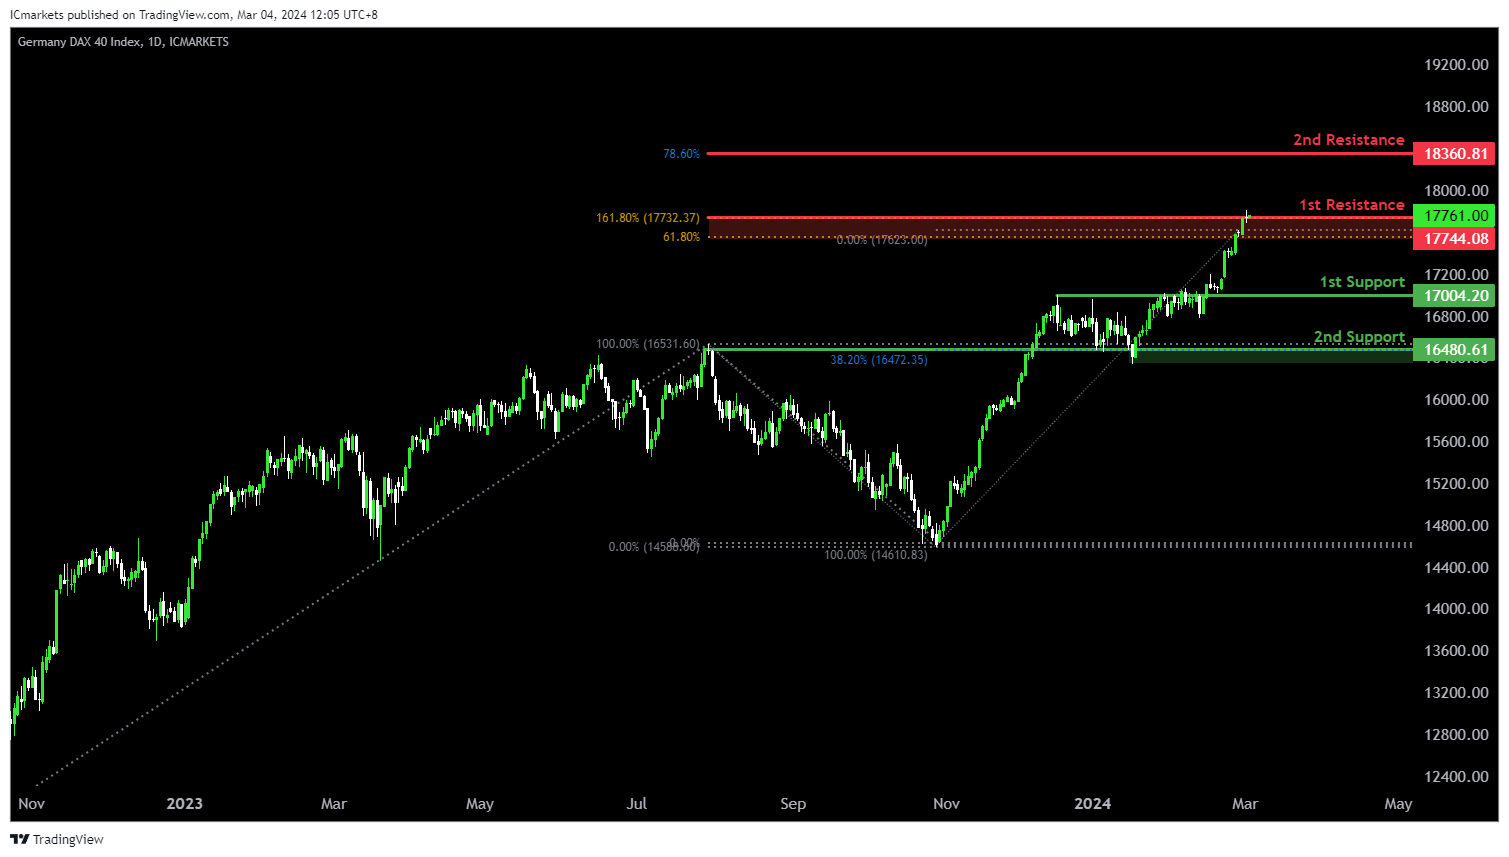
GER40:
The GER40 chart currently demonstrates an overall bullish momentum, suggesting a potential bullish breakout through the 1st resistance and rise towards the 2nd resistance.
The 1st resistance level at 17,7744.08 is identified as a resistance that aligns with a confluence of Fibonacci levels i.e. the 61.80% Projection and the 161.80% Extension. Higher up, the 2nd resistance level at 18,360.81 is marked as a resistance that aligns with the 78.60% Fibonacci Projection level, adding to its significance as a potential barrier to further bullish movement.
On the support side, the 1st support level at 17,004.20 is identified as an overlap support. Additionally, the 2nd support level at 16,480.61 is also noted as an overlap support that aligns with the 38.20% Fibonacci Retracement level, further reinforcing its importance as a potential area of support.
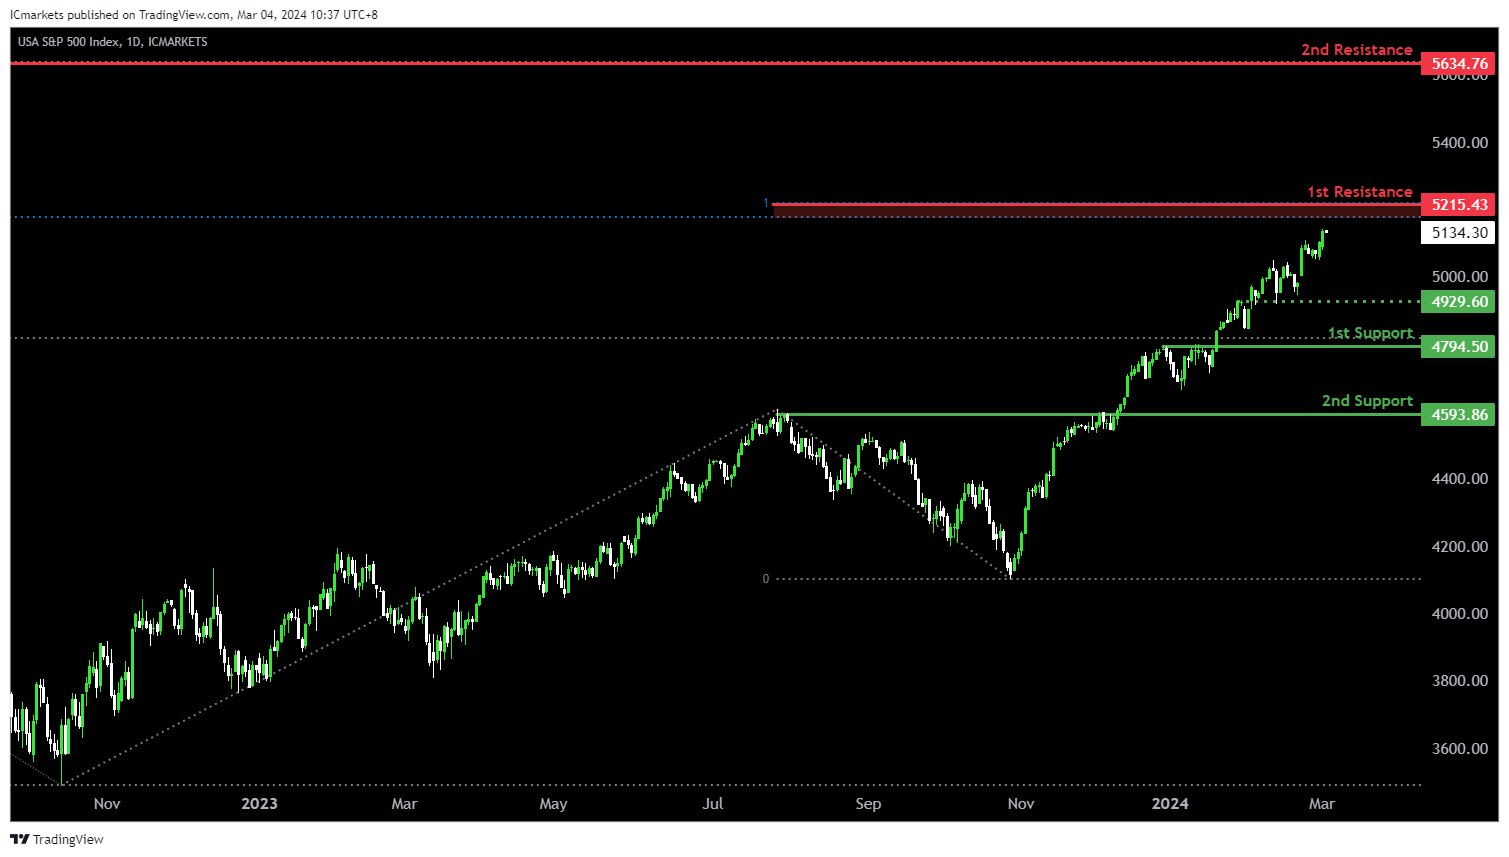
US500:
The US500 chart currently demonstrates an overall bullish momentum. In this context, there is a potential scenario for price to rise towards the 1st resistance.
The 1st resistance level at 5,215.43 is identified as a resistance that aligns with a confluence of Fibonacci levels i.e. the 127.20% Extension and the 100.00% Projection. Higher up, the 2nd resistance level at 5,634.76 is noted as a resistance that aligns with the 161.80% Fibonacci Extension level, adding to its significance as a potential barrier to further bullish movement.
On the support side, the 1st support level at 4,794.50 is identified as a pullback support. Further below, the 2nd support level at 4,593.86 is also marked as a pullback support, further reinforcing its significance as a potential area of support.
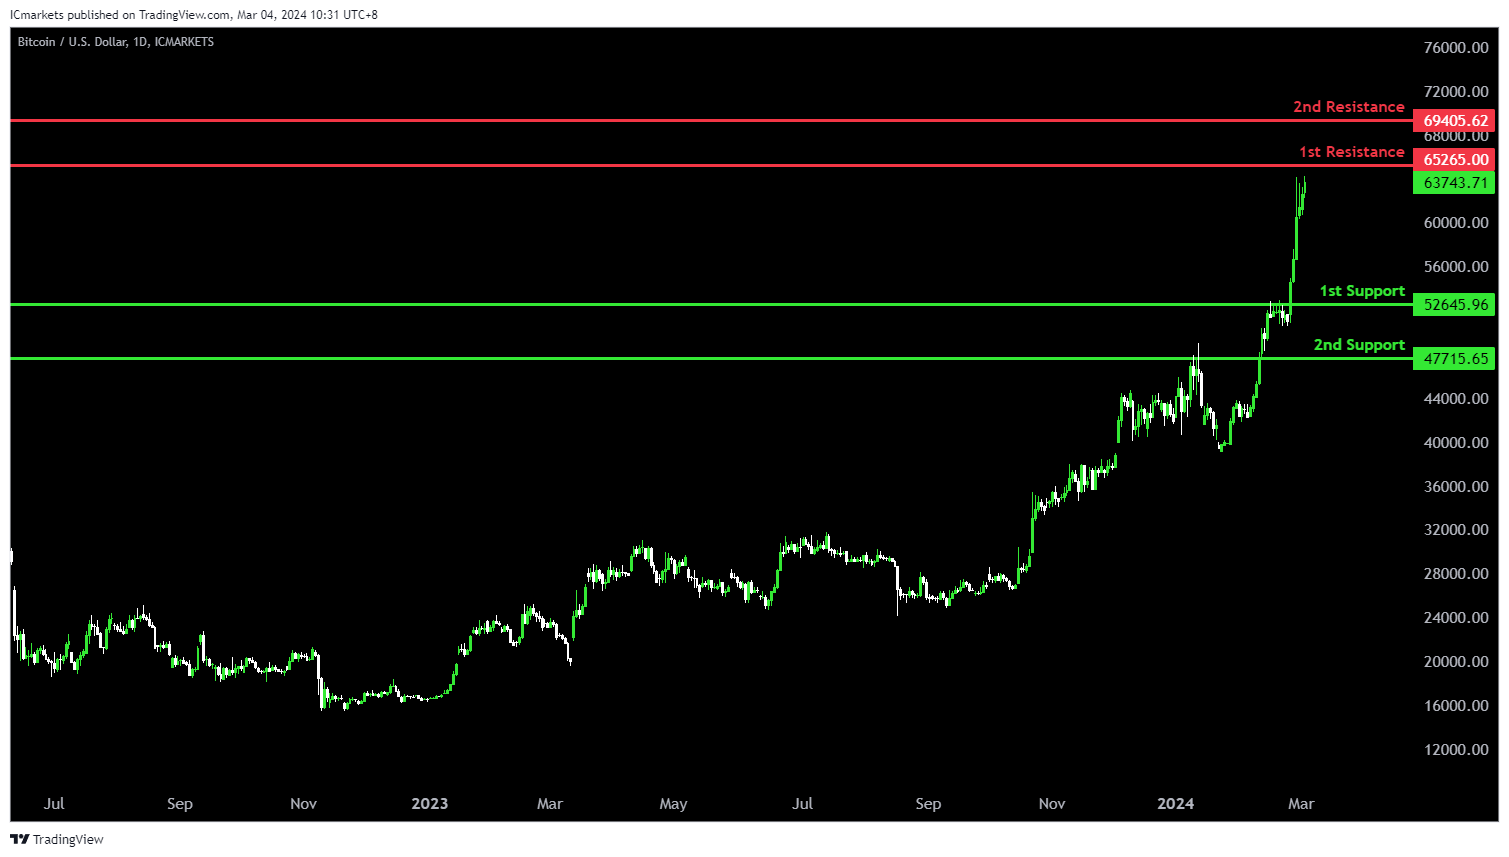
BTC/USD:
The BTC/USD chart currently demonstrates an overall bullish momentum, suggesting a potential continuation of the upward trend towards the 1st resistance.
The 1st resistance level at 65,265.00 is identified as a swing-high resistance. Higher up, the 2nd resistance level at 69,405.62 is also noted as a swing-high resistance at the all-time high, adding to its significance as a potential barrier to further bullish movement.
On the support side, the 1st support level at 52,645.96 is identified as an overlap support. Further below, the 2nd support level at 47,715.65 is also marked as an overlap support, further reinforcing its significance as a potential area of support.
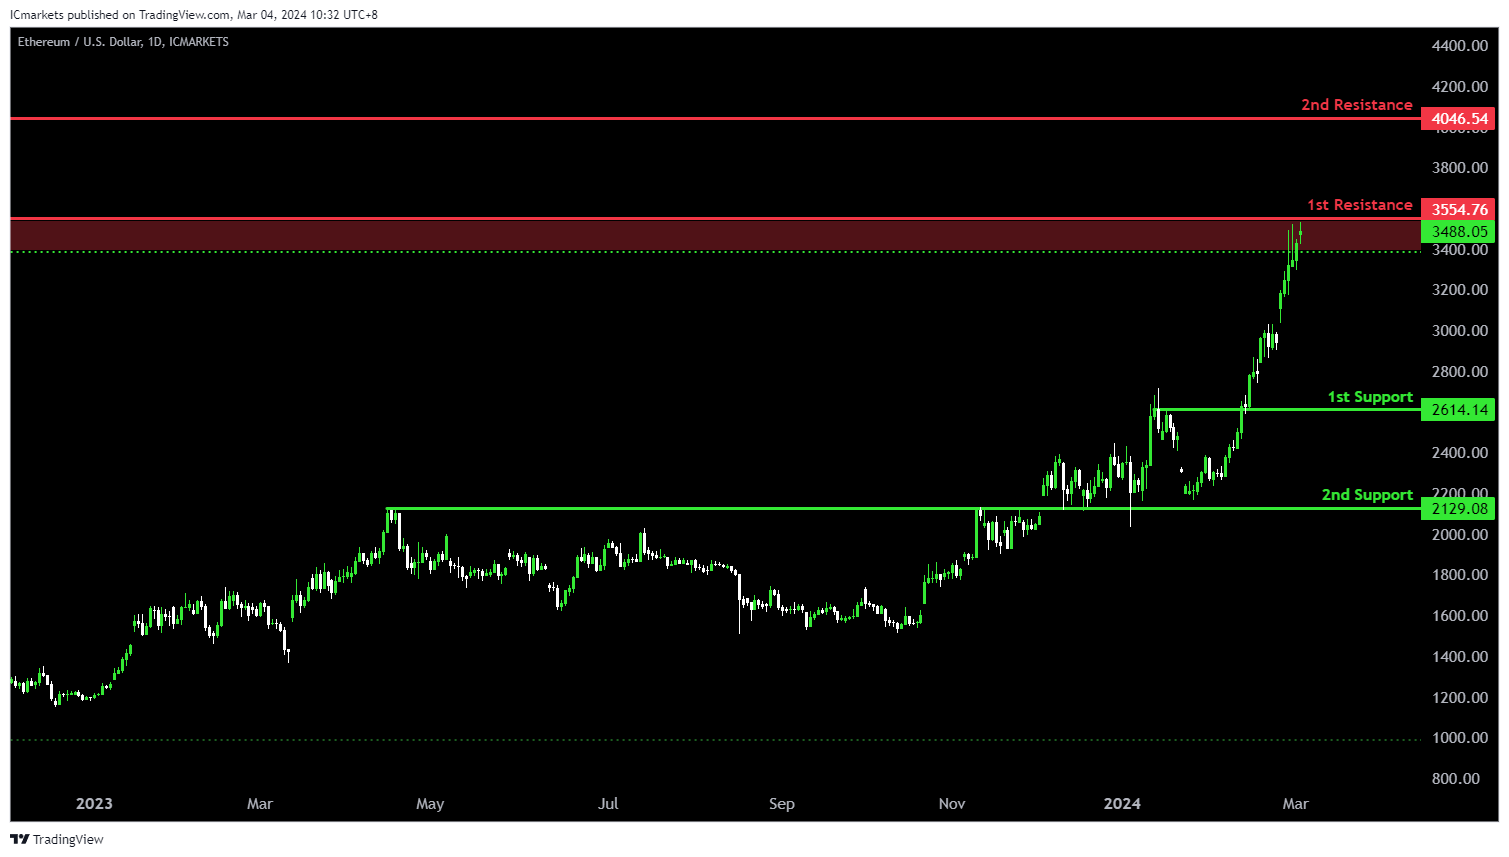
ETH/USD:
The ETH/USD chart currently demonstrates an overall bullish momentum, suggesting a potential continuation of the upward trend towards the 1st resistance.
The 1st resistance level at 3,554.76 is identified as a pullback resistance that aligns with the 61.80% Fibonacci Retracement level. Higher up, the 2nd resistance level at 4,046.54 is also noted as a pullback resistance that aligns with the 78.60% Fibonacci Retracement level, adding to its significance as a potential barrier to further bullish movement.
On the support side, the 1st support level at 2,614.14 is identified as a pullback support. Further below, the 2nd support level at 2,129.08 is marked as an overlap support, further reinforcing its significance as a potential area of support.
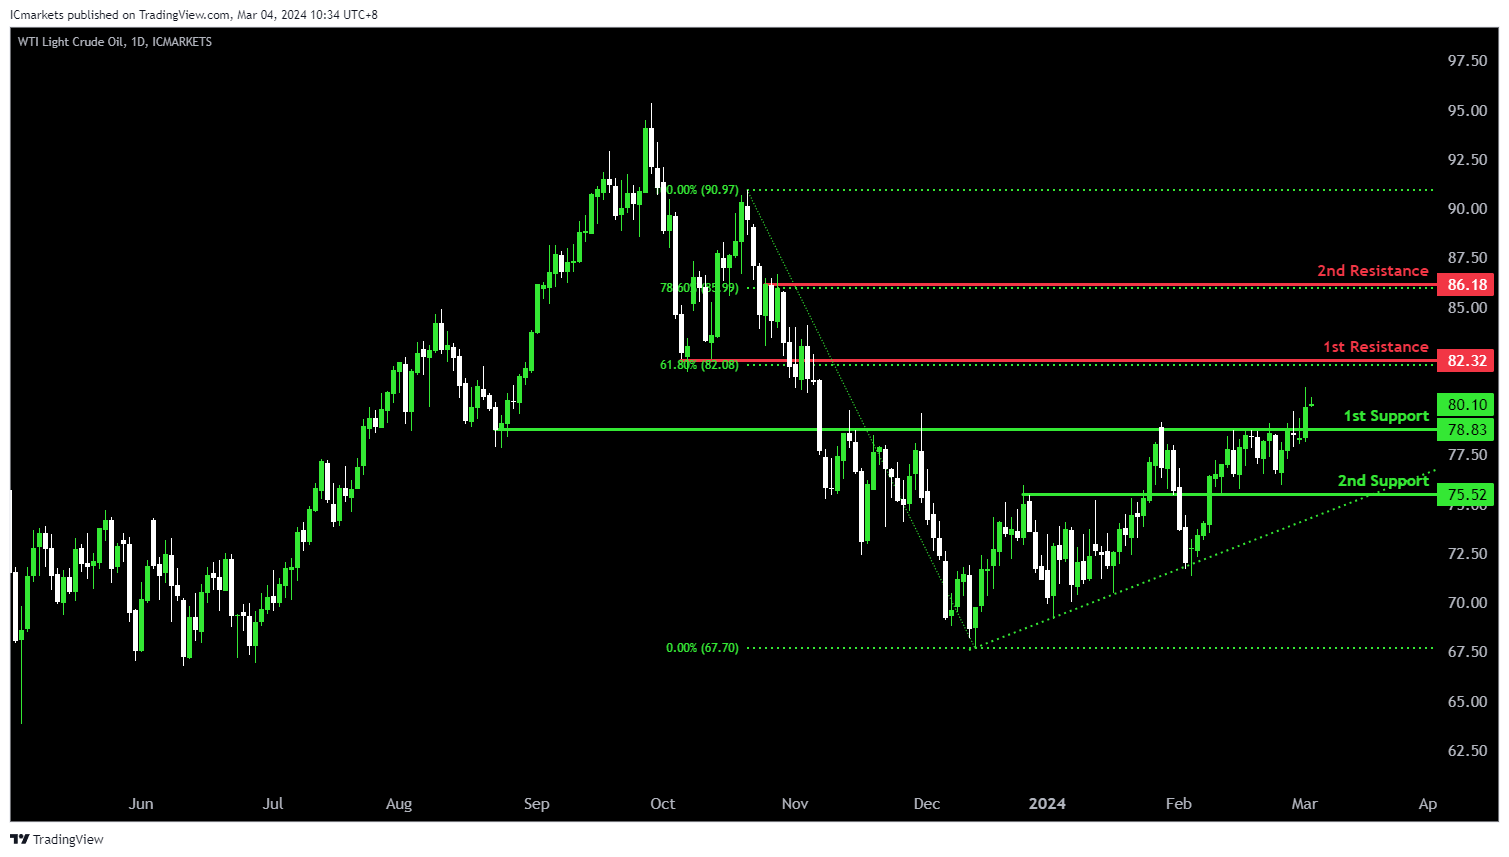
WTI/USD:
The WTI (West Texas Intermediate) chart currently exhibits an overall bullish momentum. In this context, there is a potential scenario for price to rise towards the 1st resistance.
The 1st resistance level at 82.32 is identified as a pullback resistance that aligns with the 61.80% Fibonacci Retracement level. Higher up, the 2nd resistance level at 86.18 is also marked as a pullback resistance that aligns with the 78.60% Fibonacci Retracement level, further highlighting its importance as a potential resistance zone.
To the downside, the 1st support level at 78.83 is identified as an overlap support. Further below, the 2nd support level at 75.52 is also marked as an overlap support, reinforcing its significance as a key support level.
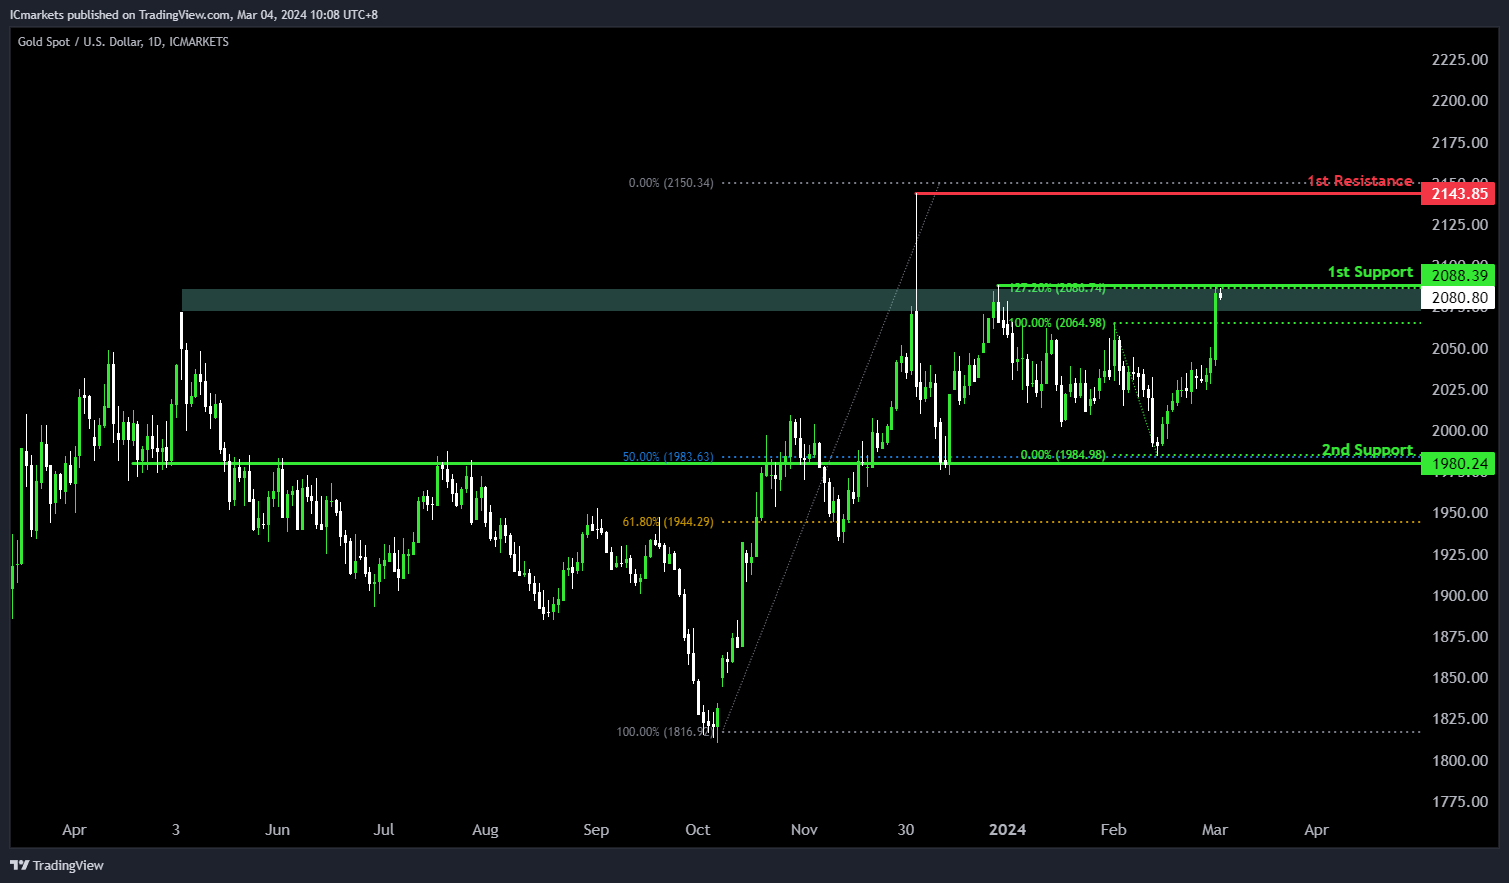
XAU/USD (GOLD):
The XAUUSD chart is currently experiencing bearish momentum, indicating a potential continuation towards the 1st support level.
The 1st support at 2088.39 is recognized as a swing low support, coinciding with the 127.20% Fibonacci Extension level. Historically, this level has provided significant support, potentially indicating a point where buying interest could emerge.
Furthermore, the 2nd support at 1980.24 is characterized as an overlap support, aligning with the 50% Fibonacci Retracement level. This reinforces its significance as a level where buyers have historically intervened to prevent further decline.
On the resistance side, the 1st resistance at 2143.85 is identified as a swing high resistance, suggesting its historical importance as a barrier where selling pressure may increase, potentially limiting upward movement.
The accuracy, completeness and timeliness of the information contained on this site cannot be guaranteed. IC Markets does not warranty, guarantee or make any representations, or assume any liability regarding financial results based on the use of the information in the site.
News, views, opinions, recommendations and other information obtained from sources outside of www.icmarkets.com.au, used in this site are believed to be reliable, but we cannot guarantee their accuracy or completeness. All such information is subject to change at any time without notice. IC Markets assumes no responsibility for the content of any linked site.
The fact that such links may exist does not indicate approval or endorsement of any material contained on any linked site. IC Markets is not liable for any harm caused by the transmission, through accessing the services or information on this site, of a computer virus, or other computer code or programming device that might be used to access, delete, damage, disable, disrupt or otherwise impede in any manner, the operation of the site or of any user’s software, hardware, data or property.


