
Key risk events today:
UK Final Manufacturing PMI; OPEC-JMMC Meetings; Canada Manufacturing PMI.
(Previous analysis as well as outside sources – italics).
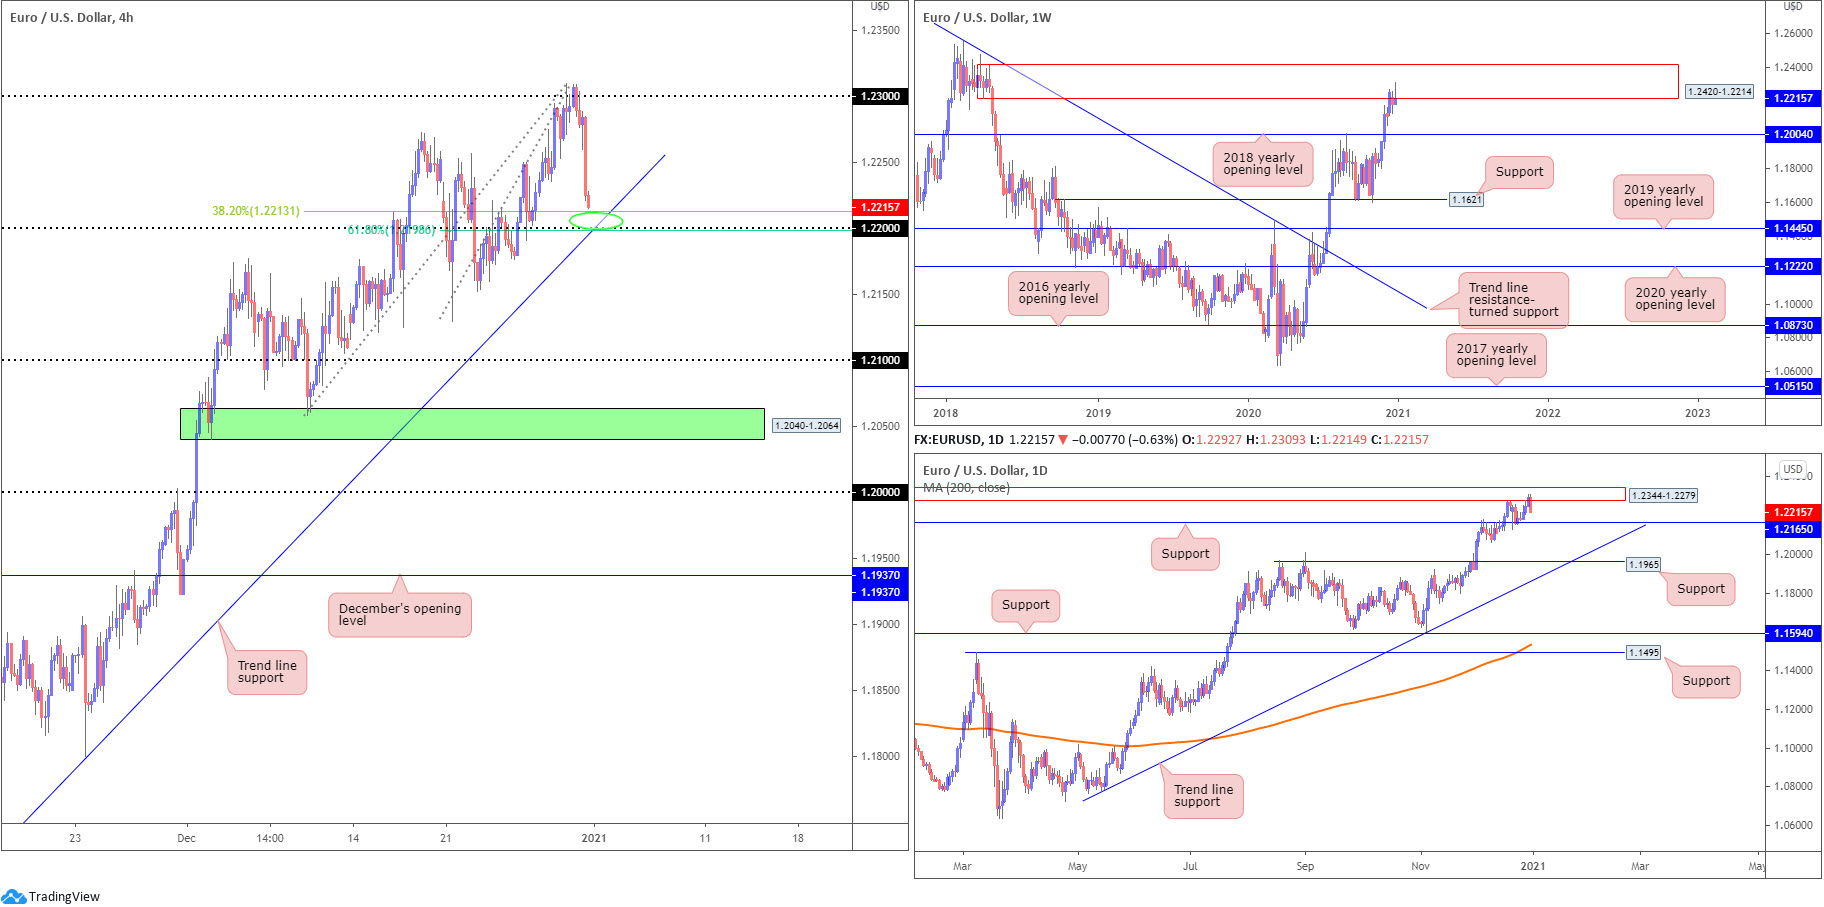
EUR/USD:
Weekly gain/loss: +0.30%
Weekly close: 1.2215
Weekly perspective:
Supply at 1.2420-1.2214 remains central focus on the weekly scale, with last week establishing a shooting star pattern off multi-month peaks at 1.2310.
Heading into 2021, should sellers take the reins, the 2018 yearly opening value at 1.2004 is likely a level downside movement may target. In terms of trend, however, upside remains favoured – more so if price overthrows the 1.2555 February 12 high (2018). The above implies buyers could take the wheel and attempt to overthrow the aforementioned supply zone.
Daily perspective:
Nestled within the walls of weekly supply mentioned above at 1.2420-1.2214 is a daily supply base coming in at 1.2344-1.2279.
1.2344-1.2279 was a key zone in the later stages of December, with December 31 creating a clear-cut bearish pivot-point off the underside of the daily supply. Support at 1.2165 is in sight this week; a break lower exposes another layer of support at 1.1965 and a merging trend line support, extended from the low 1.0774.
H4 perspective:
A bout of profit taking and lack of bids witnessed EUR/USD snap a three-day bullish phase off 1.23 Thursday, consequently swinging the pendulum in favour of retesting the 1.22 figure and converging trend line support, taken from the low 1.1602. Also technically appealing around 1.22 are the 38.2% and 61.8% Fibonacci retracement ratios at 1.2213 and 1.2198, respectively.
Stripping bids from 1.22 this week shines the spotlight on the 1.21 figure, due to a lack of obvious support seen south of 1.22.
Areas of consideration:
- 22 based on the H4 timeframe brings together H4 Fibonacci support and trend line support. This confluence could tempt a rebound from 1.22 (in line with the current uptrend – seen clearly on the weekly and daily timeframes). The 1.23 figure represents a reasonably obvious (initial) upside target.
- A H4 close beneath 1.22, on the other hand, signals a possible bearish scenario, bolstered on the back of weekly supply at 2420-1.2214 and daily supply drawn from 1.2344-1.2279. Downside targets rest at daily support from 1.2165, followed by the 1.21 figure on the H4.
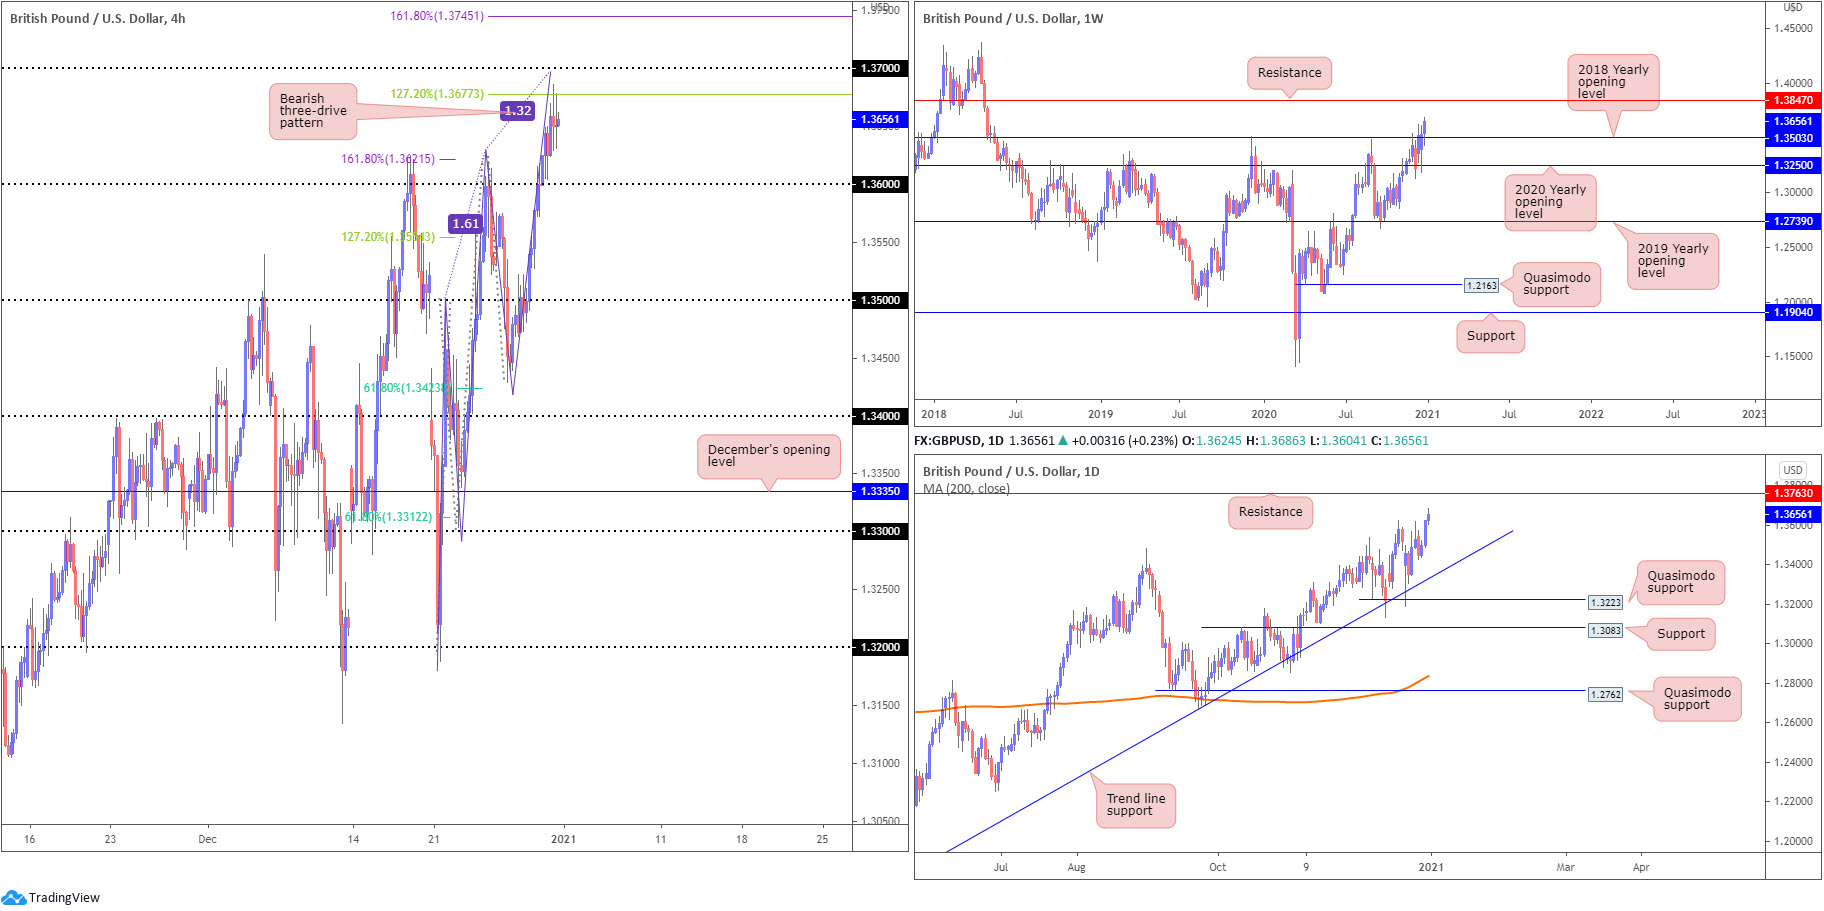
GBP/USD:
Weekly gain/loss: +0.92%
Weekly close: 1.3656
Weekly perspective:
Sterling concluded 2020 at fresh multi-month highs against a broadly softer US dollar, as GBP traders digest recent Brexit flow and current lockdowns.
As you can see, price action ousted the 2018 yearly opening value at 1.3503 and retested the level as support in the last week of 2020. In the event buyers strengthen their grip this week, resistance at 1.3847 may make an appearance.
Also of technical interest was the engulf of 1.3514 (December 9 [2019] high), helping to confirm the current uptrend.
Daily perspective:
The combination of Quasimodo support at 1.3223 and trend line support, etched from the low 1.1409, elevated GBP/USD in the final weeks of 2020.
Resistance (previous Quasimodo support level) is seen overhead at 1.3763, a location sellers could attempt to defend this week and possibly halt efforts to reach weekly resistance mentioned above at 1.3847.
H4 perspective:
Since December 20, the H4 candles have formed a three-drive bearish formation, with a termination zone seen between the 161.8%/127.2% Fibonacci projection points at 1.3745 and 1.3677, respectively (it is common to focus on the 127.2% ratios; however, leaving the 161.8% on the chart provides price some wiggle room and an area to help determine stop-loss placement).
Areas of consideration:
- The H4 three-drive bearish pattern at 1.3745/1.3677 could be a zone worth monitoring.
- Against the backdrop of H4 flow, both the daily and weekly timeframes suggest buyers are likely to push for at least daily resistance at 1.3763. On top of this, GBP/USD recently broke through a notable high (weekly timeframe), suggesting an upside bias. As a result, H4 pattern sellers are likely to struggle to pass 1.36.
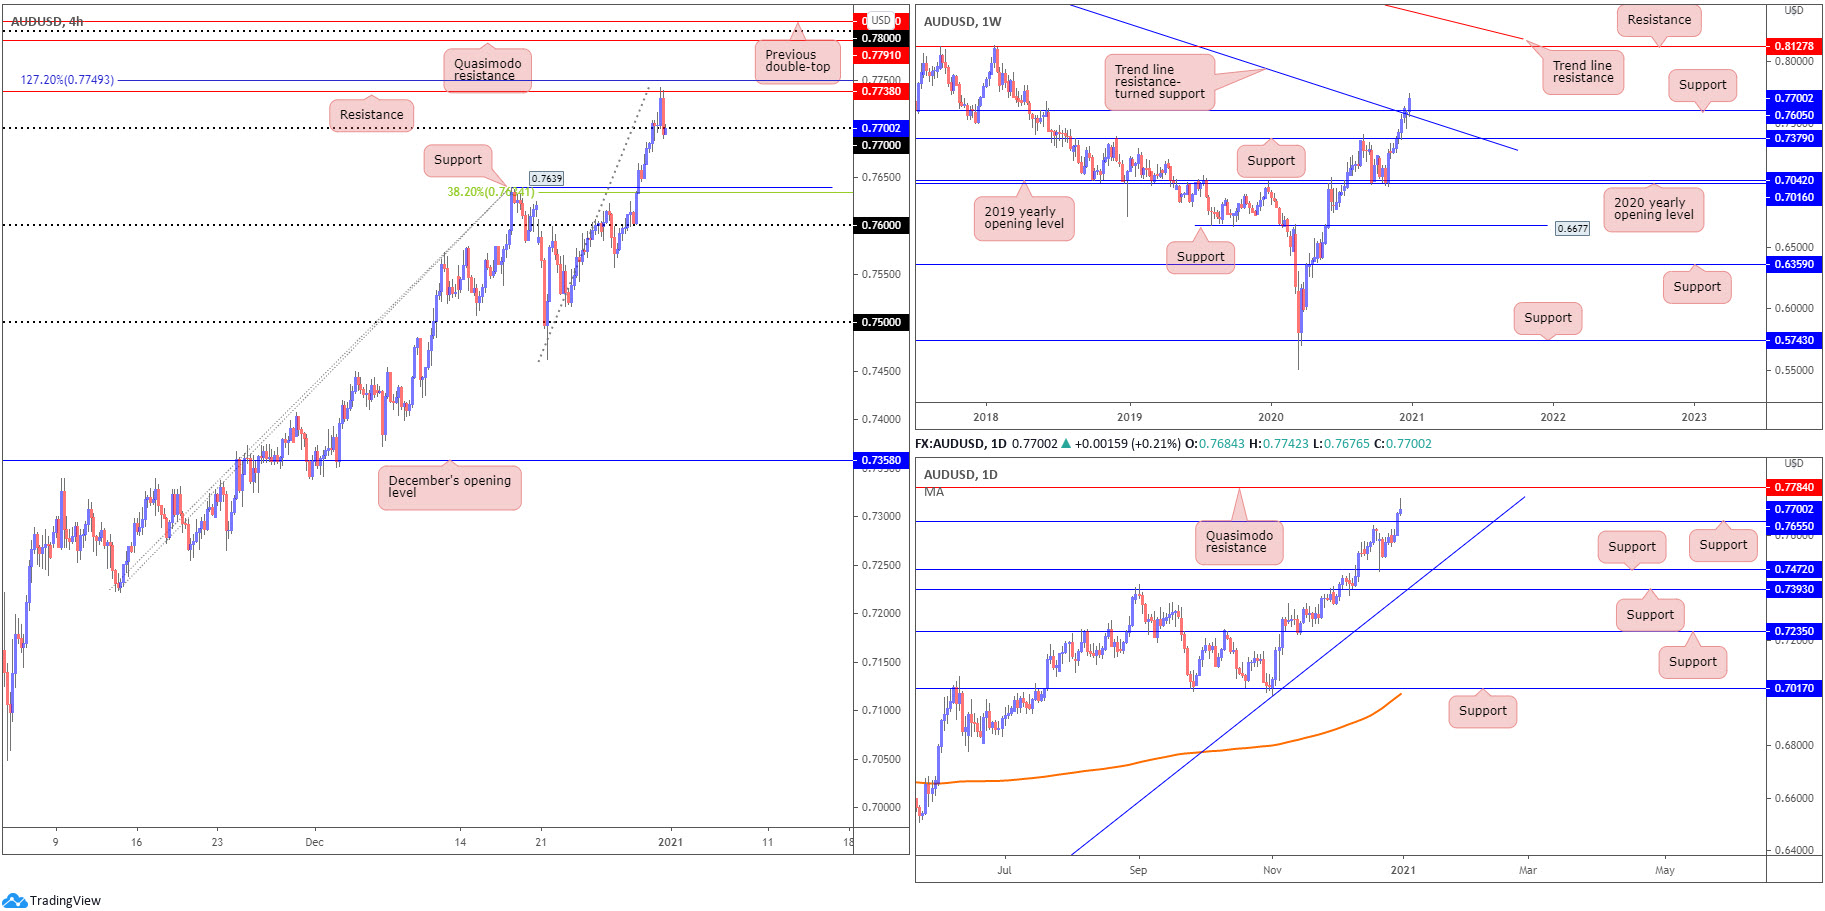
AUD/USD:
Weekly gain/loss: +1.40%
Weekly close: 0.7700
Weekly perspective:
The Australian dollar wrapped up 2020 on the front foot against the US dollar, sailing to a fresh 28-month high at 0.7742. Consequently, the trend remains firmly to the upside.
Price glided through Quasimodo resistance at 0.7605 (now serving support) and trend line resistance, taken from the high 1.1065. This places buyers in a strong position as we enter 2021 with room to possibly reach as far north as resistance coming in at 0.8127.
Daily perspective:
December 31 finished in the shape of a shooting star, following two consecutive daily bullish candles. Resistance-turned support is present nearby at 0.7655, with Quasimodo resistance plotted at 0.7784 directly above.
Any selling pressure derived from the end-of-year shooting star may force the unit to shake hands with 0.7655 support.
H4 perspective:
With the DXY staging a modest year-end rebound, AUD/USD spun lower from resistance at 0.7738, sited just south of a 127.2% Fibonacci projection point at 0.7749 (taken from the low 0.7221). Above, traders may want to acknowledge Quasimodo resistance at 0.7791, the 0.78 figure and a previous double-top formation at 0.7810.
Thursday saw the pair mildly breach 0.77 and retest the underside into the close. A sustained depreciation this week is likely to encounter support at 0.7639 and a 38.2% Fibonacci retracement ratio at 0.7634.
Areas of consideration:
- Overall, the AUD/USD’s technical trend remains pointing north.
- The daily bearish candle pattern could provide enough confidence to hold short-term sell positions under 0.77 on the H4.
- H4 support at 0.7639 offers an interesting level, having seen the base form just under daily support priced at 0.7655.
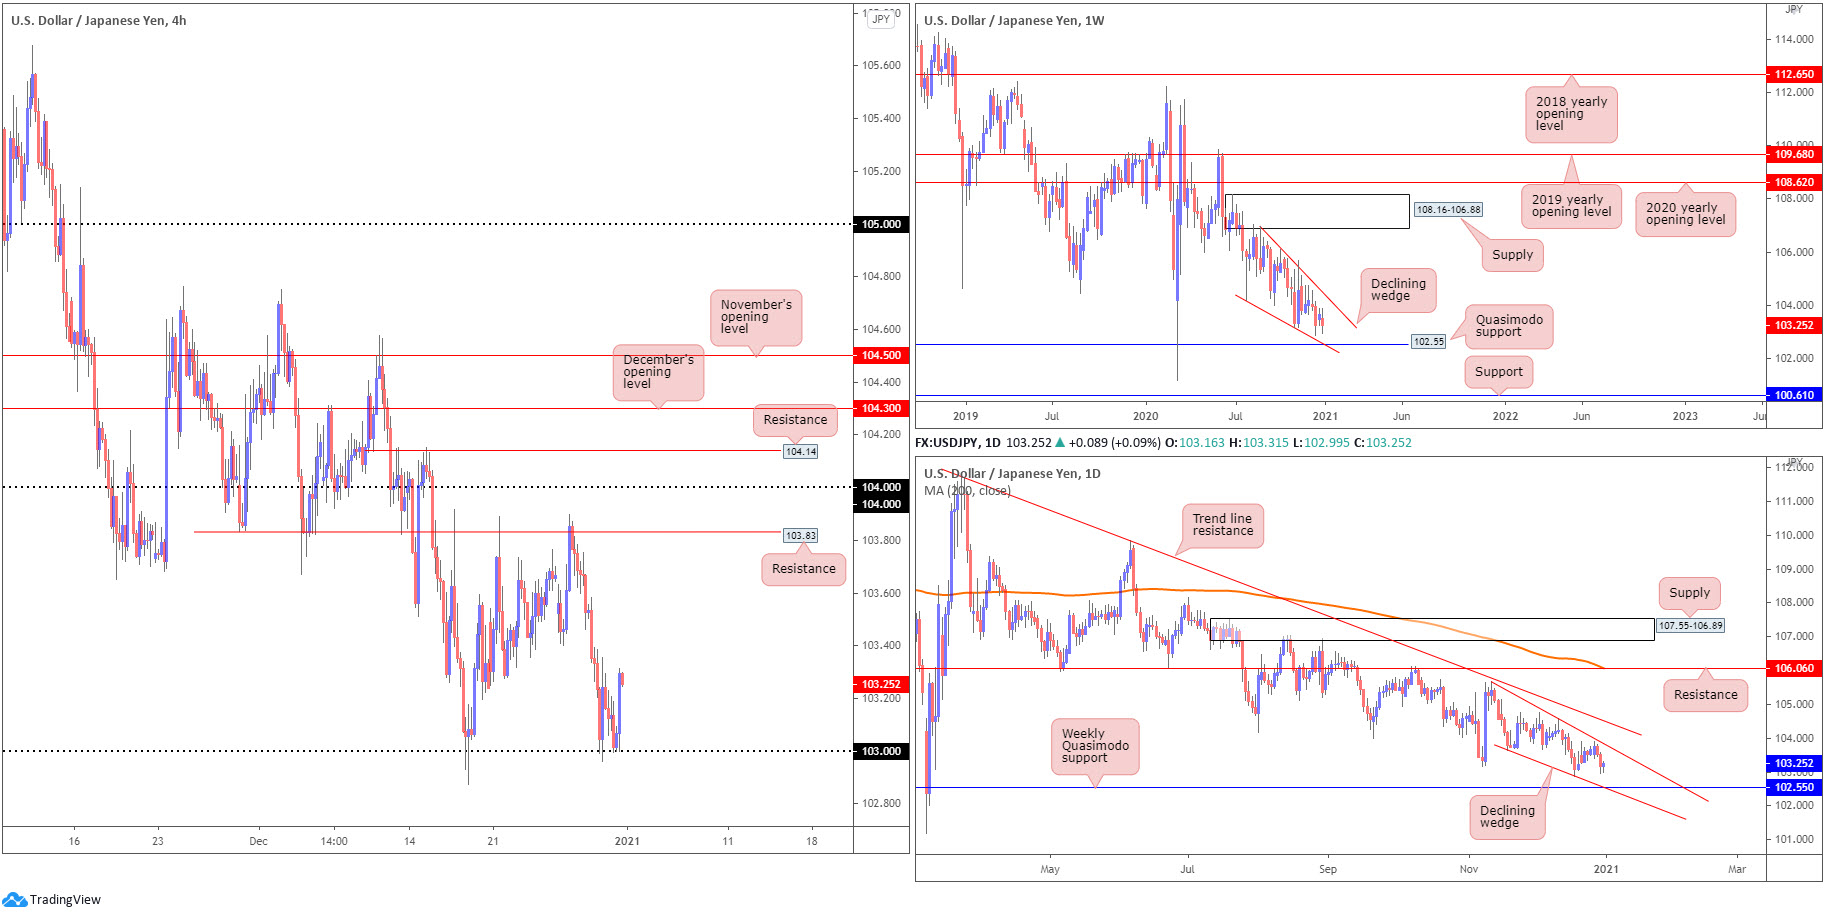
USD/JPY:
Weekly gain/loss: -0.40%
Weekly close: 103.25
Weekly perspective:
Since connecting with the underside of weekly supply at 108.16-106.88 in August, price has gradually shifted lower and developed a weekly declining wedge (106.94/104.18).
Quasimodo support at 102.55 is also in the picture this week, with a break revealing support plotted at 100.61. A strong bounce from 102.55, however, may provide enough impetus for buyers to attempt a breakout above the current declining wedge.
Daily perspective:
The technical landscape on the daily timeframe reveals price closing in on the noted weekly Quasimodo support at 102.55.
Technical traders may also acknowledge the declining wedge forming between 105.67/103.65, and trend line resistance directly above, taken from the high 111.71.
H4 perspective:
103 proved efficient support in December, though buyers failed to find fresh terrain north of resistance at 103.83, leaving the 104 figure unchallenged.
This leaves 103 in a vulnerable position, with the 102 figure seen as the next support (though weekly Quasimodo support at 102.55 could hamper downside), followed by Quasimodo support placed at 101.54.
Areas of consideration:
- The 103 figure offers support to work with on the H4, with proven resistance stationed at 103.83.
- Both weekly and daily timeframes are in the process of forming declining wedges.
- Overpowering 103 this week unlocks a potential bearish theme to weekly Quasimodo support at 102.55, followed by the 102 figure on the H4.
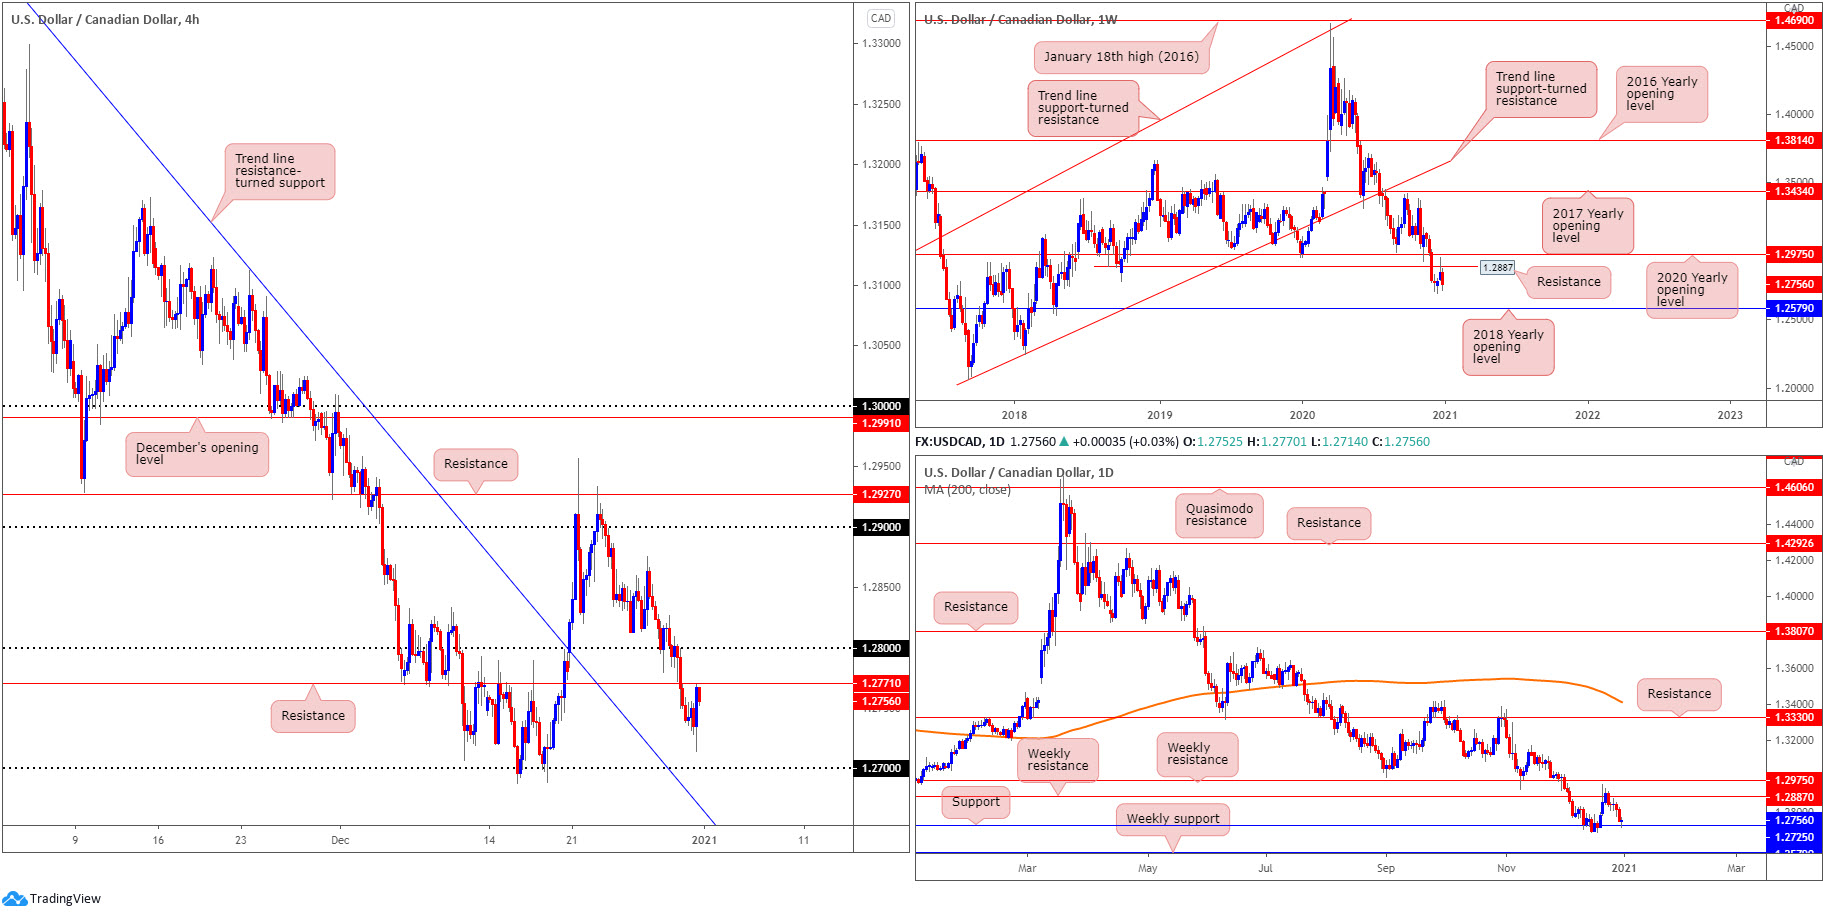
USD/CAD:
Weekly gain/loss: -0.67%
Weekly close: 1.2756
Weekly perspective:
December saw USD/CAD obliterate the 2020 yearly opening value at 1.2975 and Quasimodo support coming in at 1.2887. With 1.2887 serving as resistance, sustained downside in the early weeks of 2021 places the 2018 yearly opening value at 1.2579 in the firing line.
Also important to note is that long-term flow (trend) has been pointing lower since topping in March (2020).
Daily perspective:
According to the daily timeframe, support is in play at 1.2725, following price rejecting weekly resistance at 1.2887 (and a near-test of weekly resistance from 1.2975).
Sellers taking control this week could override 1.2725 and set the technical stage to head for weekly support mentioned above at 1.2579 (the 2018 yearly opening value).
H4 perspective:
Thursday chalked up a bottom ahead of the 1.27 figure, helped by the US dollar index snapping a two-day bearish phase.
Up ahead we can see resistance at 1.2771 and the 1.28 figure. 1.2771 is an interesting level, having seen the barrier serve well as support and resistance during December.
Below 1.27, trend line resistance-turned support is seen, taken from the high 1.3389.
Areas of consideration:
- Coming off weekly resistance at 1.2887, and knowing the pair has been grinding lower since early 2020, this could spark a bearish scenario over the course of January. Yet, daily support at 1.2725 may pose a problem.
- H4 resistance at 1.2771 is likely on the watchlists for many sellers this week. Traders, however, are urged to pencil in the possibility of a fakeout to 1.28.
The accuracy, completeness and timeliness of the information contained on this site cannot be guaranteed. IC Markets does not warranty, guarantee or make any representations, or assume any liability regarding financial results based on the use of the information in the site.
News, views, opinions, recommendations and other information obtained from sources outside of www.icmarkets.com.au, used in this site are believed to be reliable, but we cannot guarantee their accuracy or completeness. All such information is subject to change at any time without notice. IC Markets assumes no responsibility for the content of any linked site.
The fact that such links may exist does not indicate approval or endorsement of any material contained on any linked site. IC Markets is not liable for any harm caused by the transmission, through accessing the services or information on this site, of a computer virus, or other computer code or programming device that might be used to access, delete, damage, disable, disrupt or otherwise impede in any manner, the operation of the site or of any user’s software, hardware, data or property


